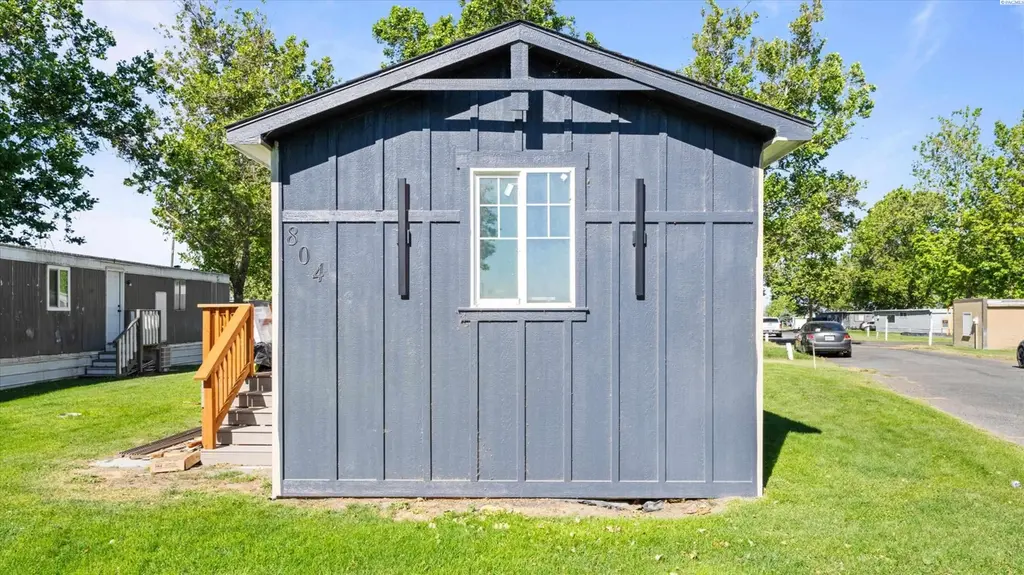
1505 S Road 40 Trailer 804 #804 · Pasco, WA
Flood risk 1/10 · Minimal
- FEMA flood zone
- —
- Chance of flooding over 30 yrs
- 0.0%
- Est. flood insurance / yr
- —
Fire risk 3/10 · Minor
- Est. fire insurance / yr
- $604 – $1,122
Heat risk 4/10 · Minor
- Hot days now (above 100°F)
- 5 days/yr
- Hot days in 30 yrs
- 11 days/yr
Wind risk 1/10 · Minimal
- Chance of severe wind over 30 yrs
- —
Air-quality risk 7/10 · Major
- Unhealthy air days now
- 10 days/yr
- Unhealthy air days in 30 yrs
- 10 days/yr
Risk factors via First Street. Map © Google.
Why this score? — see what drove the B grade
The composite is a weighted blend of 9 inputs, each scored 0–100. Each bar is that input's sub-score; the figure is the points it added to the 100-point composite (weight × sub-score).
- Cash flow +30.0/30.0
- 1% rule +10.0/10.0
- DSCR +10.0/10.0
- ARV discount +7.5/15.0
- Livability +4.0/5.0
- Schools +3.4/10.0
- Rent growth +3.0/5.0
- Condition / age +2.5/5.0
- Appreciation +0.0/10.0
$92,000
🖨 Deal sheet (PDF) 📄 Offer letter ✓ Due diligence
Listing remarks
MLS# 293828 Welcome to this charming 2-bedroom, 1-bath home that has been taken down to the studs and rebuilt from the inside out. This isn't a cosmetic flip — nearly everything here is brand new, giving you the peace of mind of new construction at a price that makes owning your own home a reality. Step inside to an open-concept living and kitchen area filled with natural light. The kitchen is the showstopper: crisp white shaker cabinets, quartz countertops, a center island with designer fluted wood detailing, a stainless range hood, and a modern matte-black faucet. New luxury vinyl plank flooring runs throughout, paired with fresh drywall, designer gray paint, and recessed lighting i
Key facts
- Quartz countertops
- Stainless range hood
- Fresh drywall
Tags
Property features AI
Exterior
- Parking: No garage
- Utilities: Public water; Sewer connected; Electricity connected
- Home design: Manufactured home (single wide); One story; Residential property in a multi-family zoning area; New construction
- Construction: Manufactured construction
- Exterior features: Public water; Sewer connected; Electricity on property
Interior
- Flooring: Laminate
- Bathrooms: 1 full bathroom
- Heating & cooling: Central Air conditioning
- Interior features: Laminate flooring; No basement
Neighborhood map
What this means for you Summary
Snapshot
- This is a 2-bed/1.0-bath manufactured listed at $92k.
Deal economics
- At list price, monthly cash flow is $547 ($7k/yr) — positive.
- The deal already cash-flows at list — no discount required.
- Meets the 1% rule at list price ($1k rent vs $92k).
- Cap rate 13.4% vs local median 3.0% in Pasco — top-decile yield for the area; either an underpriced asset or a hidden risk that comps aren't pricing in. Stress-test before assuming the spread holds.
Location & tenants
- Location reads 79/100 on livability (#104 in WA, #1,999 nationally) — a middle-class / working-renter tenant base. Strengths: commute A+, housing A+, health & safety A+; Watch: crime D+.
- Pasco School District (suburban): math 31% / reading 40% proficiency, ranked #242 of 291 in WA (top 83%) — families likely to look elsewhere, expect single-tenant / working-renter base with shorter leases; 61% free/reduced lunch — lower-income household profile, screen leases tightly.
- Zoned schools: Virgie Robinson Elementary (500 students, 95% FRL); Ellen Ochoa Middle School (886 students, 96% FRL); Chiawana Senior High School (2,999 students, 67% FRL) — zoned schools average 86% FRL vs 61% district-wide (25 pts higher); higher-poverty schools than district average — tighter screening recommended.
- Market conditions: Rents rising (+2.0%/yr); 711 active listings in the ZIP; solid renter incomes; 981 units permitted in Franklin County in 2024 (517 in 5+ unit buildings).
Forward outlook
- Local home prices are declining (-3.0%/yr); year-one equity from $636 of loan paydown is wiped out by about $3k of value loss. Plan a longer hold.
- Franklin County population projected at +50% by 2050 — long-run rental-demand tailwind backs the buy-and-hold thesis.
- At projected returns (-3.0% appreciation + 2.0% rent growth), your $26k cash investment doubles in ~5 years — after that, you're playing with house money.
Negotiation context
- Only 9 days on market — expect competitive offers; lowballing is unlikely to land.
Questions for the listing agent
- Built in 1974 — when were the roof, HVAC, electrical panel, plumbing, and water heater last replaced?
- Is there a deadline driving the sale (1031 exchange, divorce, estate, relocation)? That informs how much negotiation room exists.
- Schools are D-rated, which usually means shorter tenancies and higher turnover. Who's the typical renter profile here, and what's been the actual vacancy rate?
- Crime grade is D in this area — have there been break-ins, vandalism, or insurance claims at this property in the last 3 years? What carrier currently insures it and at what premium?
- What's the average days-on-market for RENTAL listings here right now (not sales)? A rising rental-DOM trend means longer vacancies and softer asking-rent achievability than the comps imply.
- What's the recent tenant-quality profile in this submarket — average credit score on applications, eviction rate, late-payment / NSF rate, and stable-employment percentage? A property-management company in the area should have these aggregated.
- How much new for-sale + rental construction is in the pipeline within 1–3 miles? Heavy new supply typically softens prices + rents 12–24 months out; constrained supply supports both.
Investment metrics
- 1% rule
- 1.63% ✓
- Cap rate
- 13.43%
- Cash-on-cash
- 25.49%
- DSCR
- 2.13
- GRM
- 5.1
CMA / ARV
No comps found within radius.
Projected returns pro-forma
-3.0% appreciation · 1.99% rent growth · sell at horizon
- IRR
- 17.9%
- Equity multiple
- 1.72×
- Total profit
- $18,456
- Equity at exit
- $13,717
- IRR
- 25.7%
- Equity multiple
- 3.13×
- Total profit
- $54,977
- Equity at exit
- $7,954
Cash invested: $25,760 (down + closing). Projections, not guarantees.
Landlord ↔ Tenant lean methodology
- Overall (STATE)
- 28 Tenant-Leaning
- State Washington
- 28 Tenant-Leaning · D+8
- County
- — inherits STATE
- City
- — inherits STATE
ZIP-level market 99301
- Rents YoY
- 2.0%
- Active inventory
- 711
- Price-to-rent
- 5.1×
Monthly cashflow live
- Estimated rent
- $1,497 medium interval (Pro) →
- Mortgage (P&I)
- −$482
- Tax est. 1.5%
- −$115 /mo · $1,380/yr
- Insurance
- −$38
- HOA
- −$0
- Vacancy / Maint / Mgmt
- −$314
- Net cashflow
- $547
Break-even live
Sensitivity live
| Price | -10% $611 | -5% $579 | +0% $547 | +5% $515 | +10% $484 |
|---|---|---|---|---|---|
| Rent | -10% $429 | -5% $488 | +0% $547 | +5% $606 | +10% $665 |
| Rate | -1.0pp $593 | -0.5pp $571 | base $547 | +0.5pp $523 | +1.0pp $499 |
UW: 25.0% down · 7.5% · 30yr · 1.5% tax · 5.0% vac · 8.0% maint · 8.0% mgmt
Financing live
Cash to close
- Down payment
- $23,000
- Closing costs
- $2,760
- Reserves months
- —
- Total cash needed
- —
Loan-product check · same deal, 3 products live
Conventional
25% down · 7.5% · 30yr
- Down + closing
- —
- Monthly P&I
- —
- Monthly cashflow
- —
- DSCR
- —
- Eligible?
- —
Personal DTI + credit; lowest rate.
DSCR
20% down · 8.5% · 30yr
- Down + closing
- —
- Monthly P&I
- —
- Monthly cashflow
- —
- DSCR
- —
- Eligible?
- —
No personal income docs; deal must DSCR.
Hard money
10% down · 12.0% · 12mo
- Down + closing
- —
- Monthly P&I
- —
- Monthly cashflow
- —
- DSCR
- —
- Eligible?
- —
Short-term bridge; refi at stabilization.
Listing history 7 events
-
2026-06-21days on market $92,000 Active 9 DOM
-
2026-06-18days on market $92,000 Active 6 DOM
-
2026-06-17days on market $92,000 Active 5 DOM
-
2026-06-16days on market $92,000 Active 4 DOM
-
2026-06-15days on market $92,000 Active 3 DOM
-
2026-06-13remarks 693-char remark
-
2026-06-13$92,000 Active 1 DOM
ⓘ Source: listings_history table (triggers on properties + properties_extension) + one-shot
backfill from property_details.listing_events for pre-trigger history.
Climate risk First Street
- Flood 1/10 Low 0% chance over 30 yrs
- Wildfire 3/10 Moderate
- Heat 4/10 Moderate 5 d/yr ≥100°F today · 11 d/yr by 30 yrs out
- Wind 1/10 Low
- Air quality 7/10 Severe 10 unhealthy d/yr today · 10 by 30 yrs out
Nearby sold comps map
Loading sold comps map…
Walkable amenities ~0.75 mi
Loading nearby amenities…
Taxation est. · year 1
- Rental income
- $17,969
- − Mortgage interest
- −$5,153
- − Property taxes
- −$1,380
- − Insurance
- −$460
- − Repairs & maintenance
- −$1,437
- − Management
- −$1,437
- − Depreciation
- −$2,676
- Taxable income
- $5,424
- Est. tax owed @ 24.0%
- −$1,302
- After-tax cash flow
- $5,264/yr
For passive investors: Depreciation is non-cash, so a rental often shows a tax loss while cash-flowing — sheltering income. Rental losses are passive: they offset passive income freely, and up to $25,000/yr can offset ordinary (W-2) income if you actively participate and your MAGI is under $100k (phasing out to $0 by $150k); unused losses carry forward. On sale, claimed depreciation is recaptured at up to 25%, and gains may owe capital-gains tax (a 1031 exchange can defer both). Figures are a year-1 estimate at your 24.0% rate — not tax advice; consult a CPA.
Schools (NCES district)
- District
- Pasco School District
- NCES district ID
- 5306570
- Math proficiency
- 31% ▬ 0.00%
- Reading proficiency
- 40% ▬ 0.00%
- Median HH income
- $54,454
- Composite
- 33.78/100
- National rank
- #10401
- State rank
- #242 of 291 in WA
Livability — Pasco
- Score
- 79/100
- State rank
- #104
- US rank
- #1999
Category grades
Schools grade is shown separately in the Schools card above.
Census & demographics
- Census place
- Pasco, WA
- County
- Franklin County · 87,044 people
- City population
- 87,044
- Metro
- Kennewick-Richland, WA
- Population (ZIP)
- 87,044
- Household income
- $87,951
- Rent vs Own
- Severe rent burden
- 1556.0
Population outlook (Franklin County) Hauer SSP2
- Today (2025)
- 108,530 people
- By 2030
- 118,705 · +9.4%
- By 2040
- 140,053 · +29.0%
- By 2050
- 162,360 · +49.6%
- By 2075
- 217,667 · +100.6%
- By 2100
- 264,533 · +143.7%
Race, ethnicity, and origin ACS 2023
- Neighborhood character
- Diverse neighborhood (Simpson 0.56)
- Race & ethnicity
- Hispanic / Latino 55% White 37% Two or more races 22% Black 2% Asian 2% Native American 2%
- Hispanic origin (detail)
- Mexican 51%
- Common ancestry
- Lithuanian 2% Italian 2% Portuguese 2%
- Foreign-born
- 21% · Canada, Vietnam
- Languages at home
- 49% English-only · Spanish 47% Russian/Polish/Slavic 2% Other Asian/Pacific 0%
Political lean MEDSL · Franklin
- 2024 margin
- Strong R (+22.7) · D 37.4% · R 60.1% · Other 2.4%
- 2008→2024 swing
- +1.0pp toward D · 2008: -23.7pp · 2024: -22.7pp
- All cycles
- 2024: R+22.7 2020: R+14.5 2016: R+17.1 2012: R+25.2 2008: R+23.7
Not yet ingested
- Civics
- —
Market trends
- HPI YoY
- ▼ -331.74%
- Current HPI
- 284.481
- Rent YoY
- ▲ 1.99%
- Metro
- Kennewick-Richland, WA
- State GDP YoY
- ▲ 4.65%
- F500 in state
- 22
Industry mix (Fortune 500 HQ in WA)
| Industry | F500 HQs | Revenue |
|---|---|---|
| Retail | 2 | $269B |
|
||
| Technology / Retail | 1 | $638B |
|
||
| Technology | 1 | $245B |
|
||
| Telecommunications | 1 | $38B |
|
||
| Food / Beverage | 1 | $36B |
|
||
| Automotive / Trucks | 1 | $34B |
|
||
Price history
1 event — show timeline
- 2026-06-12 Listed $92,000 PACMLS
Property tax history
+7.4%/yrLatest (2025): $22 · -0.5% YoY. Source: county tax records.
Cash-flow waterfall
monthlySold comps — $/sqft
last 12 mo · ≤1 miLoading sold comps…