13020 Mccrorey Trails Dr · Cut and Shoot, TX
Flood risk No data
- FEMA flood zone
- —
- Chance of flooding over 30 yrs
- —
- Est. flood insurance / yr
- —
Fire risk No data
- Est. fire insurance / yr
- —
Heat risk No data
- Hot days now (above threshold)
- —
- Hot days in 30 yrs
- —
Wind risk No data
- Chance of severe wind over 30 yrs
- —
Air-quality risk No data
- Unhealthy air days now
- —
- Unhealthy air days in 30 yrs
- —
Risk factors via First Street. Map © Google.
Why this score? — see what drove the D grade
The composite is a weighted blend of 9 inputs, each scored 0–100. Each bar is that input's sub-score; the figure is the points it added to the 100-point composite (weight × sub-score).
- Cash flow +18.9/30.0
- DSCR +5.9/10.0
- 1% rule +4.1/10.0
- Schools +3.2/10.0
- ARV discount +3.0/15.0
- Livability +2.8/5.0
- Condition / age +2.5/5.0
- Rent growth +2.4/5.0
- Appreciation +0.0/10.0
$219,990
🖨 Deal sheet (PDF) 📄 Offer letter ✓ Due diligence
Listing remarks MLS
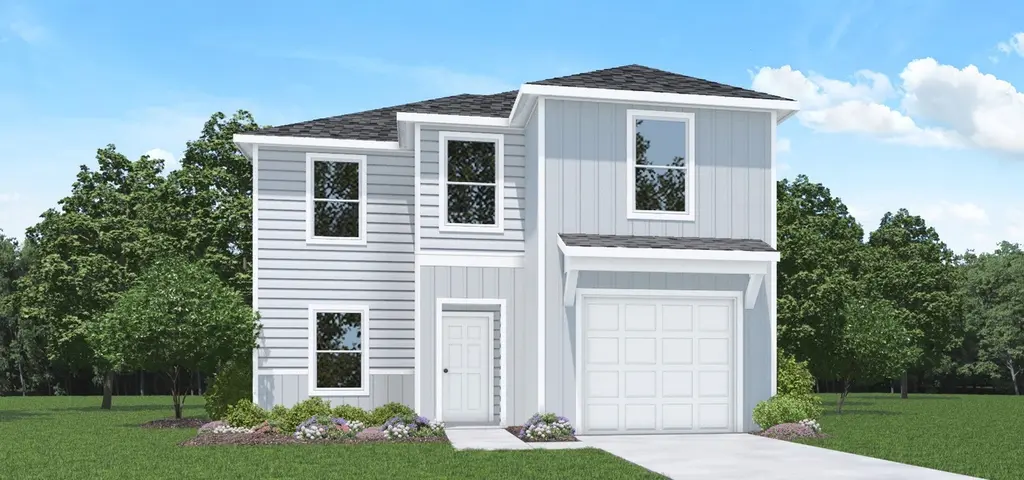
WONDERFUL NEW D.R. HORTON BUILT 2 STORY IN MCCROREY TRAILS! Fantastic Location! Great Open Concept Interior Layout + Popular Split Plan Design! Delightful Island Kitchen with Corner Pantry Opens to Spacious Dining Area AND Adjoining Living Room! Excellent for Functionality AND for Entertaining! Primary Suite Offers Lovely Bath with a Walk-In Closet! Generously Sized Secondary Bedrooms! Convenient Utility Room! Great Community with Park, Pickleball Courts, Basketball Court, and Fishing Pond! Ready for Summer 2026 Move In!
Key facts
- Island kitchen
- Primary suite
- Corner pantry
Tags
Neighborhood map
What this means for you Summary
Snapshot
- This is a 4-bed/2.5-bath land listed at $220k.
Deal economics
- At list price, monthly cash flow is $225 ($3k/yr) — positive.
- The deal already cash-flows at list — no discount required.
- To meet the 1% rule (rent ≥ 1% of price), the offer needs to be $200k (8.9% below list).
- Recommended offer: $200k (8.9% below list) — sets the bar for 1% rule.
- Cap rate 7.5% vs local median 4.9% in Cut and Shoot — top-decile yield for the area; either an underpriced asset or a hidden risk that comps aren't pricing in. Stress-test before assuming the spread holds.
Location & tenants
- Location reads 56/100 on livability (#1,326 in TX) — a working-class tenant base; expect higher turnover. Strengths: cost of living A+, housing A+; Watch: crime D-, amenities F, commute F.
- Willis ISD (rural): math 33% / reading 40% proficiency, ranked #458 of 826 in TX (top 55%) — families likely to look elsewhere, expect single-tenant / working-renter base with shorter leases.
- Zoned schools: Edward B Cannan El (math 34% / reading 32%, grade F, #2,208 of 4,322 statewide, top 52%, 672 students, 74% FRL); Lynn Lucas Middle (math 23% / reading 32%, grade F, #1,156 of 1,662 statewide, top 71%, 971 students, 74% FRL); Willis H S (math 19% / reading 46%, grade F, #1,029 of 1,632 statewide, top 64%, 2,521 students, 57% FRL).
- Market conditions: Rents soft (-0.3%/yr); 721 active listings in the ZIP; 1 comparable units currently listed for rent nearby; solid renter incomes; 13,259 units permitted in Montgomery County in 2024 (1,402 in 5+ unit buildings).
- This rent runs 32% of the median local income ($75k/yr) — at the standard rent-burdened threshold; future hikes will face affordability resistance.
Forward outlook
- Local home prices are declining (-3.0%/yr); year-one equity from $2k of loan paydown is wiped out by about $7k of value loss. Plan a longer hold.
- Montgomery County population projected at +65% by 2050 — long-run rental-demand tailwind backs the buy-and-hold thesis.
Negotiation context
- It's been on market 71 days — a 6% lower offer ($207k) is reasonable based on typical stale-listing flexibility.
Questions for the listing agent
- It's been on market 71 days. Have you received any prior offers? Is the seller open to a 9% concession, seller financing, or rate buy-down credit?
- What does the HOA fee cover, when was the last increase, and are there any pending special assessments or reserve-fund shortfalls?
- Why hasn't it sold? Are there any deal-killer items the seller is aware of (foundation, flood, title, zoning, code violations)?
- Is there a deadline driving the sale (1031 exchange, divorce, estate, relocation)? That informs how much negotiation room exists.
- Schools are F-rated, which usually means shorter tenancies and higher turnover. Who's the typical renter profile here, and what's been the actual vacancy rate?
- Crime grade is D in this area — have there been break-ins, vandalism, or insurance claims at this property in the last 3 years? What carrier currently insures it and at what premium?
- The area grade is low — what's the realistic commute time and amenity access for the typical tenant pool here? Any planned neighborhood developments (good or bad) we should know about?
- What's the average days-on-market for RENTAL listings here right now (not sales)? A rising rental-DOM trend means longer vacancies and softer asking-rent achievability than the comps imply.
- What's the recent tenant-quality profile in this submarket — average credit score on applications, eviction rate, late-payment / NSF rate, and stable-employment percentage? A property-management company in the area should have these aggregated.
- How much new for-sale + rental construction is in the pipeline within 1–3 miles? Heavy new supply typically softens prices + rents 12–24 months out; constrained supply supports both.
Investment metrics
- 1% rule
- 0.91% ✗
- Cap rate
- 7.52%
- Cash-on-cash
- 4.38%
- DSCR
- 1.19
- GRM
- 9.2
CMA / ARV
- ARV (median comp)
- $200,177
- List price
- $219,990
- Delta
- 9.90%
- Verdict
- FAIR
- Comps
- 20 within 1.0 mi
Projected returns pro-forma
-3.0% appreciation · 0.0% rent growth · sell at horizon
- IRR
- -12.6%
- Equity multiple
- 0.56×
- Total profit
- $-27,263
- Equity at exit
- $32,801
- IRR
- -8.4%
- Equity multiple
- 0.54×
- Total profit
- $-28,267
- Equity at exit
- $19,021
Cash invested: $61,597 (down + closing). Projections, not guarantees.
Landlord ↔ Tenant lean methodology
- Overall (STATE)
- 87 Strongly Landlord-Friendly
- State Texas
- 87 Strongly Landlord-Friendly · R+5
- County
- — inherits STATE
- City
- — inherits STATE
ZIP-level market 77303
- Home prices YoY
- -22.4%
- Rents YoY
- -0.3%
- Active inventory
- 721
- Price-to-rent
- 9.2×
Monthly cashflow live
- Estimated rent
- $2,003 medium interval (Pro) →
- Mortgage (P&I)
- −$1,154
- Tax from tax record
- −$62 /mo · $749/yr
- Insurance
- −$92
- HOA
- −$50
- Vacancy / Maint / Mgmt
- −$421
- Net cashflow
- $225
Break-even live
Sensitivity live
| Price | -10% $349 | -5% $287 | +0% $225 | +5% $163 | +10% $100 |
|---|---|---|---|---|---|
| Rent | -10% $67 | -5% $146 | +0% $225 | +5% $304 | +10% $383 |
| Rate | -1.0pp $336 | -0.5pp $281 | base $225 | +0.5pp $168 | +1.0pp $110 |
UW: 25.0% down · 7.5% · 30yr · 1.5% tax · 5.0% vac · 8.0% maint · 8.0% mgmt
Financing live
Cash to close
- Down payment
- $54,998
- Closing costs
- $6,600
- Reserves months
- —
- Total cash needed
- —
Loan-product check · same deal, 3 products live
Conventional
25% down · 7.5% · 30yr
- Down + closing
- —
- Monthly P&I
- —
- Monthly cashflow
- —
- DSCR
- —
- Eligible?
- —
Personal DTI + credit; lowest rate.
DSCR
20% down · 8.5% · 30yr
- Down + closing
- —
- Monthly P&I
- —
- Monthly cashflow
- —
- DSCR
- —
- Eligible?
- —
No personal income docs; deal must DSCR.
Hard money
10% down · 12.0% · 12mo
- Down + closing
- —
- Monthly P&I
- —
- Monthly cashflow
- —
- DSCR
- —
- Eligible?
- —
Short-term bridge; refi at stabilization.
Rent comps 1 comps
| Address | Beds | Baths | Sqft | Rent | $/sqft | DOM | Units | Dist |
|---|---|---|---|---|---|---|---|---|
| 12366 Sword Point Ct Willis, TX | 3.0 | 3.0 | 1206 | $1,750 | $1.45 | 45d | 1 | 0.43mi |
HOA detail
- Monthly dues
- $50 · $600/yr
Listing history 16 events
-
2026-06-21days on market $219,990 Active 71 DOM
-
2026-06-18days on market $219,990 Active 68 DOM
-
2026-06-17days on market $219,990 Active 67 DOM
-
2026-06-16days on market $219,990 Active 66 DOM
-
2026-06-15days on market $219,990 Active 65 DOM
-
2026-06-13days on market $219,990 Active 63 DOM
-
2026-06-09days on market $219,990 Active 59 DOM
-
2026-06-08days on market $219,990 Active 58 DOM
-
2026-06-07days on market $219,990 Active 57 DOM
-
2026-06-04days on market $219,990 Active 54 DOM
-
2026-06-03days on market $219,990 Active 53 DOM
-
2026-06-02days on market $219,990 Active 52 DOM
-
2026-06-01days on market $219,990 Active 51 DOM
-
2026-05-31days on market $219,990 Active 50 DOM
-
2026-05-18price $219,990 526-char remark
Show marketing remark (526 chars)
WONDERFUL NEW D.R. HORTON BUILT 2 STORY IN MCCROREY TRAILS! Fantastic Location! Great Open Concept Interior Layout + Popular Split Plan Design! Delightful Island Kitchen with Corner Pantry Opens to Spacious Dining Area AND Adjoining Living Room! Excellent for Functionality AND for Entertaining! Primary Suite Offers Lovely Bath with a Walk-In Closet! Generously Sized Secondary Bedrooms! Convenient Utility Room! Great Community with Park, Pickleball Courts, Basketball Court, and Fishing Pond! Ready for Summer 2026 Move In!
-
2026-04-11$224,990 Active 526-char remark
Show marketing remark (526 chars)
WONDERFUL NEW D.R. HORTON BUILT 2 STORY IN MCCROREY TRAILS! Fantastic Location! Great Open Concept Interior Layout + Popular Split Plan Design! Delightful Island Kitchen with Corner Pantry Opens to Spacious Dining Area AND Adjoining Living Room! Excellent for Functionality AND for Entertaining! Primary Suite Offers Lovely Bath with a Walk-In Closet! Generously Sized Secondary Bedrooms! Convenient Utility Room! Great Community with Park, Pickleball Courts, Basketball Court, and Fishing Pond! Ready for Summer 2026 Move In!
ⓘ Source: listings_history table (triggers on properties + properties_extension) + one-shot
backfill from property_details.listing_events for pre-trigger history.
Tax reassessment forecast TX · Resets to sale price
- Current annual tax
- $749 · $62/mo
- Projected year-2 tax
- $4,026 · $335/mo
- Expected delta
- +$3,276/yr (+$273/mo · 437.2%)
ⓘ Screening estimate from a state-policy table — verify with the county assessor before closing.
Nearby sold comps map
Loading sold comps map…
Walkable amenities ~0.75 mi
Loading nearby amenities…
Taxation est. · year 1
- Rental income
- $24,041
- − Mortgage interest
- −$12,323
- − Property taxes
- −$749
- − Insurance
- −$1,100
- − Repairs & maintenance
- −$1,923
- − Management
- −$1,923
- − HOA
- −$600
- − Depreciation
- −$6,400
- Taxable loss
- −$978
- Est. tax savings @ 24.0%
- +$235
- After-tax cash flow
- $2,934/yr
For passive investors: Depreciation is non-cash, so a rental often shows a tax loss while cash-flowing — sheltering income. Rental losses are passive: they offset passive income freely, and up to $25,000/yr can offset ordinary (W-2) income if you actively participate and your MAGI is under $100k (phasing out to $0 by $150k); unused losses carry forward. On sale, claimed depreciation is recaptured at up to 25%, and gains may owe capital-gains tax (a 1031 exchange can defer both). Figures are a year-1 estimate at your 24.0% rate — not tax advice; consult a CPA.
Schools (NCES district)
- District
- Willis ISD
- NCES district ID
- 4845900
- Math proficiency
- 33% ▼ -15.00%
- Reading proficiency
- 40% ▼ -2.00%
- Median HH income
- $57,828
- Composite
- 32.32/100
- National rank
- #5746
- State rank
- #458 of 826 in TX
Livability — Cut and Shoot
- Score
- 56/100
- State rank
- #1326
- US rank
- #22835
Category grades
Schools grade is shown separately in the Schools card above.
Census & demographics
- County
- Montgomery County · 663,713 people
- Metro
- Houston-The Woodlands-Sugar Land, TX
- Population (ZIP)
- 28,854
- Household income
- $75,348
- Rent vs Own
- Severe rent burden
- 464.0
Population outlook (Montgomery County) Hauer SSP2
- Today (2025)
- 713,896 people
- By 2030
- 805,263 · +12.8%
- By 2040
- 992,708 · +39.1%
- By 2050
- 1,179,590 · +65.2%
- By 2075
- 1,628,084 · +128.1%
- By 2100
- 1,937,880 · +171.5%
Race, ethnicity, and origin ACS 2023
- Neighborhood character
- Diverse neighborhood (Simpson 0.56)
- Race & ethnicity
- White 54% Hispanic / Latino 38% Two or more races 17% Black 4%
- Hispanic origin (detail)
- Mexican 25%
- Common ancestry
- Lithuanian 1% Romanian 1% Slovak 1%
- Foreign-born
- 13% · Canada, Jamaica
- Languages at home
- 69% English-only · Spanish 31%
Political lean MEDSL · Montgomery
- 2024 margin
- Solid R (+45.5) · D 26.8% · R 72.3%
- 2008→2024 swing
- +7.2pp toward D · 2008: -52.7pp · 2024: -45.5pp
- All cycles
- 2024: R+45.5 2020: R+43.8 2016: R+51.4 2012: R+60.7 2008: R+52.7
Not yet ingested
- Civics
- —
Market trends
- HPI YoY
- ▼ -77.71%
- Current HPI
- 269.5367
- Rent YoY
- ▼ -0.31%
- Metro
- Houston-The Woodlands-Sugar Land, TX
- State GDP YoY
- ▲ 3.95%
- F500 in state
- 110
Industry mix (Fortune 500 HQ in TX)
| Industry | F500 HQs | Revenue |
|---|---|---|
| Energy | 16 | $1,198B |
|
||
| Technology | 5 | $198B |
|
||
| Engineering / Construction | 4 | $72B |
|
||
| Energy Services | 3 | $60B |
|
||
| Utilities | 3 | $41B |
|
||
| Healthcare | 2 | $330B |
|
||
Price history
-2.2% since first listed2 events — show timeline
- 2026-05-18 Price Changed $219,990 HARMLS
- 2026-04-11 Listed $224,990 HARMLS
Cash-flow waterfall
monthlySold comps — $/sqft
last 12 mo · ≤1 miLoading sold comps…