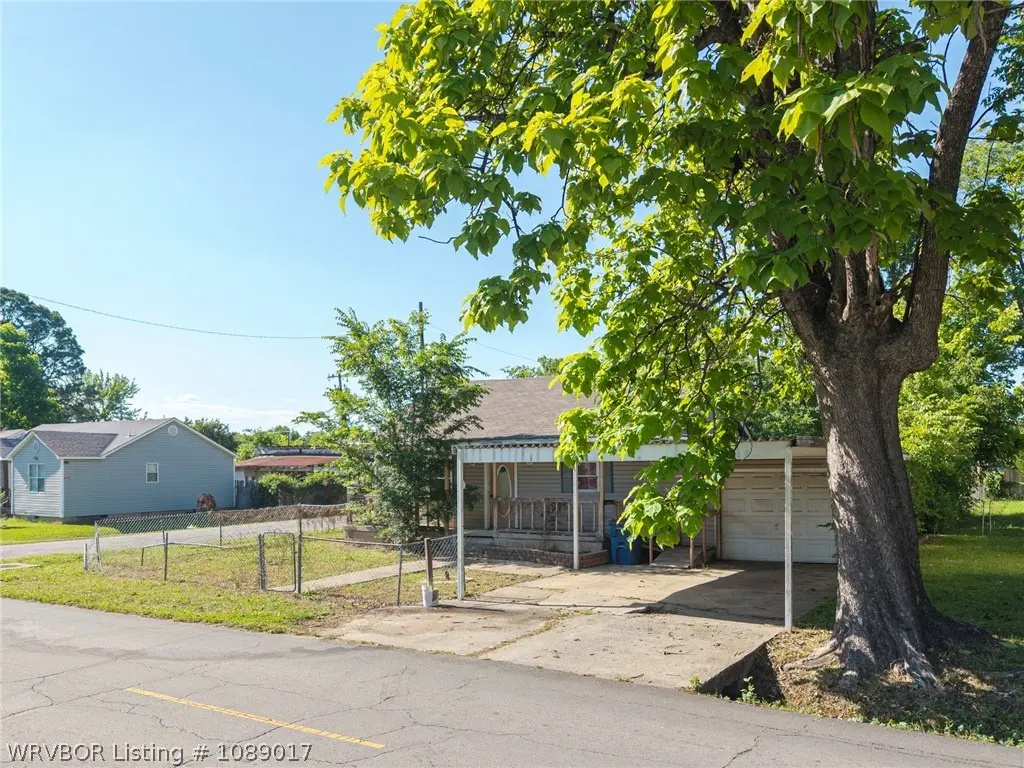
4301 Spradling Ave · Fort Smith, AR
Flood risk 1/10 · Minimal
- FEMA flood zone
- X (unshaded)
- Chance of flooding over 30 yrs
- 0.0%
- Est. flood insurance / yr
- $507 – $1,088
Fire risk 3/10 · Minor
- Est. fire insurance / yr
- $1,499 – $2,785
Heat risk 7/10 · Major
- Hot days now (above 111°F)
- 7 days/yr
- Hot days in 30 yrs
- 20 days/yr
Wind risk 2/10 · Minimal
- Chance of severe wind over 30 yrs
- 3.0%
Air-quality risk 2/10 · Minimal
- Unhealthy air days now
- 0 days/yr
- Unhealthy air days in 30 yrs
- 1 days/yr
Risk factors via First Street. Map © Google.
Why this score? — see what drove the B- grade
The composite is a weighted blend of 9 inputs, each scored 0–100. Each bar is that input's sub-score; the figure is the points it added to the 100-point composite (weight × sub-score).
- Cash flow +30.0/30.0
- 1% rule +10.0/10.0
- DSCR +10.0/10.0
- ARV discount +7.5/15.0
- Livability +3.2/5.0
- Schools +3.1/10.0
- Rent growth +2.5/5.0
- Condition / age +2.5/5.0
- Appreciation +0.0/10.0
$40,000
🖨 Deal sheet (PDF) 📄 Offer letter ✓ Due diligence
Listing remarks
Attention Investors! Home on corner lot, over 1100sqft and convenient locations! Home is being sold AS-IS and needs TLC. Enter at own risk, floor/decking in need of repair.
Key facts
- Garage
- Built 1970
- Listed 3 days
Property features AI
Exterior
- Parking: Attached garage with 1 covered space; Concrete parking surface
- Utilities: Electricity available
- Home design: Single-family house; One level / single-story
- Construction: Vinyl siding; Block foundation; Shingle roof
- Exterior features: Covered patio/porch; Partial fencing; Cleared lot; Corner lot; Publicly maintained road access
Interior
- Kitchen: Convection oven; Oven
- Flooring: Laminate
- Bathrooms: 1 full bathroom
- Heating & cooling: Central heating; Central air; Ceiling fan(s) for cooling
- Interior features: Ceiling fans
- Laundry & utility: Electric dryer hookup; Electric water heater
Neighborhood map
What this means for you Summary
Snapshot
- This is a 3-bed/1.0-bath single-family listed at $40k.
Deal economics
- At list price, monthly cash flow is $486 ($6k/yr) — positive.
- The deal already cash-flows at list — no discount required.
- Meets the 1% rule at list price ($965 rent vs $40k).
- Cap rate 20.9% vs local median 4.3% in Fort Smith — top-decile yield for the area; either an underpriced asset or a hidden risk that comps aren't pricing in. Stress-test before assuming the spread holds.
Location & tenants
- Location reads 65/100 on livability (#151 in AR) — a middle-class / working-renter tenant base. Strengths: cost of living A+, housing A+, health & safety A+; Watch: crime F, amenities F, commute F.
- Fort Smith School District (urban): math 35% / reading 39% proficiency, ranked #106 of 238 in AR (top 44%) — families likely to look elsewhere, expect single-tenant / working-renter base with shorter leases; 64% free/reduced lunch — lower-income household profile, screen leases tightly.
- Zoned schools: Spradling Elementary School (math 31% / reading 27%, grade F, #324 of 454 statewide, top 72%, 319 students, 94% FRL); Dora Kimmons Jr. High School (math 22% / reading 32%, grade F, #156 of 201 statewide, top 78%, 841 students, 91% FRL); Northside High School (math 12% / reading 27%, grade F, #239 of 292 statewide, top 85%, 2,433 students, 74% FRL) — zoned schools average 86% FRL vs 64% district-wide (22 pts higher); higher-poverty schools than district average — tighter screening recommended.
- Market conditions: 98 active listings in the ZIP; 5 comparable units currently listed for rent nearby; rentals at typical pace (median 23d on market — plan ~3-4 weeks tenant-placement turnaround); lower-income renter base — watch delinquency; 388 units permitted in Sebastian County in 2024 (16 in 5+ unit buildings).
Forward outlook
- Local home prices are declining (-3.0%/yr); year-one equity from $277 of loan paydown is wiped out by about $1k of value loss. Plan a longer hold.
- Sebastian County population projected at +7% by 2050 — modest demand growth; plan on rents tracking national, not racing it.
- At projected returns (-3.0% appreciation + 3.0% rent growth), your $11k cash investment doubles in ~3 years — after that, you're playing with house money.
Negotiation context
- Only 3 days on market — expect competitive offers; lowballing is unlikely to land.
Risks & watch-outs
- Climate carrying-cost: extreme-heat days projected 7→20/yr by 2055 (HVAC capex compounding) — expect insurance premiums to compound above CPI over the hold.
Questions for the listing agent
- Built in 1970 — when were the roof, HVAC, electrical panel, plumbing, and water heater last replaced?
- Is there a deadline driving the sale (1031 exchange, divorce, estate, relocation)? That informs how much negotiation room exists.
- Schools are D-rated, which usually means shorter tenancies and higher turnover. Who's the typical renter profile here, and what's been the actual vacancy rate?
- Crime grade is F in this area — have there been break-ins, vandalism, or insurance claims at this property in the last 3 years? What carrier currently insures it and at what premium?
- What's the average days-on-market for RENTAL listings here right now (not sales)? A rising rental-DOM trend means longer vacancies and softer asking-rent achievability than the comps imply.
- What's the recent tenant-quality profile in this submarket — average credit score on applications, eviction rate, late-payment / NSF rate, and stable-employment percentage? A property-management company in the area should have these aggregated.
- How much new for-sale + rental construction is in the pipeline within 1–3 miles? Heavy new supply typically softens prices + rents 12–24 months out; constrained supply supports both.
Investment metrics
- 1% rule
- 2.41% ✓
- Cap rate
- 20.88%
- Cash-on-cash
- 52.09%
- DSCR
- 3.32
- GRM
- 3.5
CMA / ARV
- ARV (on-the-fly)
- $138,744
- Comps found
- 12
Show comp detail 12 sales within ~0.75 mi
| Address | Dist | Beds/Ba | Sqft | Sold | Price | $/sf | Match |
|---|---|---|---|---|---|---|---|
| 4301 Spradling Ave | 0.00mi | 3/1.0 | 1,128 (0%) | 1mo | $45,000 | $40 | 99 |
| 3404 N 47th St | 0.30mi | 3/2.0 | 1,120 (-1%) | 1mo | $145,000 | $129 | 80 |
| 3620 N 48th St | 0.32mi | 3/2.0 | 1,057 (-6%) | 4mo | $159,900 | $151 | 68 |
| 4616 Johnson St | 0.58mi | 3/1.5 | 1,160 (+3%) | 3mo | $144,900 | $125 | 64 |
| 2912 Blair Ave | 0.75mi | 3/1.0 | 1,141 (+1%) | 1mo | $115,000 | $101 | 63 |
| 4705 Johnson St | 0.57mi | 3/2.0 | 1,160 (+3%) | 4mo | $143,000 | $123 | 62 |
| 3605 Wilma Ave | 0.49mi | 3/1.0 | 1,014 (-10%) | 1mo | $157,000 | $155 | 59 |
| 3610 N Johnson St | 0.68mi | 3/1.0 | 1,068 (-5%) | 1mo | $55,000 | $51 | 59 |
| 3513 Eller Ave | 0.55mi | 3/2.0 | 1,195 (+6%) | 3mo | $175,000 | $146 | 57 |
| 4600 Wirsing Ave | 0.63mi | 3/1.0 | 1,040 (-8%) | 2mo | $68,000 | $65 | 56 |
| 4300 Mussett Rd | 0.69mi | 3/1.0 | 980 (-13%) | 8mo | $72,000 | $73 | 39 |
| 3224 Emrich St | 0.72mi | 2/1.0 (-1) | 972 (-14%) | 8mo | $56,000 | $58 | 32 |
Match score weights: distance 35% · size 25% · config 20% · recency 20%. Top-matched comps best support the ARV.
Projected returns pro-forma
-3.0% appreciation · 3.0% rent growth · sell at horizon
- IRR
- 50.0%
- Equity multiple
- 3.19×
- Total profit
- $24,496
- Equity at exit
- $5,964
- IRR
- 55.5%
- Equity multiple
- 6.47×
- Total profit
- $61,260
- Equity at exit
- $3,458
Cash invested: $11,200 (down + closing). Projections, not guarantees.
Landlord ↔ Tenant lean methodology
- Overall (STATE)
- 92 Strongly Landlord-Friendly
- State Arkansas
- 92 Strongly Landlord-Friendly · R+14
- County
- — inherits STATE
- City
- — inherits STATE
ZIP-level market 72904
- Active inventory
- 98
- Price-to-rent
- 3.5×
Monthly cashflow live
- Estimated rent
- $965 high interval (Pro) →
- Mortgage (P&I)
- −$210
- Tax est. 1.5%
- −$50 /mo · $600/yr
- Insurance
- −$17
- HOA
- −$0
- Vacancy / Maint / Mgmt
- −$203
- Net cashflow
- $486
Break-even live
Sensitivity live
| Price | -10% $514 | -5% $500 | +0% $486 | +5% $472 | +10% $459 |
|---|---|---|---|---|---|
| Rent | -10% $410 | -5% $448 | +0% $486 | +5% $524 | +10% $562 |
| Rate | -1.0pp $506 | -0.5pp $496 | base $486 | +0.5pp $476 | +1.0pp $465 |
UW: 25.0% down · 7.5% · 30yr · 1.5% tax · 5.0% vac · 8.0% maint · 8.0% mgmt
Financing live
Cash to close
- Down payment
- $10,000
- Closing costs
- $1,200
- Reserves months
- —
- Total cash needed
- —
Loan-product check · same deal, 3 products live
Conventional
25% down · 7.5% · 30yr
- Down + closing
- —
- Monthly P&I
- —
- Monthly cashflow
- —
- DSCR
- —
- Eligible?
- —
Personal DTI + credit; lowest rate.
DSCR
20% down · 8.5% · 30yr
- Down + closing
- —
- Monthly P&I
- —
- Monthly cashflow
- —
- DSCR
- —
- Eligible?
- —
No personal income docs; deal must DSCR.
Hard money
10% down · 12.0% · 12mo
- Down + closing
- —
- Monthly P&I
- —
- Monthly cashflow
- —
- DSCR
- —
- Eligible?
- —
Short-term bridge; refi at stabilization.
Rent comps 5 comps
| Address | Beds | Baths | Sqft | Rent | $/sqft | DOM | Units | Dist |
|---|---|---|---|---|---|---|---|---|
| 5201 Spradling Ave Fort Smith, AR | 2.0 | 1.0 | 820 | $780 | $0.95 | 5d | 4 | 0.56mi |
| 4114 N 54th St Unit A Fort Smith, AR | 2.0 | 1.5 | 1050 | $950 | $0.90 | 22d | 1 | 0.73mi |
| 4300 Wynnewood Dr Unit 2 Fort Smith, AR | 2.0 | 2.0 | 1200 | $1,100 | $0.92 | 22d | 1 | 1.00mi |
| 4101 Walnut Park Dr Unit 4109 WP Fort Smith, AR | 3.0 | 2.0 | 1272 | $825 | $0.65 | 22d | 1 | 1.09mi |
| 2409 N 30th St Unit 1 Fort Smith, AR | 2.0 | 2.5 | 1258 | $950 | $0.76 | 22d | 1 | 1.20mi |
Listing history 2 events
-
2026-05-15status Pending
-
2026-05-11$40,000 Active
ⓘ Source: listings_history table (triggers on properties + properties_extension) + one-shot
backfill from property_details.listing_events for pre-trigger history.
Climate risk First Street
- Flood 1/10 Low FEMA zone X (unshaded) · 0% chance over 30 yrs
- Wildfire 3/10 Moderate
- Heat 7/10 Severe 7 d/yr ≥111°F today · 20 d/yr by 30 yrs out
- Wind 2/10 Low 3% chance of damaging wind over 30 yrs
- Air quality 2/10 Low 0 unhealthy d/yr today · 1 by 30 yrs out
Nearby sold comps map
Loading sold comps map…
Walkable amenities ~0.75 mi
Loading nearby amenities…
Taxation est. · year 1
- Rental income
- $11,583
- − Mortgage interest
- −$2,241
- − Property taxes
- −$600
- − Insurance
- −$200
- − Repairs & maintenance
- −$927
- − Management
- −$927
- − Depreciation
- −$1,164
- Taxable income
- $5,526
- Est. tax owed @ 24.0%
- −$1,326
- After-tax cash flow
- $4,508/yr
For passive investors: Depreciation is non-cash, so a rental often shows a tax loss while cash-flowing — sheltering income. Rental losses are passive: they offset passive income freely, and up to $25,000/yr can offset ordinary (W-2) income if you actively participate and your MAGI is under $100k (phasing out to $0 by $150k); unused losses carry forward. On sale, claimed depreciation is recaptured at up to 25%, and gains may owe capital-gains tax (a 1031 exchange can defer both). Figures are a year-1 estimate at your 24.0% rate — not tax advice; consult a CPA.
Schools (NCES district)
- District
- Fort Smith School District
- NCES district ID
- 0506330
- Math proficiency
- 35% ▼ -11.00%
- Reading proficiency
- 39% ▼ -7.00%
- Median HH income
- $36,066
- Composite
- 30.66/100
- National rank
- #6183
- State rank
- #106 of 238 in AR
Livability — Fort Smith
- Score
- 65/100
- State rank
- #151
- US rank
- #13185
Category grades
Schools grade is shown separately in the Schools card above.
Census & demographics
- Census place
- Fort Smith, AR
- County
- Sebastian County · 99,312 people
- City population
- 94,356
- Metro
- Fort Smith, AR-OK
- Population (ZIP)
- 21,296
- Household income
- $41,909
- Rent vs Own
- Severe rent burden
- 851.0
Population outlook (Sebastian County) Hauer SSP2
- Today (2025)
- 133,992 people
- By 2030
- 136,620 · +2.0%
- By 2040
- 140,832 · +5.1%
- By 2050
- 143,301 · +6.9%
- By 2075
- 147,964 · +10.4%
- By 2100
- 145,848 · +8.8%
Race, ethnicity, and origin ACS 2023
- Neighborhood character
- Diverse neighborhood (Simpson 0.69)
- Race & ethnicity
- Hispanic / Latino 44% White 31% Two or more races 11% Black 9% Asian 9% Native American 1%
- Hispanic origin (detail)
- Mexican 30%
- Common ancestry
- Iranian 0%
- Foreign-born
- 26% · Canada, Vietnam
- Languages at home
- 53% English-only · Spanish 37% Other Asian/Pacific 7% Vietnamese 3%
Political lean MEDSL · Sebastian
- 2024 margin
- Solid R (+37.5) · D 30.0% · R 67.6% · Other 2.4%
- 2008→2024 swing
- -2.9pp toward R · 2008: -34.6pp · 2024: -37.5pp
- All cycles
- 2024: R+37.5 2020: R+35.5 2016: R+38.1 2012: R+37.1 2008: R+34.6
Not yet ingested
- Civics
- —
Market trends
- HPI YoY
- ▼ -81.65%
- Current HPI
- 146.2281
- Rent YoY
- —
- Metro
- Fort Smith, AR-OK
- State GDP YoY
- ▲ 3.80%
- F500 in state
- 10
Industry mix (Fortune 500 HQ in AR)
| Industry | F500 HQs | Revenue |
|---|---|---|
| Retail | 1 | $681B |
|
||
| Food / Agriculture | 1 | $53B |
|
||
| Retail / Energy | 1 | $22B |
|
||
| Transportation / Logistics | 1 | $12B |
|
||
| Energy | 1 | $4B |
|
||
Price history
2 events — show timeline
- 2026-05-15 Pending — WRVBOR
- 2026-05-11 Listed $40,000 WRVBOR
Property tax history
-17.3%/yrLatest (2025): $53 · -58.8% YoY. Source: county tax records.
Cash-flow waterfall
monthlySold comps — $/sqft
last 12 mo · ≤1 miLoading sold comps…