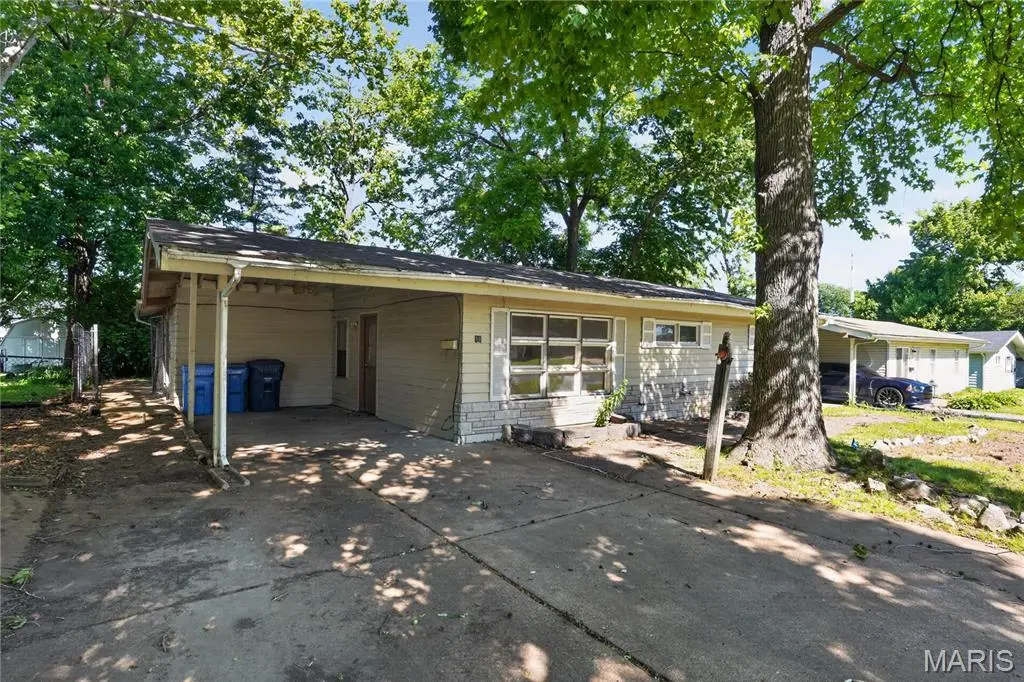
16 Brightwell Ct · Florissant, MO
Flood risk 1/10 · Minimal
- FEMA flood zone
- X (unshaded)
- Chance of flooding over 30 yrs
- 0.0%
- Est. flood insurance / yr
- $507 – $1,088
Fire risk 1/10 · Minimal
- Est. fire insurance / yr
- $1,054 – $1,958
Heat risk 5/10 · Moderate
- Hot days now (above 105°F)
- 7 days/yr
- Hot days in 30 yrs
- 21 days/yr
Wind risk 2/10 · Minimal
- Chance of severe wind over 30 yrs
- 1.0%
Air-quality risk 3/10 · Minor
- Unhealthy air days now
- 3 days/yr
- Unhealthy air days in 30 yrs
- 5 days/yr
Risk factors via First Street. Map © Google.
Why this score? — see what drove the C+ grade
The composite is a weighted blend of 9 inputs, each scored 0–100. Each bar is that input's sub-score; the figure is the points it added to the 100-point composite (weight × sub-score).
- Cash flow +26.7/30.0
- ARV discount +10.6/15.0
- DSCR +9.2/10.0
- 1% rule +6.7/10.0
- Livability +3.7/5.0
- Rent growth +3.6/5.0
- Condition / age +2.5/5.0
- Schools +1.2/10.0
- Appreciation +0.0/10.0
$139,900
🖨 Deal sheet (PDF) 📄 Offer letter ✓ Due diligence
Listing remarks
Welcome to 16 Brightwell Court, a charming home tucked away on a quiet cul-de-sac in the heart of Florissant. This property offers comfortable living with a spacious layout, generous yard space, and a convenient location close to shopping, dining, parks, and major highways. Situated within the desirable Ferguson-Florissant School District, the home provides easy access to everyday amenities while maintaining a peaceful neighborhood setting. Enjoy suburban living with quick access to nearby community attractions and all that the greater St. Louis area has to offer.
Key facts
- Convenient location
- Generous yard space
- 7,501 sq ft lot
Tags
Property features AI
Finance
- Financial info: Lease not considered; No second mortgage recorded
Exterior
- Parking: Carport (1 space)
- Utilities: Public water; Public sewer; Electric service (other)
- Home design: Single-family house; One story; Entry level on main floor
- Construction: Frame construction; Composition roof; Slab foundation; Built according to public records
- Exterior features: Level lot; Paved road access; Lot dimensions approximately 60 x 125
Interior
- Kitchen: Other (unspecified) appliances
- Bedrooms: Three bedrooms on the main level
- Bathrooms: One full bathroom on the main level
- Heating & cooling: Other heating; Central electric air conditioning
- Interior features: Fireplace in the family room; Other appliances
- Laundry & utility: No basement
Neighborhood map
What this means for you Summary
Snapshot
- This is a 3-bed/1.0-bath single-family listed at $140k.
Deal economics
- At list price, monthly cash flow is $380 ($5k/yr) — positive.
- The deal already cash-flows at list — no discount required.
- Meets the 1% rule at list price ($2k rent vs $140k).
- Recommended offer: $136k (3.0% below list) — sets the bar for market timing.
- Cap rate 9.5% vs local median 6.3% in Florissant — top-decile yield for the area; either an underpriced asset or a hidden risk that comps aren't pricing in. Stress-test before assuming the spread holds.
Location & tenants
- Location reads 73/100 on livability (#82 in MO) — a middle-class / working-renter tenant base. Strengths: cost of living A+, housing A+, health & safety B+; Watch: crime C-, amenities D+, commute F.
- Ferguson-Florissant R-II (suburban): math 7% / reading 20% proficiency, ranked #311 of 324 in MO (top 96%) — low school quality limits family demand, transient renter base, plan for 1-2y turnover; 70% free/reduced lunch — lower-income household profile, screen leases tightly.
- Zoned schools: Combs Elementary (math 7% / reading 17%, grade F, #1,016 of 1,115 statewide, top 92%, 295 students, 99% FRL); Mccluer North High (math 5% / reading 28%, grade F, #487 of 521 statewide, top 93%, 1,136 students, 100% FRL) — zoned schools average 99% FRL vs 70% district-wide (30 pts higher); higher-poverty schools than district average — tighter screening recommended.
- Market conditions: Rents rising fast (+4.3%/yr); 272 active listings in the ZIP; 38 comparable units currently listed for rent nearby; rentals at typical pace (median 21d on market — plan ~3-4 weeks tenant-placement turnaround); 920 units permitted in St. Louis County in 2024 (250 in 5+ unit buildings).
Forward outlook
- Local home prices are declining (-3.0%/yr); year-one equity from $967 of loan paydown is wiped out by about $4k of value loss. Plan a longer hold.
- At projected returns (-3.0% appreciation + 4.3% rent growth), your $39k cash investment doubles in ~9 years — after that, you're playing with house money.
Negotiation context
- It's been on market 37 days — a 3% lower offer ($136k) is reasonable based on typical stale-listing flexibility.
- Current owner paid $95k; 47% above their basis — modest negotiation headroom, anchor on the comps not their cost.
Risks & watch-outs
- Watch-outs: built in 1955 — expect roof / HVAC / electrical / plumbing capex.
- Climate carrying-cost: extreme-heat days projected 7→21/yr by 2055 (HVAC capex compounding) — expect insurance premiums to compound above CPI over the hold.
Questions for the listing agent
- It's been on market 37 days. Have you received any prior offers? Is the seller open to a 3% concession, seller financing, or rate buy-down credit?
- Built in 1955 — when were the roof, HVAC, electrical panel, plumbing, and water heater last replaced?
- Is there a deadline driving the sale (1031 exchange, divorce, estate, relocation)? That informs how much negotiation room exists.
- Schools are D-rated, which usually means shorter tenancies and higher turnover. Who's the typical renter profile here, and what's been the actual vacancy rate?
- What's the average days-on-market for RENTAL listings here right now (not sales)? A rising rental-DOM trend means longer vacancies and softer asking-rent achievability than the comps imply.
- What's the recent tenant-quality profile in this submarket — average credit score on applications, eviction rate, late-payment / NSF rate, and stable-employment percentage? A property-management company in the area should have these aggregated.
- How much new for-sale + rental construction is in the pipeline within 1–3 miles? Heavy new supply typically softens prices + rents 12–24 months out; constrained supply supports both.
Investment metrics
- 1% rule
- 1.17% ✓
- Cap rate
- 9.55%
- Cash-on-cash
- 11.63%
- DSCR
- 1.52
- GRM
- 7.1
CMA / ARV
- ARV (median comp)
- $150,177
- List price
- $139,900
- Delta
- -6.84%
- Verdict
- FAIR
- Comps
- 20 within 1.0 mi
Show comp detail 12 sales within ~0.75 mi
| Address | Dist | Beds/Ba | Sqft | Sold | Price | $/sf | Match |
|---|---|---|---|---|---|---|---|
| 1320 Pepperhill Dr | 0.26mi | 3/2.0 | 1,247 (-3%) | 1mo | $200,000 | $160 | 78 |
| 1980 Parker Rd | 0.36mi | 3/1.5 | 1,196 (-7%) | 1mo | $182,157 | $152 | 69 |
| 1585 Pepperhill Dr | 0.34mi | 3/2.0 | 1,204 (-6%) | 2mo | $225,000 | $187 | 67 |
| 1385 Spring Valley Dr | 0.39mi | 3/2.0 | 1,376 (+7%) | 1mo | $214,900 | $156 | 66 |
| 1280 Old York Dr | 0.22mi | 4/2.5 (+1) | 1,386 (+8%) | 1mo | $235,000 | $170 | 65 |
| 1370 Willowbrook | 0.29mi | 3/2.0 | 1,460 (+13%) | 1mo | $225,000 | $154 | 60 |
| 1475 Nashua Dr | 0.51mi | 3/1.5 | 1,160 (-10%) | 1mo | $169,900 | $146 | 57 |
| 2340 Johnstown Dr | 0.69mi | 3/2.0 | 1,344 (+4%) | 2mo | $119,000 | $89 | 55 |
| 1345 Hialeah Pl | 0.59mi | 4/2.5 (+1) | 1,344 (+4%) | 1mo | $215,000 | $160 | 53 |
| 1480 Burning Tree Dr | 0.46mi | 3/2.0 | 1,140 (-12%) | 2mo | $200,000 | $175 | 53 |
| 1730 Kay Dr | 0.49mi | 3/1.0 | 1,467 (+14%) | 3mo | $150,000 | $102 | 51 |
| 435 Lemondale Ln | 0.72mi | 3/2.0 | 1,212 (-6%) | 2mo | $193,900 | $160 | 51 |
Match score weights: distance 35% · size 25% · config 20% · recency 20%. Top-matched comps best support the ARV.
Projected returns pro-forma
-3.0% appreciation · 4.27% rent growth · sell at horizon
- IRR
- 2.4%
- Equity multiple
- 1.09×
- Total profit
- $3,620
- Equity at exit
- $20,860
- IRR
- 13.1%
- Equity multiple
- 2.10×
- Total profit
- $43,189
- Equity at exit
- $12,096
Cash invested: $39,172 (down + closing). Projections, not guarantees.
Landlord ↔ Tenant lean methodology
- Overall (STATE)
- 81 Strongly Landlord-Friendly
- State Missouri
- 81 Strongly Landlord-Friendly · R+10
- County
- — inherits STATE
- City
- — inherits STATE
ZIP-level market 63031
- Rents YoY
- 4.3%
- Active inventory
- 272
- Price-to-rent
- 7.1×
Monthly cashflow live
- Estimated rent
- $1,640 high interval (Pro) →
- Mortgage (P&I)
- −$734
- Tax from tax record
- −$124 /mo · $1,485/yr
- Insurance
- −$58
- HOA
- −$0
- Vacancy / Maint / Mgmt
- −$344
- Net cashflow
- $380
Break-even live
Sensitivity live
| Price | -10% $459 | -5% $419 | +0% $380 | +5% $340 | +10% $300 |
|---|---|---|---|---|---|
| Rent | -10% $250 | -5% $315 | +0% $380 | +5% $444 | +10% $509 |
| Rate | -1.0pp $450 | -0.5pp $415 | base $380 | +0.5pp $343 | +1.0pp $306 |
UW: 25.0% down · 7.5% · 30yr · 1.5% tax · 5.0% vac · 8.0% maint · 8.0% mgmt
Financing live
Cash to close
- Down payment
- $34,975
- Closing costs
- $4,197
- Reserves months
- —
- Total cash needed
- —
Loan-product check · same deal, 3 products live
Conventional
25% down · 7.5% · 30yr
- Down + closing
- —
- Monthly P&I
- —
- Monthly cashflow
- —
- DSCR
- —
- Eligible?
- —
Personal DTI + credit; lowest rate.
DSCR
20% down · 8.5% · 30yr
- Down + closing
- —
- Monthly P&I
- —
- Monthly cashflow
- —
- DSCR
- —
- Eligible?
- —
No personal income docs; deal must DSCR.
Hard money
10% down · 12.0% · 12mo
- Down + closing
- —
- Monthly P&I
- —
- Monthly cashflow
- —
- DSCR
- —
- Eligible?
- —
Short-term bridge; refi at stabilization.
Rent comps 38 comps
| Address | Beds | Baths | Sqft | Rent | $/sqft | DOM | Units | Dist |
|---|---|---|---|---|---|---|---|---|
| 9 Saint Celeste Dr Florissant, MO | 3.0 | 1.0 | 992 | $1,450 | $1.46 | 44d | 1 | 0.24mi |
| 3 Champlain Ct Florissant, MO | 3.0 | 1.0 | 1100 | $1,600 | $1.45 | 44d | 1 | 0.28mi |
| 1710 Kay Dr Florissant, MO | 3.0 | 1.0 | 960 | $1,500 | $1.56 | 3d | 1 | 0.45mi |
| 1740 Deborah Dr Florissant, MO | 3.0 | 2.5 | 1650 | $1,750 | $1.06 | 18d | 1 | 0.52mi |
| 1280 Saint Catherine St Florissant, MO | 3.0 | 1.0 | 1274 | $1,600 | $1.26 | 15d | 1 | 0.64mi |
| 1725 Saint Catherine St Florissant, MO | 3.0 | 1.0 | 1107 | $1,800 | $1.63 | 15d | 1 | 0.68mi |
| 945 Paddock Dr Florissant, MO | 4.0 | 2.0 | 1875 | $1,850 | $0.99 | 5d | 1 | 0.70mi |
| 20 Saint Benedict Ln Florissant, MO | 3.0 | 1.5 | 1092 | $1,525 | $1.40 | 21d | 1 | 0.76mi |
| 470 Hundley Dr Florissant, MO | 3.0 | 2.0 | 962 | $1,595 | $1.66 | 44d | 1 | 0.78mi |
| 560 Jamaica Pl Florissant, MO | 3.0 | 2.0 | 1350 | $1,653 | $1.22 | 44d | 1 | 0.81mi |
| 1785 Trotter Way Florissant, MO | 3.0 | 2.0 | 1297 | $1,806 | $1.39 | 8d | 1 | 0.86mi |
| 4 Sharon Ct Florissant, MO | 3.0 | 2.0 | 1108 | $1,800 | $1.62 | 3d | 1 | 0.88mi |
| 1545 Washington St Florissant, MO | 3.0 | 1.5 | 1337 | $2,055 | $1.54 | 4d | 1 | 0.89mi |
| 410 Ridge Dr Florissant, MO | 3.0 | 2.0 | 1226 | $1,650 | $1.35 | 18d | 1 | 0.93mi |
| 330 Moule Dr Florissant, MO | 3.0 | 1.0 | 1014 | $1,575 | $1.55 | 44d | 1 | 0.94mi |
| 1600 Horseshoe Dr Florissant, MO | 3.0 | 2.0 | 1314 | $1,550 | $1.18 | 44d | 1 | 0.96mi |
| 1600 Washington St Florissant, MO | 3.0 | 1.5 | 1095 | $1,250 | $1.14 | 21d | 1 | 0.97mi |
| 116 Graham Rd Florissant, MO | 3.0 | 2.0 | 1578 | $1,495 | $0.95 | 3d | 1 | 0.97mi |
| 1983 Greenheath Dr Florissant, MO | 3.0 | 2.0 | 1040 | $1,331 | $1.28 | 4d | 1 | 1.00mi |
| 297 Saint Eugene Ln Florissant, MO | 2.0 | 1.0 | 1100 | $1,100 | $1.00 | 44d | 1 | 1.06mi |
| 765 Babler Dr Florissant, MO | 3.0 | 2.0 | 888 | $1,700 | $1.91 | 8d | 1 | 1.07mi |
| 765 Bobbins Ln Florissant, MO | 3.0 | 1.0 | 1107 | $1,450 | $1.31 | 44d | 1 | 1.11mi |
| 855 Daniel Boone Dr Florissant, MO | 3.0 | 1.0 | 964 | $1,400 | $1.45 | 44d | 1 | 1.13mi |
| 100 Taney Dr Florissant, MO | 3.0 | 1.0 | 1148 | $1,495 | $1.30 | 23d | 1 | 1.15mi |
| 13 Bruce Dr Unit Bruce 13-2 Florissant, MO | 2.0 | 1.0 | 880 | $975 | $1.11 | 44d | 1 | 1.17mi |
| 13 Bruce Dr Florissant, MO | 2.0 | 1.0 | 880 | $975 | $1.11 | 24d | 1 | 1.17mi |
| 2990 Santiago Dr Florissant, MO | 2.0 | 2.0 | 984 | $1,200 | $1.22 | 44d | 1 | 1.17mi |
| 14 Bruce Dr Unit Bruce 14-4 Florissant, MO | 2.0 | 1.0 | 880 | $975 | $1.11 | 44d | 1 | 1.18mi |
| 790 Pebble Ln Florissant, MO | 3.0 | 2.0 | 1242 | $1,795 | $1.45 | 24d | 1 | 1.20mi |
| 805 Robinwood Dr Florissant, MO | 3.0 | 1.5 | 1729 | $1,571 | $0.91 | 21d | 1 | 1.23mi |
| 13 Cricket Ct Florissant, MO | 4.0 | 3.0 | 1560 | $2,550 | $1.63 | 44d | 1 | 1.32mi |
| 9 Charlotte Dr Florissant, MO | 3.0 | 1.5 | 1404 | $1,641 | $1.17 | 5d | 1 | 1.35mi |
| 1145 Swallow Ln Florissant, MO | 3.0 | 2.0 | 1288 | $1,645 | $1.28 | 4d | 1 | 1.35mi |
| 17 Valley Dr Florissant, MO | 2.0 | 2.0 | 1356 | $1,525 | $1.12 | 44d | 1 | 1.37mi |
| 1180 S New Florissant Rd Florissant, MO | 3.0 | 1.0 | 925 | $1,225 | $1.32 | 24d | 1 | 1.38mi |
| 1095 Humes Ln Florissant, MO | 3.0 | 1.5 | 1100 | $1,650 | $1.50 | 5d | 1 | 1.40mi |
| 1250 S New Florissant Rd Florissant, MO | 2.0 | 1.0 | 1150 | $1,500 | $1.30 | 15d | 1 | 1.44mi |
| 3 Cantabrian Ct Florissant, MO | 3.0 | 2.0 | 1436 | $1,881 | $1.31 | 15d | 1 | 1.47mi |
Listing history 21 events
-
2026-06-21days on market $139,900 Active 37 DOM
-
2026-06-18days on market $139,900 Active 34 DOM
-
2026-06-17days on market $139,900 Active 33 DOM
-
2026-06-16days on market $139,900 Active 32 DOM
-
2026-06-15days on market $139,900 Active 31 DOM
-
2026-06-13days on market $139,900 Active 29 DOM
-
2026-06-13days on market $139,900 Active 28 DOM
-
2026-06-09days on market $139,900 Active 25 DOM
-
2026-06-08days on market $139,900 Active 24 DOM
-
2026-06-07days on market $139,900 Active 23 DOM
-
2026-06-05days on market $139,900 Active 20 DOM
-
2026-06-03days on market $139,900 Active 19 DOM
-
2026-06-02days on market $139,900 Active 18 DOM
-
2026-06-01days on market $139,900 Active 17 DOM
-
2026-05-31days on market $139,900 Active 16 DOM
-
2026-05-15$139,900 Active 570-char remark
-
2021-04-14soldstatus $95,000
-
2006-12-29soldstatus $64,000
-
2004-05-24soldstatus $56,000
-
1997-10-23soldstatus
-
1990-07-01soldstatus $57,500
ⓘ Source: listings_history table (triggers on properties + properties_extension) + one-shot
backfill from property_details.listing_events for pre-trigger history.
Tax reassessment forecast MO · Resets to sale price
- Current annual tax
- $1,485 · $124/mo
- Projected year-2 tax
- $1,485 · $124/mo
- Expected delta
- $0/yr ($0/mo · 0.0%)
ⓘ Screening estimate from a state-policy table — verify with the county assessor before closing.
Climate risk First Street
- Flood 1/10 Low FEMA zone X (unshaded) · 0% chance over 30 yrs
- Wildfire 1/10 Low
- Heat 5/10 Major 7 d/yr ≥105°F today · 21 d/yr by 30 yrs out
- Wind 2/10 Low 100% chance of damaging wind over 30 yrs
- Air quality 3/10 Moderate 3 unhealthy d/yr today · 5 by 30 yrs out
Nearby sold comps map
Loading sold comps map…
Walkable amenities ~0.75 mi
Loading nearby amenities…
Taxation est. · year 1
- Rental income
- $19,675
- − Mortgage interest
- −$7,837
- − Property taxes
- −$1,485
- − Insurance
- −$700
- − Repairs & maintenance
- −$1,574
- − Management
- −$1,574
- − Depreciation
- −$4,070
- Taxable income
- $2,436
- Est. tax owed @ 24.0%
- −$585
- After-tax cash flow
- $3,970/yr
For passive investors: Depreciation is non-cash, so a rental often shows a tax loss while cash-flowing — sheltering income. Rental losses are passive: they offset passive income freely, and up to $25,000/yr can offset ordinary (W-2) income if you actively participate and your MAGI is under $100k (phasing out to $0 by $150k); unused losses carry forward. On sale, claimed depreciation is recaptured at up to 25%, and gains may owe capital-gains tax (a 1031 exchange can defer both). Figures are a year-1 estimate at your 24.0% rate — not tax advice; consult a CPA.
Schools (NCES district)
- District
- Ferguson-Florissant R-II
- NCES district ID
- 2912010
- Math proficiency
- 7% ▼ -9.00%
- Reading proficiency
- 20% ▼ -6.00%
- Median HH income
- $44,610
- Composite
- 11.96/100
- National rank
- #9666
- State rank
- #311 of 324 in MO
Livability — Florissant
- Score
- 73/100
- State rank
- #82
- US rank
- #5406
Category grades
Schools grade is shown separately in the Schools card above.
Census & demographics
- Census place
- Florissant, MO
- County
- Saint Louis County · 888,823 people
- City population
- 69,104
- Metro
- St. Louis, MO-IL
- Population (ZIP)
- 50,196
- Household income
- $70,811
- Rent vs Own
- Severe rent burden
- 1279.0
Population outlook (St. Louis County) Hauer SSP2
- Today (2025)
- 1,025,227 people
- By 2030
- 1,028,023 · +0.3%
- By 2040
- 1,020,940 · -0.4%
- By 2050
- 1,007,280 · -1.8%
- By 2075
- 987,277 · -3.7%
- By 2100
- 921,984 · -10.1%
Race, ethnicity, and origin ACS 2023
- Neighborhood character
- Diverse neighborhood (Simpson 0.58)
- Race & ethnicity
- White 49% Black 41% Two or more races 7% Hispanic / Latino 2%
- Common ancestry
- Romanian 3% Lithuanian 3% Swedish 1%
- Foreign-born
- 5% · Canada, Jamaica
- Languages at home
- 94% English-only · Spanish 2% Arabic 1%
Political lean MEDSL · St. Louis
- 2024 margin
- Strong D (+23.4) · D 60.8% · R 37.4% · Other 1.7%
- 2008→2024 swing
- +3.5pp toward D · 2008: 19.9pp · 2024: 23.4pp
- All cycles
- 2024: D+23.4 2020: D+24.0 2016: D+16.2 2012: D+13.7 2008: D+19.9
Not yet ingested
- Civics
- —
Market trends
- HPI YoY
- ▼ -223.57%
- Current HPI
- 202.7192
- Rent YoY
- ▲ 4.27%
- Metro
- St. Louis, MO-IL
- State GDP YoY
- ▲ 1.84%
- F500 in state
- 20
Industry mix (Fortune 500 HQ in MO)
| Industry | F500 HQs | Revenue |
|---|---|---|
| Healthcare | 1 | $163B |
|
||
| Insurance | 1 | $21B |
|
||
| Industrial Technology | 1 | $17B |
|
||
| Retail | 1 | $16B |
|
||
| Industrial Distribution | 1 | $10B |
|
||
| Utilities | 1 | $9B |
|
||
Price history
+143.3% since first listed6 events — show timeline
- 2026-05-15 Listed $139,900 MARIS as Distributed by MLS Grid
- 2021-04-14 Sold (Public Records) $95,000 Public Records
- 2006-12-29 Sold (Public Records) $64,000 Public Records
- 2004-05-24 Sold (Public Records) $56,000 Public Records
- 1997-10-23 Sold (Public Records) — Public Records
- 1990-07-01 Sold (Public Records) $57,500 Public Records
Property tax history
+0.3%/yrLatest (2022): $1,485 · +1.7% YoY. Source: county tax records.
Cash-flow waterfall
monthlySold comps — $/sqft
last 12 mo · ≤1 miLoading sold comps…