22324 Cuttler Rd · Woodbranch, TX
Flood risk 1/10 · Minimal
- FEMA flood zone
- X (unshaded)
- Chance of flooding over 30 yrs
- 0.0%
- Est. flood insurance / yr
- $507 – $1,088
Fire risk 3/10 · Minor
- Est. fire insurance / yr
- $1,222 – $2,270
Heat risk 8/10 · Major
- Hot days now (above 110°F)
- 7 days/yr
- Hot days in 30 yrs
- 24 days/yr
Wind risk 8/10 · Major
- Chance of severe wind over 30 yrs
- 99.0%
Air-quality risk 3/10 · Minor
- Unhealthy air days now
- 2 days/yr
- Unhealthy air days in 30 yrs
- 3 days/yr
Risk factors via First Street. Map © Google.
Why this score? — see what drove the B- grade
The composite is a weighted blend of 9 inputs, each scored 0–100. Each bar is that input's sub-score; the figure is the points it added to the 100-point composite (weight × sub-score).
- Cash flow +25.9/30.0
- ARV discount +13.7/15.0
- DSCR +8.7/10.0
- 1% rule +6.8/10.0
- Livability +3.3/5.0
- Schools +2.8/10.0
- Rent growth +2.6/5.0
- Condition / age +2.5/5.0
- Appreciation +0.0/10.0
$125,000
🖨 Deal sheet 📄 Offer letter ✓ Due diligence
Listing remarks MLS
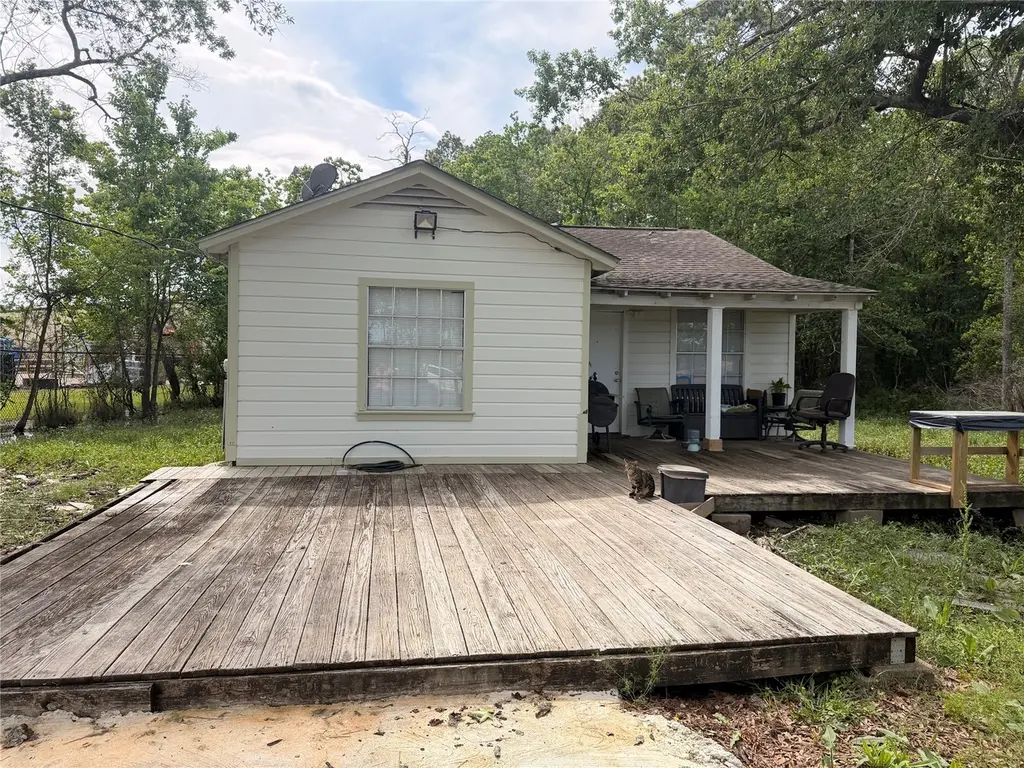
Don’t let the size fool you—this 2-bedroom, 1-bath home packs serious potential into 784 square feet of efficient living. Sitting on a massive 15,246 sq ft corner lot, this property is all about opportunity. With quick highway access, you’re minutes from everything that matters—making it ideal for commuters, first-time buyers, or investors looking for their next win. Whether you’re ready to move in, renovate, or expand, this home is your blank canvas to build equity and create something special. Opportunities like this don’t last—schedule your showing and see the potential for yourself before it’s gone.
Key facts
- Quick highway access
- Corner lot
- 0.35 acre lot
Tags
Neighborhood map
What this means for you Summary
Snapshot
- This is a 2-bed/1.0-bath single-family listed at $125k.
Deal economics
- At list price, monthly cash flow is $307 ($4k/yr) — positive.
- The deal already cash-flows at list — no discount required.
- Meets the 1% rule at list price ($1k rent vs $125k).
- Recommended offer: $121k (3.0% below list) — sets the bar for market timing.
- Cap rate 9.2% vs local median 4.4% in Woodbranch — top-decile yield for the area; either an underpriced asset or a hidden risk that comps aren't pricing in. Stress-test before assuming the spread holds.
Location & tenants
- Location reads 66/100 on livability (#646 in TX) — a middle-class / working-renter tenant base. Strengths: crime A+, cost of living A+, housing A+; Watch: schools F, amenities F, commute F.
- New Caney ISD (suburban): math 31% / reading 32% proficiency, ranked #570 of 826 in TX (top 69%) — families likely to look elsewhere, expect single-tenant / working-renter base with shorter leases.
- Market conditions: Rents flat; 979 active listings in the ZIP; 13 comparable units currently listed for rent nearby; rentals leasing fast (median 13d on market — plan ~1-2 weeks tenant-placement turnaround); solid renter incomes; 13,259 units permitted in Montgomery County in 2024 (1,402 in 5+ unit buildings).
Forward outlook
- Local home prices are declining (-3.0%/yr); year-one equity from $864 of loan paydown is wiped out by about $4k of value loss. Plan a longer hold.
- Montgomery County population projected at +65% by 2050 — long-run rental-demand tailwind backs the buy-and-hold thesis.
Negotiation context
- It's been on market 57 days — a 3% lower offer ($121k) is reasonable based on typical stale-listing flexibility.
Risks & watch-outs
- Climate carrying-cost: severe wind risk, 99% chance of damaging wind over 30y; extreme-heat days projected 7→24/yr by 2055 (HVAC capex compounding) — expect insurance premiums to compound above CPI over the hold.
Questions for the listing agent
- It's been on market 57 days. Have you received any prior offers? Is the seller open to a 3% concession, seller financing, or rate buy-down credit?
- Built in 1966 — when were the roof, HVAC, electrical panel, plumbing, and water heater last replaced?
- Is there a deadline driving the sale (1031 exchange, divorce, estate, relocation)? That informs how much negotiation room exists.
- Schools are F-rated, which usually means shorter tenancies and higher turnover. Who's the typical renter profile here, and what's been the actual vacancy rate?
- What's the average days-on-market for RENTAL listings here right now (not sales)? A rising rental-DOM trend means longer vacancies and softer asking-rent achievability than the comps imply.
- What's the recent tenant-quality profile in this submarket — average credit score on applications, eviction rate, late-payment / NSF rate, and stable-employment percentage? A property-management company in the area should have these aggregated.
- How much new for-sale + rental construction is in the pipeline within 1–3 miles? Heavy new supply typically softens prices + rents 12–24 months out; constrained supply supports both.
Investment metrics
- 1% rule
- 1.18% ✓
- Cap rate
- 9.24%
- Cash-on-cash
- 10.54%
- DSCR
- 1.47
- GRM
- 7.1
CMA / ARV
- ARV (median comp)
- $144,814
- List price
- $125,000
- Delta
- -13.68%
- Verdict
- UNDERPRICED
- Comps
- 6 within 2.0 mi
Projected returns pro-forma
-3.0% appreciation · 0.21% rent growth · sell at horizon
- IRR
- -3.7%
- Equity multiple
- 0.87×
- Total profit
- $-4,676
- Equity at exit
- $18,638
- IRR
- 2.6%
- Equity multiple
- 1.16×
- Total profit
- $5,616
- Equity at exit
- $10,808
Cash invested: $35,000 (down + closing). Projections, not guarantees.
Landlord ↔ Tenant lean methodology
- Overall (STATE)
- 87 Strongly Landlord-Friendly
- State Texas
- 87 Strongly Landlord-Friendly · R+5
- County
- — inherits STATE
- City
- — inherits STATE
ZIP-level market 77357
- Home prices YoY
- -24.7%
- Rents YoY
- 0.2%
- Active inventory
- 979
- Price-to-rent
- 7.1×
Monthly cashflow live
- Estimated rent
- $1,471 high interval (Pro) →
- Mortgage (P&I)
- −$656
- Tax from tax record
- −$147 /mo · $1,768/yr
- Insurance
- −$52
- HOA
- −$0
- Vacancy / Maint / Mgmt
- −$309
- Net cashflow
- $307
Break-even live
UW: 25.0% down · 7.5% · 30yr · 1.5% tax · 5.0% vac · 8.0% maint · 8.0% mgmt
Financing live
Cash to close
- Down payment
- $31,250
- Closing costs
- $3,750
- Reserves months
- —
- Total cash needed
- —
Loan-product check · same deal, 3 products live
Conventional
25% down · 7.5% · 30yr
- Down + closing
- —
- Monthly P&I
- —
- Monthly cashflow
- —
- DSCR
- —
- Eligible?
- —
Personal DTI + credit; lowest rate.
DSCR
20% down · 8.5% · 30yr
- Down + closing
- —
- Monthly P&I
- —
- Monthly cashflow
- —
- DSCR
- —
- Eligible?
- —
No personal income docs; deal must DSCR.
Hard money
10% down · 12.0% · 12mo
- Down + closing
- —
- Monthly P&I
- —
- Monthly cashflow
- —
- DSCR
- —
- Eligible?
- —
Short-term bridge; refi at stabilization.
Rent comps 13 comps
| Address | Beds | Baths | Sqft | Rent | $/sqft | DOM | Units | Dist |
|---|---|---|---|---|---|---|---|---|
| 22837 E Community Dr Unit 3 New Caney, TX | 1.0 | 1.0 | 640 | $1,600 | $2.50 | 18d | 1 | 0.66mi |
| 22837 E Community Dr Unit 2 New Caney, TX | 2.0 | 1.0 | 640 | $1,800 | $2.81 | 18d | 1 | 0.66mi |
| 21899 Valley Ranch Crossing Dr Unit 21973 Porter, TX | 1.0 | 1.0 | 783 | $1,205 | $1.54 | 11d | 1 | 1.16mi |
| 21899 Valley Ranch Crossing Dr Unit 21914 Porter, TX | 1.0 | 1.0 | 798 | $1,212 | $1.52 | 2d | 1 | 1.16mi |
| 21899 Valley Ranch Crossing Dr Unit 21950 Porter, TX | 1.0 | 1.0 | 783 | $1,205 | $1.54 | 12d | 1 | 1.16mi |
| 21899 Valley Ranch Crossing Dr Unit 21956 Porter, TX | 2.0 | 2.0 | 1053 | $1,420 | $1.35 | 43d | 1 | 1.16mi |
| 21899 Valley Ranch Crossing Dr Unit 21936 Porter, TX | 2.0 | 2.0 | 1053 | $1,387 | $1.32 | 2d | 1 | 1.16mi |
| 21899 Valley Ranch Crossing Dr Unit 21920 Porter, TX | 1.0 | 1.0 | 783 | $1,210 | $1.55 | 12d | 1 | 1.16mi |
| 21899 Valley Ranch Crossing Dr Unit 424 Porter, TX | 2.0 | 2.0 | 1053 | $1,395 | $1.32 | 5d | 1 | 1.16mi |
| 21899 Valley Ranch Crossing Dr Unit 1162 Porter, TX | 1.0 | 1.0 | 798 | $1,215 | $1.52 | 5d | 1 | 1.16mi |
| 21899 Valley Ranch Crossing Dr Porter, TX | 1.0 | 1.0 | 783 | $1,175 | $1.50 | 15d | 1 | 1.17mi |
| 21905 Valley Ranch Crossing Dr Porter, TX | 2.0 | 2.0 | 1053 | $1,270 | $1.21 | 43d | 1 | 1.21mi |
| 22048 Newton Dr New Caney, TX | 3.0 | 2.0 | 924 | $1,650 | $1.79 | 24d | 1 | 1.46mi |
Listing history 15 events
-
2026-06-18days on market $125,000 Active 57 DOM
-
2026-06-17days on market $125,000 Active 56 DOM
-
2026-06-16days on market $125,000 Active 55 DOM
-
2026-06-15statusdays on market $125,000 Active 54 DOM
-
2026-06-13statusdays on market $125,000 Pending 52 DOM
-
2026-06-09days on market $125,000 Active 48 DOM
-
2026-06-08days on market $125,000 Active 47 DOM
-
2026-06-07days on market $125,000 Active 46 DOM
-
2026-06-04days on market $125,000 Active 43 DOM
-
2026-06-03days on market $125,000 Active 42 DOM
-
2026-06-02days on market $125,000 Active 41 DOM
-
2026-06-01days on market $125,000 Active 40 DOM
-
2026-05-31days on market $125,000 Active 39 DOM
-
2026-04-22$125,000 Active 667-char remark
Show marketing remark (667 chars)
Don’t let the size fool you—this 2-bedroom, 1-bath home packs serious potential into 784 square feet of efficient living. Sitting on a massive 15,246 sq ft corner lot, this property is all about opportunity. With quick highway access, you’re minutes from everything that matters—making it ideal for commuters, first-time buyers, or investors looking for their next win. Whether you’re ready to move in, renovate, or expand, this home is your blank canvas to build equity and create something special. Opportunities like this don’t last—schedule your showing and see the potential for yourself before it’s gone.
-
2010-03-09soldstatus
ⓘ Source: listings_history table (triggers on properties + properties_extension) + one-shot
backfill from property_details.listing_events for pre-trigger history.
Tax reassessment forecast TX · Resets to sale price
- Current annual tax
- $1,768 · $147/mo
- Projected year-2 tax
- $2,288 · $191/mo
- Expected delta
- +$520/yr (+$43/mo · 29.4%)
ⓘ Screening estimate from a state-policy table — verify with the county assessor before closing.
Climate risk First Street
- Flood 1/10 Low FEMA zone X (unshaded) · 0% chance over 30 yrs
- Wildfire 3/10 Moderate
- Heat 8/10 Severe 7 d/yr ≥110°F today · 24 d/yr by 30 yrs out
- Wind 8/10 Severe 99% chance of damaging wind over 30 yrs
- Air quality 3/10 Moderate 2 unhealthy d/yr today · 3 by 30 yrs out
Nearby sold comps map
Loading sold comps map…
Walkable amenities ~0.75 mi
Loading nearby amenities…
Taxation est. · year 1
- Rental income
- $17,656
- − Mortgage interest
- −$7,002
- − Property taxes
- −$1,768
- − Insurance
- −$625
- − Repairs & maintenance
- −$1,412
- − Management
- −$1,412
- − Depreciation
- −$3,636
- Taxable income
- $1,800
- Est. tax owed @ 24.0%
- −$432
- After-tax cash flow
- $3,257/yr
For passive investors: Depreciation is non-cash, so a rental often shows a tax loss while cash-flowing — sheltering income. Rental losses are passive: they offset passive income freely, and up to $25,000/yr can offset ordinary (W-2) income if you actively participate and your MAGI is under $100k (phasing out to $0 by $150k); unused losses carry forward. On sale, claimed depreciation is recaptured at up to 25%, and gains may owe capital-gains tax (a 1031 exchange can defer both). Figures are a year-1 estimate at your 24.0% rate — not tax advice; consult a CPA.
Schools (NCES district)
- District
- New Caney ISD
- NCES district ID
- 4832400
- Math proficiency
- 31% ▼ -16.00%
- Reading proficiency
- 32% ▼ -6.00%
- Median HH income
- $55,380
- Composite
- 27.97/100
- National rank
- #6857
- State rank
- #570 of 826 in TX
Livability — Woodbranch
- Score
- 66/100
- State rank
- #646
- US rank
- #12243
Category grades
Schools grade is shown separately in the Schools card above.
Census & demographics
- County
- Montgomery County · 663,713 people
- City population
- 3,226,434
- Metro
- Houston-The Woodlands-Sugar Land, TX
- Population (ZIP)
- 37,592
- Household income
- $76,050
- Rent vs Own
- Severe rent burden
- 487.0
Population outlook (Montgomery County) Hauer SSP2
- Today (2025)
- 713,896 people
- By 2030
- 805,263 · +12.8%
- By 2040
- 992,708 · +39.1%
- By 2050
- 1,179,590 · +65.2%
- By 2075
- 1,628,084 · +128.1%
- By 2100
- 1,937,880 · +171.5%
Race, ethnicity, and origin ACS 2023
- Neighborhood character
- Diverse neighborhood (Simpson 0.56)
- Race & ethnicity
- Hispanic / Latino 49% White 45% Two or more races 31% Black 3%
- Hispanic origin (detail)
- Mexican 40%
- Common ancestry
- Lithuanian 2% Romanian 1% Iranian 1%
- Foreign-born
- 23% · Canada, Jamaica
- Languages at home
- 58% English-only · Spanish 40% Other Indo-European 1%
Political lean MEDSL · Montgomery
- 2024 margin
- Solid R (+45.5) · D 26.8% · R 72.3%
- 2008→2024 swing
- +7.2pp toward D · 2008: -52.7pp · 2024: -45.5pp
- All cycles
- 2024: R+45.5 2020: R+43.8 2016: R+51.4 2012: R+60.7 2008: R+52.7
Not yet ingested
- Civics
- —
Market trends
- HPI YoY
- ▼ -87.71%
- Current HPI
- 266.8315
- Rent YoY
- ▲ 0.21%
- Metro
- Houston-The Woodlands-Sugar Land, TX
- State GDP YoY
- ▲ 3.95%
- F500 in state
- 110
Industry mix (Fortune 500 HQ in TX)
| Industry | F500 HQs | Revenue |
|---|---|---|
| Energy | 16 | $1,198B |
|
||
| Technology | 5 | $198B |
|
||
| Engineering / Construction | 4 | $72B |
|
||
| Energy Services | 3 | $60B |
|
||
| Utilities | 3 | $41B |
|
||
| Healthcare | 2 | $330B |
|
||
Price history
2 events — show timeline
- 2026-04-22 Listed $125,000 HARMLS
- 2010-03-09 Sold (Public Records) — Public Records
Property tax history
+10.0%/yrLatest (2025): $1,768 · +10.9% YoY. Source: county tax records.
Cash-flow waterfall
monthlySold comps — $/sqft
last 12 mo · ≤1 miLoading sold comps…