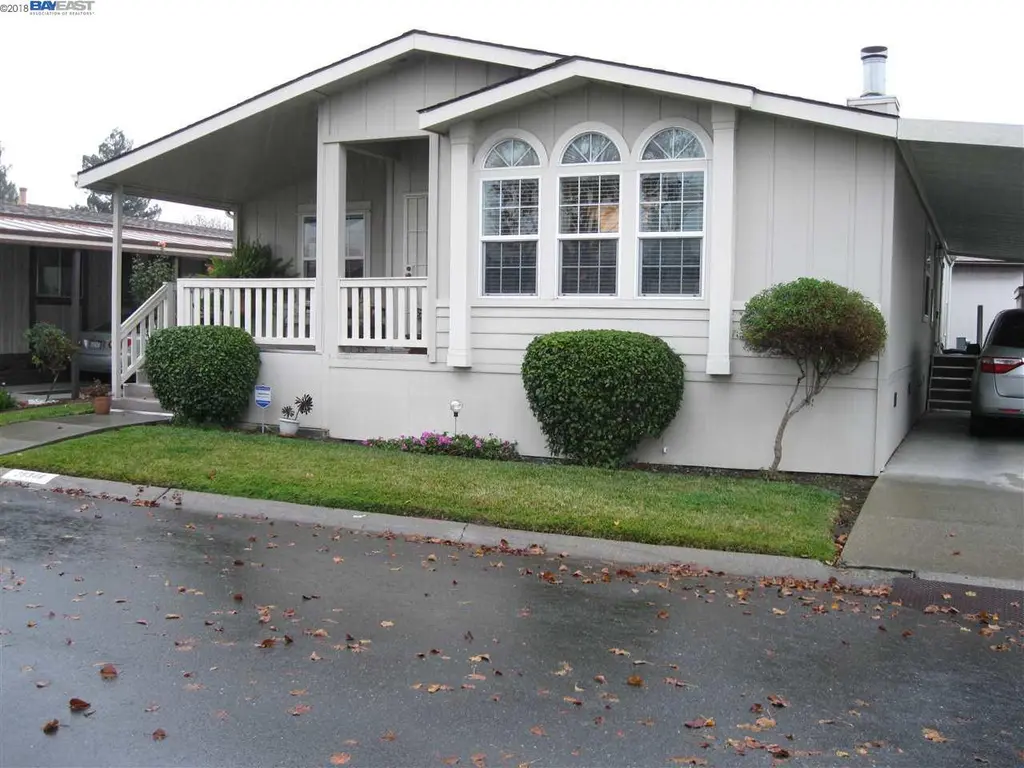
29344 New Hampshire · Hayward, CA
Flood risk 5/10 · Moderate
- FEMA flood zone
- AH
- Chance of flooding over 30 yrs
- 0.27%
- Est. flood insurance / yr
- $1,142 – $2,507
Fire risk 1/10 · Minimal
- Est. fire insurance / yr
- $659 – $1,223
Heat risk 4/10 · Minor
- Hot days now (above 89°F)
- 7 days/yr
- Hot days in 30 yrs
- 14 days/yr
Wind risk 1/10 · Minimal
- Chance of severe wind over 30 yrs
- —
Air-quality risk 7/10 · Major
- Unhealthy air days now
- 12 days/yr
- Unhealthy air days in 30 yrs
- 12 days/yr
Risk factors via First Street. Map © Google.
Why this score? — see what drove the C grade
The composite is a weighted blend of 9 inputs, each scored 0–100. Each bar is that input's sub-score; the figure is the points it added to the 100-point composite (weight × sub-score).
- Cash flow +25.2/30.0
- DSCR +8.3/10.0
- ARV discount +5.9/15.0
- 1% rule +5.2/10.0
- Livability +3.8/5.0
- Rent growth +3.1/5.0
- Schools +3.1/10.0
- Condition / age +2.5/5.0
- Appreciation +0.0/10.0
$375,000
🖨 Deal sheet 📄 Offer letter ✓ Due diligence
Listing remarks MLS
This is it! Most beautiful triple wide in park. 1874 Sq. ft. Large open plan-huge kitchen w/ food prep island. Office off master bedroom, walk-in closet. Fireplace in living room. Immaculate thru-out.
Key facts
- Community pool
- Built 2006
Property features AI
Finance
- Other: Community amenities include pool, spa, clubhouse, game room, greenbelt and park
- HOA & community: Park name: New England Villa; Senior community; Pet-friendly (cats and dogs allowed with limits and approval)
Exterior
- Parking: Carport with awning; Carport for 2 or more vehicles
- Utilities: Public water; Public sewer
- Home design: Manufactured in-park (mobile home); Triple-wide model (Advantage Home)
- Construction: Masonite skirting
- Exterior features: Back yard; Side yard; Automatic sprinklers; Community pool and spa; Clubhouse, game room and park; Guest parking and car wash area
Interior
- Kitchen: Kitchen island; Dishwasher; Disposal; Gas range / cooktop; Free-standing range; Self-cleaning oven; Microwave; Refrigerator; Ice maker hookup; Pantry
- Bedrooms: 3 bedrooms (one primary bedroom suite)
- Flooring: Laminate flooring
- Bathrooms: 2 full bathrooms; Primary bathroom with solid-surface counters, stall shower and double vanity; Other bathroom(s) with solid-surface counters and stall shower
- Heating & cooling: Forced air heating; Central air conditioning
- Interior features: Solid-surface counters; Pantry; Formal dining room; Office; Window coverings; Wood-burning fireplace in the living room; Mirrored closet doors
- Laundry & utility: Laundry room with 220V outlet; Gas water heater
Neighborhood map
What this means for you Summary
Snapshot
- This is a 3-bed/2.0-bath manufactured listed at $375k.
Deal economics
- At list price, monthly cash flow is $684 ($8k/yr) — positive.
- The deal already cash-flows at list — no discount required.
- Meets the 1% rule at list price ($4k rent vs $375k).
- Cap rate 9.0% vs local median 2.1% in Hayward — top-decile yield for the area; either an underpriced asset or a hidden risk that comps aren't pricing in. Stress-test before assuming the spread holds.
Location & tenants
- Location reads 75/100 on livability (#124 in CA, #4,294 nationally) — a middle-class / working-renter tenant base. Strengths: commute A+, employment A+, health & safety A+; Watch: schools D, crime F, cost of living F.
- Hayward Unified (urban): math 25% / reading 37% proficiency, ranked #935 of 1,400 in CA (top 67%) — families likely to look elsewhere, expect single-tenant / working-renter base with shorter leases; 61% free/reduced lunch — lower-income household profile, screen leases tightly.
- Market conditions: Rents rising (+2.6%/yr); 169 active listings in the ZIP; 18 comparable units currently listed for rent nearby; rentals at typical pace (median 15d on market — plan ~3-4 weeks tenant-placement turnaround); solid renter incomes; 1,742 units permitted in Alameda County in 2024 (856 in 5+ unit buildings).
- This rent runs 43% of the median local income ($108k/yr) — at the standard rent-burdened threshold; future hikes will face affordability resistance.
Forward outlook
- Local home prices are declining (-3.0%/yr); year-one equity from $3k of loan paydown is wiped out by about $11k of value loss. Plan a longer hold.
- Alameda County population projected at +34% by 2050 — long-run rental-demand tailwind backs the buy-and-hold thesis.
Negotiation context
- Only 1 days on market — expect competitive offers; lowballing is unlikely to land.
- Current owner paid $310k; 21% above their basis — modest negotiation headroom, anchor on the comps not their cost.
Risks & watch-outs
- Watch-outs: flood insurance adds $152/mo.
- Climate carrying-cost: in FEMA flood zone AH (mandatory federal flood insurance) — expect insurance premiums to compound above CPI over the hold.
Questions for the listing agent
- What's the actual annual flood-insurance premium (NFIP or private), and is the property in a SFHA with mandatory coverage?
- Is there a deadline driving the sale (1031 exchange, divorce, estate, relocation)? That informs how much negotiation room exists.
- Schools are D-rated, which usually means shorter tenancies and higher turnover. Who's the typical renter profile here, and what's been the actual vacancy rate?
- Crime grade is F in this area — have there been break-ins, vandalism, or insurance claims at this property in the last 3 years? What carrier currently insures it and at what premium?
- What's the average days-on-market for RENTAL listings here right now (not sales)? A rising rental-DOM trend means longer vacancies and softer asking-rent achievability than the comps imply.
- What's the recent tenant-quality profile in this submarket — average credit score on applications, eviction rate, late-payment / NSF rate, and stable-employment percentage? A property-management company in the area should have these aggregated.
- How much new for-sale + rental construction is in the pipeline within 1–3 miles? Heavy new supply typically softens prices + rents 12–24 months out; constrained supply supports both.
Investment metrics
- 1% rule
- 1.02% ✓
- Cap rate
- 8.97%
- Cash-on-cash
- 9.56%
- DSCR
- 1.43
- GRM
- 8.2
CMA / ARV
- ARV (on-the-fly)
- $361,920
- Comps found
- 12
Show comp detail 12 sales within ~0.75 mi
| Address | Dist | Beds/Ba | Sqft | Sold | Price | $/sf | Match |
|---|---|---|---|---|---|---|---|
| 29341 Sandburg Way | 0.05mi | 3/2.0 | 1,856 (0%) | 2mo | $425,000 | $229 | 96 |
| 29372 Providence Way #111 | 0.07mi | 2/2.0 (-1) | 1,776 (-4%) | 3mo | $289,000 | $163 | 82 |
| 29286 Whalebone Way | 0.23mi | 2/2.0 (-1) | 1,868 (+1%) | 4mo | $200,000 | $107 | 80 |
| 29330 Middleborough Way | 0.05mi | 3/3.0 | 1,640 (-12%) | 2mo | $319,000 | $195 | 73 |
| 29270 Sandburg Way #234 | 0.05mi | 2/2.0 (-1) | 1,683 (-9%) | 7mo | $345,000 | $205 | 71 |
| 29223 Whalebone Way #404 | 0.33mi | 2/2.0 (-1) | 1,818 (-2%) | 7mo | $220,000 | $121 | 71 |
| 29360 Middleborough Way #159 | 0.04mi | 2/2.0 (-1) | 1,670 (-10%) | 9mo | $345,000 | $207 | 69 |
| 29266 Nantucket Way | 0.19mi | 2/2.0 (-1) | 1,670 (-10%) | 1mo | $190,000 | $114 | 69 |
| 1400 Buckingham Way | 0.30mi | 3/2.0 | 1,607 (-13%) | 6mo | $385,000 | $240 | 58 |
| 29046 Rochester Way | 0.25mi | 2/2.0 (-1) | 1,600 (-14%) | 8mo | $267,000 | $167 | 54 |
| 1541 Ortega Ave | 0.74mi | 3/2.0 | 1,700 (-8%) | 4mo | $389,900 | $229 | 48 |
| 40 Ranchero Way #40 | 0.69mi | 2/2.0 (-1) | 1,728 (-7%) | 8mo | $289,000 | $167 | 45 |
Match score weights: distance 35% · size 25% · config 20% · recency 20%. Top-matched comps best support the ARV.
Projected returns pro-forma
-3.0% appreciation · 2.58% rent growth · sell at horizon
- IRR
- -4.8%
- Equity multiple
- 0.82×
- Total profit
- $-18,879
- Equity at exit
- $55,914
- IRR
- 4.3%
- Equity multiple
- 1.31×
- Total profit
- $32,748
- Equity at exit
- $32,423
Cash invested: $105,000 (down + closing). Projections, not guarantees.
Landlord ↔ Tenant lean methodology
- Overall (STATE)
- 18 Strongly Tenant-Friendly
- State California
- 18 Strongly Tenant-Friendly · D+13
- County
- — inherits STATE
- City
- — inherits STATE
ZIP-level market 94544
- Rents YoY
- 2.6%
- Active inventory
- 169
- Price-to-rent
- 8.2×
Monthly cashflow live
- Estimated rent
- $3,833 high interval (Pro) →
- Mortgage (P&I)
- −$1,967
- Tax from tax record
- −$69 /mo · $824/yr
- Insurance
- −$156
- Flood insurance flood zone
- −$152 /mo · $1,824/yr
- HOA
- −$0
- Vacancy / Maint / Mgmt
- −$805
- Net cashflow
- $684
Break-even live
UW: 25.0% down · 7.5% · 30yr · 1.5% tax · 5.0% vac · 8.0% maint · 8.0% mgmt
Financing live
Cash to close
- Down payment
- $93,750
- Closing costs
- $11,250
- Reserves months
- —
- Total cash needed
- —
Loan-product check · same deal, 3 products live
Conventional
25% down · 7.5% · 30yr
- Down + closing
- —
- Monthly P&I
- —
- Monthly cashflow
- —
- DSCR
- —
- Eligible?
- —
Personal DTI + credit; lowest rate.
DSCR
20% down · 8.5% · 30yr
- Down + closing
- —
- Monthly P&I
- —
- Monthly cashflow
- —
- DSCR
- —
- Eligible?
- —
No personal income docs; deal must DSCR.
Hard money
10% down · 12.0% · 12mo
- Down + closing
- —
- Monthly P&I
- —
- Monthly cashflow
- —
- DSCR
- —
- Eligible?
- —
Short-term bridge; refi at stabilization.
Rent comps 18 comps
| Address | Beds | Baths | Sqft | Rent | $/sqft | DOM | Units | Dist |
|---|---|---|---|---|---|---|---|---|
| 685 Carmar St Hayward, CA | 4.0 | 2.0 | 1569 | $3,900 | $2.49 | 22d | 1 | 0.44mi |
| 28187 Karn Dr Hayward, CA | 3.0 | 2.5 | 1335 | $3,300 | $2.47 | 5d | 1 | 0.66mi |
| 75 Quist Ave Hayward, CA | 4.0 | 2.5 | 1866 | $3,895 | $2.09 | 12d | 1 | 0.70mi |
| 111 Notion Way Hayward, CA | 3.0 | 2.5 | 1718 | $4,250 | $2.47 | 43d | 1 | 0.72mi |
| 206 Span Ct Hayward, CA | 3.0 | 3.5 | 1888 | $2,600 | $1.38 | 43d | 1 | 0.77mi |
| 29163 Dixon St Hayward, CA | 2.0–3.0 | 1.0–1.5 | 1100 | $3,595 | $3.27 | 1d | 5 | 0.83mi |
| 376 Line St Hayward, CA | 2.0 | 2.0 | 1286 | $3,500 | $2.72 | 2d | 1 | 0.90mi |
| 397 Line St Hayward, CA | 4.0 | 3.5 | 1885 | $5,000 | $2.65 | 18d | 1 | 0.92mi |
| 29384 Hub Ln Hayward, CA | 3.0 | 2.5 | 1684 | $3,950 | $2.35 | 3d | 1 | 0.95mi |
| 29384 Hub Ln Hayward, CA | 3.0 | 2.5 | 1684 | $3,950 | $2.35 | 2d | 1 | 0.95mi |
| 27703 Persimmon Dr Hayward, CA | 3.0 | 3.0 | 1549 | $3,695 | $2.39 | 43d | 1 | 1.10mi |
| 28877 Hideaway St Hayward, CA | 4.0 | 3.5 | 2022 | $4,600 | $2.27 | 43d | 1 | 1.17mi |
| 28168 Mission Blvd Hayward, CA | 1.0–3.0 | 1.0–2.0 | 1196 | $4,799 | $4.01 | 1d | 9 | 1.20mi |
| 981 Cheryl Ann Cir #40 Hayward, CA | 3.0 | 2.0 | 1245 | $3,800 | $3.05 | 43d | 1 | 1.22mi |
| 27479 Green Wood Rd Unit 1546495P Hayward, CA | 4.0 | 2.0 | 2120 | $5,258 | $2.48 | 15d | 1 | 1.23mi |
| 2901 Sorrento Way Union City, CA | 3.0 | 2.5 | 1869 | $5,000 | $2.68 | 1d | 1 | 1.28mi |
| 2506 Balmoral St Union City, CA | 4.0 | 2.5 | 2008 | $3,500 | $1.74 | 12d | 1 | 1.33mi |
| 26730 Tyrrell Ave Hayward, CA | 4.0 | 2.0 | 1250 | $3,650 | $2.92 | 43d | 1 | 1.48mi |
Listing history 10 events
-
2026-06-18statusdays on market $375,000 Active 1 DOM
-
2026-06-17days on market $375,000 Coming Soon 13 DOM
-
2026-06-16days on market $375,000 Coming Soon 12 DOM
-
2026-06-15days on market $375,000 Coming Soon 11 DOM
-
2026-06-13days on market $375,000 Coming Soon 9 DOM
-
2026-06-13days on market $375,000 Coming Soon 8 DOM
-
2026-06-09days on market $375,000 Coming Soon 5 DOM
-
2026-06-08days on market $375,000 Coming Soon 4 DOM
-
2026-06-07remarks 699-char remark
-
2026-06-07$375,000 Coming Soon 3 DOM
ⓘ Source: listings_history table (triggers on properties + properties_extension) + one-shot
backfill from property_details.listing_events for pre-trigger history.
Tax reassessment forecast CA · Resets to sale price
- Current annual tax
- $824 · $69/mo
- Projected year-2 tax
- $2,850 · $238/mo
- Expected delta
- +$2,026/yr (+$169/mo · 245.9%)
ⓘ Screening estimate from a state-policy table — verify with the county assessor before closing.
Climate risk First Street
- Flood 5/10 Major FEMA zone AH · 27% chance over 30 yrs
- Wildfire 1/10 Low
- Heat 4/10 Moderate 7 d/yr ≥89°F today · 14 d/yr by 30 yrs out
- Wind 1/10 Low
- Air quality 7/10 Severe 12 unhealthy d/yr today · 12 by 30 yrs out
Nearby sold comps map
Loading sold comps map…
Walkable amenities ~0.75 mi
Loading nearby amenities…
Taxation est. · year 1
- Rental income
- $45,994
- − Mortgage interest
- −$21,006
- − Property taxes
- −$824
- − Insurance
- −$3,699
- − Repairs & maintenance
- −$3,680
- − Management
- −$3,680
- − Depreciation
- −$10,909
- Taxable income
- $2,197
- Est. tax owed @ 24.0%
- −$527
- After-tax cash flow
- $7,686/yr
For passive investors: Depreciation is non-cash, so a rental often shows a tax loss while cash-flowing — sheltering income. Rental losses are passive: they offset passive income freely, and up to $25,000/yr can offset ordinary (W-2) income if you actively participate and your MAGI is under $100k (phasing out to $0 by $150k); unused losses carry forward. On sale, claimed depreciation is recaptured at up to 25%, and gains may owe capital-gains tax (a 1031 exchange can defer both). Figures are a year-1 estimate at your 24.0% rate — not tax advice; consult a CPA.
Schools (NCES district)
- District
- Hayward Unified
- NCES district ID
- 0616740
- Math proficiency
- 25% ▼ -1.00%
- Reading proficiency
- 37% ▬ 0.00%
- Median HH income
- $65,326
- Composite
- 31.27/100
- National rank
- #11241
- State rank
- #935 of 1400 in CA
Livability — Hayward
- Score
- 75/100
- State rank
- #124
- US rank
- #4294
Category grades
Schools grade is shown separately in the Schools card above.
Census & demographics
- Census place
- Hayward, CA
- County
- Alameda County · 1,614,355 people
- City population
- 191,800
- Metro
- San Francisco-Oakland-Berkeley, CA
- Population (ZIP)
- 76,947
- Household income
- $107,785
- Rent vs Own
- Severe rent burden
- 2573.0
Population outlook (Alameda County) Hauer SSP2
- Today (2025)
- 1,928,884 people
- By 2030
- 2,069,146 · +7.3%
- By 2040
- 2,338,405 · +21.2%
- By 2050
- 2,586,608 · +34.1%
- By 2075
- 3,061,911 · +58.7%
- By 2100
- 3,234,133 · +67.7%
Race, ethnicity, and origin ACS 2023
- Neighborhood character
- Highly diverse neighborhood (Simpson 0.70)
- Race & ethnicity
- Hispanic / Latino 45% Asian 28% Two or more races 13% White 11% Black 7% Pacific Islander 4% Native American 1%
- Hispanic origin (detail)
- Mexican 33% Puerto Rican 1%
- Common ancestry
- Russian 1% Italian 1% Lithuanian 1%
- Foreign-born
- 46% · Canada, China, Vietnam
- Languages at home
- 34% English-only · Spanish 37% Tagalog/Filipino 8% Other Indo-European 7%
Political lean MEDSL · Alameda
- 2024 margin
- Solid D (+53.6) · D 74.6% · R 21.0% · Other 4.4%
- 2008→2024 swing
- -5.9pp toward R · 2008: 59.5pp · 2024: 53.6pp
- All cycles
- 2024: D+53.6 2020: D+62.5 2016: D+64.4 2012: D+59.8 2008: D+59.5
Not yet ingested
- Civics
- —
Market trends
- HPI YoY
- ▼ -907.12%
- Current HPI
- 315.6082
- Rent YoY
- ▲ 2.58%
- Metro
- San Francisco-Oakland-Berkeley, CA
- State GDP YoY
- ▲ 3.21%
- F500 in state
- 116
Industry mix (Fortune 500 HQ in CA)
| Industry | F500 HQs | Revenue |
|---|---|---|
| Technology | 27 | $1,492B |
|
||
| Financial Services | 3 | $174B |
|
||
| Retail | 3 | $44B |
|
||
| Insurance | 3 | $26B |
|
||
| Media / Entertainment | 2 | $115B |
|
||
| Pharmaceuticals / Biotech | 2 | $62B |
|
||
Price history
+15.4% since first listed4 events — show timeline
- 2026-06-04 Coming Soon $375,000 bridgeMLS, Bay East AOR, or Contra Costa AOR
- 2018-03-09 Sold (MLS) $310,000 bridgeMLS, Bay East AOR, or Contra Costa AOR
- 2018-02-05 Pending — bridgeMLS, Bay East AOR, or Contra Costa AOR
- 2018-01-04 Listed $325,000 bridgeMLS, Bay East AOR, or Contra Costa AOR
Property tax history
-1.1%/yrLatest (2025): $824 · -1.6% YoY. Source: county tax records.
Cash-flow waterfall
monthlySold comps — $/sqft
last 12 mo · ≤1 miLoading sold comps…