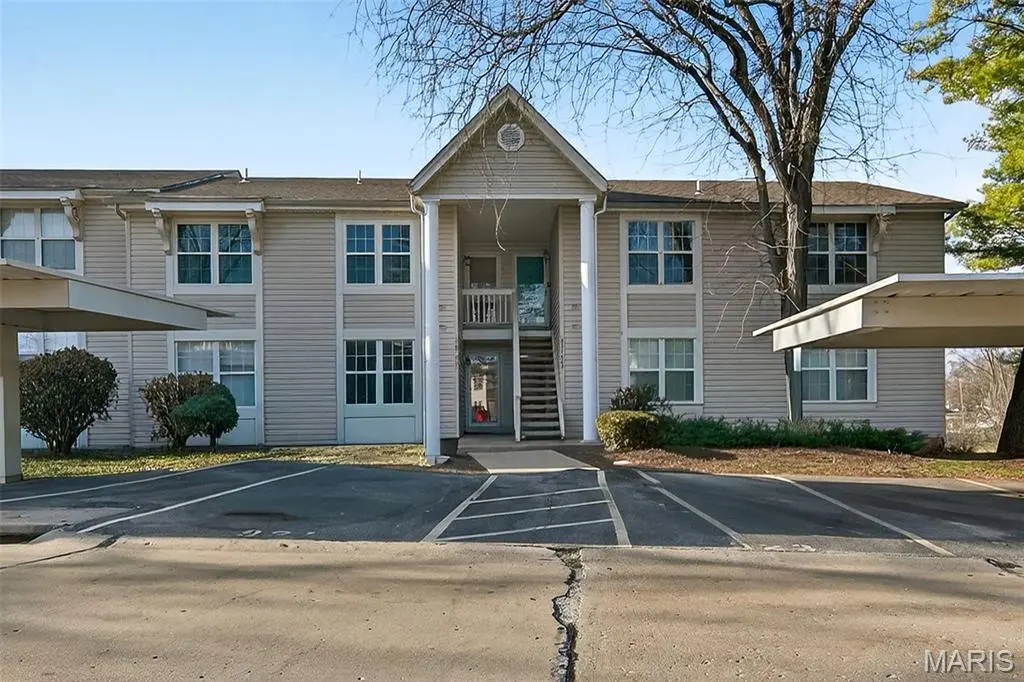
929 Sugar Lake Ct #7 · St. Peters, MO
Flood risk 1/10 · Minimal
- FEMA flood zone
- X (unshaded)
- Chance of flooding over 30 yrs
- 0.0%
- Est. flood insurance / yr
- $507 – $1,088
Fire risk 1/10 · Minimal
- Est. fire insurance / yr
- $1,054 – $1,958
Heat risk 5/10 · Moderate
- Hot days now (above 108°F)
- 7 days/yr
- Hot days in 30 yrs
- 20 days/yr
Wind risk 2/10 · Minimal
- Chance of severe wind over 30 yrs
- 1.0%
Air-quality risk 2/10 · Minimal
- Unhealthy air days now
- 2 days/yr
- Unhealthy air days in 30 yrs
- 2 days/yr
Risk factors via First Street. Map © Google.
Why this score? — see what drove the D+ grade
The composite is a weighted blend of 9 inputs, each scored 0–100. Each bar is that input's sub-score; the figure is the points it added to the 100-point composite (weight × sub-score).
- Cash flow +14.2/30.0
- ARV discount +11.5/15.0
- 1% rule +6.1/10.0
- Schools +5.2/10.0
- DSCR +4.3/10.0
- Rent growth +3.2/5.0
- Livability +2.5/5.0
- Condition / age +2.5/5.0
- Appreciation +0.0/10.0
$153,000
🖨 Deal sheet 📄 Offer letter ✓ Due diligence
Listing remarks MLS
The Best Condo available is right here-- 2 bed, 1 bath, upper level with balcony overseeing the backyard. This home is freshly painted with newer thermal windows, newer sliding glass door, updated wood flooring, and a wood-burning fireplace. This is a move-in ready home & Seller is including all kitchen appliances and the washer/dryer. A very low monthly condo fees covers the water, sewer, & trash expenses. This is a must see home.
Key facts
- Balcony
- Move in ready
- $284 HOA
Tags
Neighborhood map
What this means for you Summary
Snapshot
- This is a 2-bed/1.0-bath condo listed at $153k.
Deal economics
- At list price, monthly cash flow is $26 ($312/yr) — positive.
- The deal already cash-flows at list — no discount required.
- Meets the 1% rule at list price ($2k rent vs $153k).
- Recommended offer: $139k (9.0% below list) — sets the bar for market timing.
- Cap rate 6.5% vs local median 4.2% in St. Peters — top-decile yield for the area; either an underpriced asset or a hidden risk that comps aren't pricing in. Stress-test before assuming the spread holds.
Location & tenants
- Location reads: area grade D — affects rentability + tenant quality, not the cash-flow math above.
- Francis Howell R-III (suburban): math 53% / reading 63% proficiency, ranked #11 of 324 in MO (top 3%) — acceptable for families but not a draw, mixed tenant base, ~2y average lease; only 15% free/reduced lunch — higher-income household profile.
- Market conditions: Rents rising (+2.7%/yr); 290 active listings in the ZIP; 6 comparable units currently listed for rent nearby; rentals at typical pace (median 19d on market — plan ~3-4 weeks tenant-placement turnaround); solid renter incomes; 2,021 units permitted in St. Charles County in 2024 (568 in 5+ unit buildings).
Forward outlook
- Local home prices are declining (-3.0%/yr); year-one equity from $1k of loan paydown is wiped out by about $5k of value loss. Plan a longer hold.
- St. Charles County population projected at +22% by 2050 — long-run rental-demand tailwind backs the buy-and-hold thesis.
Negotiation context
- It's been on market 102 days — a 9% lower offer ($139k) is reasonable based on typical stale-listing flexibility.
- 2 sale attempts since 4y ago with the ask held roughly flat each time — persistent listings suggest the price (not the market) is what's stuck; bring a comps-based counter.
Risks & watch-outs
- Climate carrying-cost: extreme-heat days projected 7→20/yr by 2055 (HVAC capex compounding) — expect insurance premiums to compound above CPI over the hold.
Questions for the listing agent
- It's been on market 102 days. Have you received any prior offers? Is the seller open to a 9% concession, seller financing, or rate buy-down credit?
- What does the HOA fee cover, when was the last increase, and are there any pending special assessments or reserve-fund shortfalls?
- Any open or pending special assessments — roof, HVAC, plumbing, elevator, façade? What's the per-unit balance and payoff schedule, and is the seller paying it off at close or rolling it to the buyer?
- Why hasn't it sold? Are there any deal-killer items the seller is aware of (foundation, flood, title, zoning, code violations)?
- Is there a deadline driving the sale (1031 exchange, divorce, estate, relocation)? That informs how much negotiation room exists.
- The area grade is low — what's the realistic commute time and amenity access for the typical tenant pool here? Any planned neighborhood developments (good or bad) we should know about?
- What's the average days-on-market for RENTAL listings here right now (not sales)? A rising rental-DOM trend means longer vacancies and softer asking-rent achievability than the comps imply.
- What's the recent tenant-quality profile in this submarket — average credit score on applications, eviction rate, late-payment / NSF rate, and stable-employment percentage? A property-management company in the area should have these aggregated.
- How much new apartment / multifamily construction is in the pipeline within 1–3 miles? Heavy new supply (>2% of stock underway) typically softens rents 12–24 months out; light construction supports rent growth.
Investment metrics
- 1% rule
- 1.11% ✓
- Cap rate
- 6.50%
- Cash-on-cash
- 0.73%
- DSCR
- 1.03
- GRM
- 7.5
CMA / ARV
- ARV (median comp)
- $168,018
- List price
- $153,000
- Delta
- -8.94%
- Verdict
- FAIR
- Comps
- 20 within 1.0 mi
Projected returns pro-forma
-3.0% appreciation · 2.69% rent growth · sell at horizon
- IRR
- -15.4%
- Equity multiple
- 0.45×
- Total profit
- $-23,480
- Equity at exit
- $22,813
- IRR
- -7.3%
- Equity multiple
- 0.54×
- Total profit
- $-19,720
- Equity at exit
- $13,229
Cash invested: $42,840 (down + closing). Projections, not guarantees.
Landlord ↔ Tenant lean methodology
- Overall (STATE)
- 81 Strongly Landlord-Friendly
- State Missouri
- 81 Strongly Landlord-Friendly · R+10
- County
- — inherits STATE
- City
- — inherits STATE
ZIP-level market 63376
- Rents YoY
- 2.7%
- Active inventory
- 290
- Price-to-rent
- 7.5×
Monthly cashflow live
- Estimated rent
- $1,693 high interval (Pro) →
- Mortgage (P&I)
- −$802
- Tax from tax record
- −$162 /mo · $1,940/yr
- Insurance
- −$64
- HOA
- −$284
- Vacancy / Maint / Mgmt
- −$356
- Net cashflow
- $26
Break-even live
UW: 25.0% down · 7.5% · 30yr · 1.5% tax · 5.0% vac · 8.0% maint · 8.0% mgmt
Financing live
Cash to close
- Down payment
- $38,250
- Closing costs
- $4,590
- Reserves months
- —
- Total cash needed
- —
Loan-product check · same deal, 3 products live
Conventional
25% down · 7.5% · 30yr
- Down + closing
- —
- Monthly P&I
- —
- Monthly cashflow
- —
- DSCR
- —
- Eligible?
- —
Personal DTI + credit; lowest rate.
DSCR
20% down · 8.5% · 30yr
- Down + closing
- —
- Monthly P&I
- —
- Monthly cashflow
- —
- DSCR
- —
- Eligible?
- —
No personal income docs; deal must DSCR.
Hard money
10% down · 12.0% · 12mo
- Down + closing
- —
- Monthly P&I
- —
- Monthly cashflow
- —
- DSCR
- —
- Eligible?
- —
Short-term bridge; refi at stabilization.
Rent comps 6 comps
| Address | Beds | Baths | Sqft | Rent | $/sqft | DOM | Units | Dist |
|---|---|---|---|---|---|---|---|---|
| 531 Saravalle Dr Saint Peters, MO | 2.0 | 2.0 | 1012 | $1,650 | $1.63 | 43d | 1 | 0.42mi |
| 100 Broadridge Dr St Peters, MO | 1.0–2.0 | 1.0–2.0 | 845 | $1,648 | $1.95 | 1d | 10 | 0.81mi |
| 1000 Jasper Ln St Peters, MO | 1.0–3.0 | 1.0–2.0 | 1047 | $2,000 | $1.91 | 1d | 12 | 0.97mi |
| 11 Rose Dr St Charles, MO | 2.0 | 1.5 | 860 | $1,850 | $2.15 | 7d | 1 | 1.07mi |
| 1306 Garden Valley Dr Unit C St Peters, MO | 1.0 | 1.0 | 720 | $1,000 | $1.39 | 19d | 1 | 1.40mi |
| 4153 McClay Rd Saint Charles, MO | 3.0 | 2.0 | 1096 | $2,100 | $1.92 | 43d | 1 | 1.42mi |
HOA detail condo
- Monthly dues
- $284 · $3,408/yr
- Likely covers
- watersewertrash
- Assessments
- None detected in remarks — confirm with the listing agent.
Listing history 27 events
-
2026-06-18days on market $153,000 Active 102 DOM
-
2026-06-17days on market $153,000 Active 101 DOM
-
2026-06-16days on market $153,000 Active 100 DOM
-
2026-06-15days on market $153,000 Active 99 DOM
-
2026-06-13days on market $153,000 Active 97 DOM
-
2026-06-13pricedays on market $153,000 Active 96 DOM
-
2026-06-09days on market $160,000 Active 93 DOM
-
2026-06-08days on market $160,000 Active 92 DOM
-
2026-06-07days on market $160,000 Active 91 DOM
-
2026-06-05days on market $160,000 Active 88 DOM
-
2026-06-03days on market $160,000 Active 87 DOM
-
2026-06-02days on market $160,000 Active 86 DOM
-
2026-06-01days on market $160,000 Active 85 DOM
-
2026-05-31days on market $160,000 Active 84 DOM
-
2026-03-08$160,000 Active 448-char remark
Show marketing remark (448 chars)
The Best Condo available is right here-- 2 bed, 1 bath, upper level with balcony overseeing the backyard. This home is freshly painted with newer thermal windows, newer sliding glass door, updated wood flooring, and a wood-burning fireplace. This is a move-in ready home & Seller is including all kitchen appliances and the washer/dryer. A very low monthly condo fees covers the water, sewer, & trash expenses. This is a must see home.
-
2024-03-11soldstatus $170,000
-
2022-07-01soldstatus $170,000
-
2022-06-28status Pending 230-char remark
Show marketing remark (230 chars)
Beautiful, completely remodeled move in ready home in the most desirable part of Saint Charles County! The pictures speak for themselves when representing the high arches in the living room right over the warm and cozy fire place.
-
2022-06-27soldstatus Closed 230-char remark
Show marketing remark (230 chars)
Beautiful, completely remodeled move in ready home in the most desirable part of Saint Charles County! The pictures speak for themselves when representing the high arches in the living room right over the warm and cozy fire place.
-
2022-05-24historical Active Under Contract 230-char remark
Show marketing remark (230 chars)
Beautiful, completely remodeled move in ready home in the most desirable part of Saint Charles County! The pictures speak for themselves when representing the high arches in the living room right over the warm and cozy fire place.
-
2022-05-18$160,000 Active 230-char remark
Show marketing remark (230 chars)
Beautiful, completely remodeled move in ready home in the most desirable part of Saint Charles County! The pictures speak for themselves when representing the high arches in the living room right over the warm and cozy fire place.
-
2005-03-04soldstatus $117,000
-
2002-08-20soldstatus $76,500
-
1995-02-01soldstatus
-
1991-02-01soldstatus
-
1988-10-01soldstatus
-
1988-07-01soldstatus
ⓘ Source: listings_history table (triggers on properties + properties_extension) + one-shot
backfill from property_details.listing_events for pre-trigger history.
Tax reassessment forecast MO · Resets to sale price
- Current annual tax
- $1,940 · $162/mo
- Projected year-2 tax
- $1,940 · $162/mo
- Expected delta
- $0/yr ($0/mo · 0.0%)
ⓘ Screening estimate from a state-policy table — verify with the county assessor before closing.
Climate risk First Street
- Flood 1/10 Low FEMA zone X (unshaded) · 0% chance over 30 yrs
- Wildfire 1/10 Low
- Heat 5/10 Major 7 d/yr ≥108°F today · 20 d/yr by 30 yrs out
- Wind 2/10 Low 100% chance of damaging wind over 30 yrs
- Air quality 2/10 Low 2 unhealthy d/yr today · 2 by 30 yrs out
Nearby sold comps map
Loading sold comps map…
Walkable amenities ~0.75 mi
Loading nearby amenities…
Taxation est. · year 1
- Rental income
- $20,321
- − Mortgage interest
- −$8,570
- − Property taxes
- −$1,940
- − Insurance
- −$765
- − Repairs & maintenance
- −$1,626
- − Management
- −$1,626
- − HOA
- −$3,408
- − Depreciation
- −$4,451
- Taxable loss
- −$2,065
- Est. tax savings @ 24.0%
- +$496
- After-tax cash flow
- $808/yr
For passive investors: Depreciation is non-cash, so a rental often shows a tax loss while cash-flowing — sheltering income. Rental losses are passive: they offset passive income freely, and up to $25,000/yr can offset ordinary (W-2) income if you actively participate and your MAGI is under $100k (phasing out to $0 by $150k); unused losses carry forward. On sale, claimed depreciation is recaptured at up to 25%, and gains may owe capital-gains tax (a 1031 exchange can defer both). Figures are a year-1 estimate at your 24.0% rate — not tax advice; consult a CPA.
Schools (NCES district)
- District
- Francis Howell R-III
- NCES district ID
- 2928950
- Math proficiency
- 53% ▼ -12.00%
- Reading proficiency
- 63% ▼ -5.00%
- Median HH income
- $79,768
- Composite
- 52.23/100
- National rank
- #1602
- State rank
- #11 of 324 in MO
Livability — St. Peters
No livability data for this city. (Only ~50 U.S. cities are tracked.)
Census & demographics
- Census place
- St. Peters, MO
- County
- Saint Charles County · 399,703 people
- City population
- 74,876
- Metro
- St. Louis, MO-IL
- Population (ZIP)
- 74,962
- Household income
- $96,393
- Rent vs Own
- Severe rent burden
- 964.0
Population outlook (St. Charles County) Hauer SSP2
- Today (2025)
- 437,857 people
- By 2030
- 461,707 · +5.4%
- By 2040
- 503,222 · +14.9%
- By 2050
- 534,684 · +22.1%
- By 2075
- 597,047 · +36.4%
- By 2100
- 609,682 · +39.2%
Race, ethnicity, and origin ACS 2023
- Neighborhood character
- Predominantly White (86%)
- Race & ethnicity
- White 86% Two or more races 6% Black 5% Hispanic / Latino 2% Asian 2%
- Common ancestry
- Lithuanian 3% Romanian 3% Italian 2%
- Foreign-born
- 3% · China, Canada
- Languages at home
- 96% English-only · Spanish 1% Chinese 1% Other Asian/Pacific 1%
Political lean MEDSL · St. Charles
- 2024 margin
- R (+17.0) · D 40.8% · R 57.8% · Other 1.4%
- 2008→2024 swing
- -7.2pp toward R · 2008: -9.7pp · 2024: -17.0pp
- All cycles
- 2024: R+17.0 2020: R+17.5 2016: R+26.4 2012: R+21.0 2008: R+9.7
Not yet ingested
- Civics
- —
Market trends
- HPI YoY
- ▼ -315.50%
- Current HPI
- 230.3362
- Rent YoY
- ▲ 2.69%
- Metro
- St. Louis, MO-IL
- State GDP YoY
- ▲ 1.84%
- F500 in state
- 20
Industry mix (Fortune 500 HQ in MO)
| Industry | F500 HQs | Revenue |
|---|---|---|
| Healthcare | 1 | $163B |
|
||
| Insurance | 1 | $21B |
|
||
| Industrial Technology | 1 | $17B |
|
||
| Retail | 1 | $16B |
|
||
| Industrial Distribution | 1 | $10B |
|
||
| Utilities | 1 | $9B |
|
||
Price history
+109.2% since first listed13 events — show timeline
- 2026-03-08 Listed $160,000 MARIS as Distributed by MLS Grid
- 2024-03-11 Sold (Public Records) $170,000 Public Records
- 2022-07-01 Sold (Public Records) $170,000 Public Records
- 2022-06-28 Pending — MARIS as Distributed by MLS Grid
- 2022-06-27 Sold (MLS) — MARIS as Distributed by MLS Grid
- 2022-05-24 Contingent — MARIS as Distributed by MLS Grid
- 2022-05-18 Listed $160,000 MARIS as Distributed by MLS Grid
- 2005-03-04 Sold (Public Records) $117,000 Public Records
- 2002-08-20 Sold (Public Records) $76,500 Public Records
- 1995-02-01 Sold (Public Records) — Public Records
- 1991-02-01 Sold (Public Records) — Public Records
- 1988-10-01 Sold (Public Records) — Public Records
- 1988-07-01 Sold (Public Records) — Public Records
Property tax history
+3.9%/yrLatest (2025): $1,940 · +8.3% YoY. Source: county tax records.
Cash-flow waterfall
monthlySold comps — $/sqft
last 12 mo · ≤1 miLoading sold comps…