 🏷️ Likely Rental
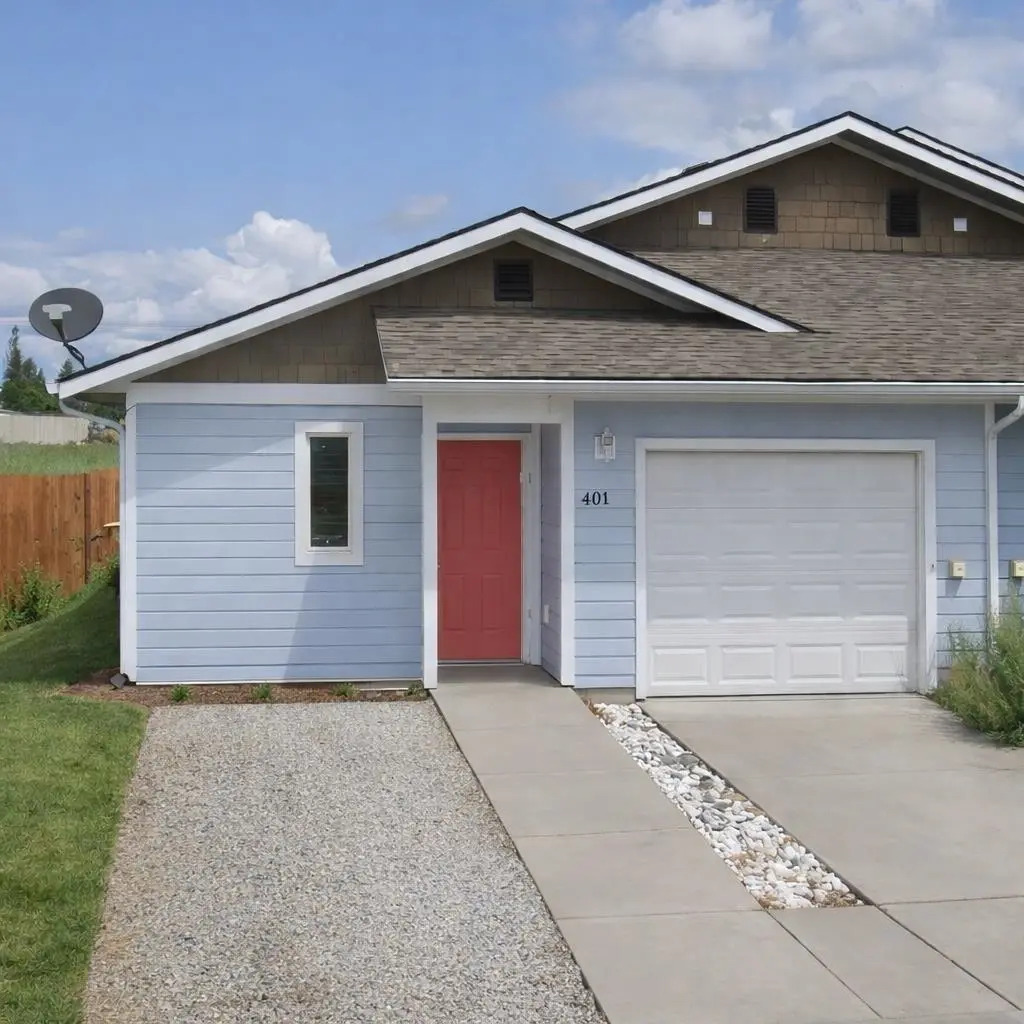
401 E I St · Deer Park, WA
Flood risk 1/10 · Minimal
- FEMA flood zone
- X (unshaded)
- Chance of flooding over 30 yrs
- 0.0%
- Est. flood insurance / yr
- $507 – $1,088
Fire risk 7/10 · Major
- Est. fire insurance / yr
- $604 – $1,122
Heat risk 3/10 · Minor
- Hot days now (above 94°F)
- 7 days/yr
- Hot days in 30 yrs
- 14 days/yr
Wind risk 1/10 · Minimal
- Chance of severe wind over 30 yrs
- —
Air-quality risk 8/10 · Major
- Unhealthy air days now
- 13 days/yr
- Unhealthy air days in 30 yrs
- 16 days/yr
Risk factors via First Street. Map © Google.
Why this score? — see what drove the D- grade
The composite is a weighted blend of 9 inputs, each scored 0–100. Each bar is that input's sub-score; the figure is the points it added to the 100-point composite (weight × sub-score).
- ARV discount +15.0/15.0
- Cash flow +7.4/30.0
- Schools +5.2/10.0
- Livability +2.9/5.0
- Rent growth +2.5/5.0
- Condition / age +2.5/5.0
- 1% rule +2.2/10.0
- DSCR +1.6/10.0
- Appreciation +0.0/10.0
$220,000
🖨 Deal sheet 📄 Offer letter ✓ Due diligence
Listing remarks MLS
Opportunity awaits in this 2-bedroom, 1-bathroom Deer Park area home built in 2011! Featuring solid single-level construction and a functional layout, the property includes a two-car sized tandem garage for added storage and radiant floor heat for year-round comfort and efficiency. Currently tenant-occupied, this home is competitively priced and presents a compelling value for those seeking affordability and potential!
Key facts
- 3,049 sq ft lot
- 2 garage spots
- Built 2011
Neighborhood map
What this means for you Summary
Snapshot
- This is a 2-bed/1.0-bath single-family listed at $220k.
Deal economics
- At list price, monthly cash flow is $-280 ($-3k/yr) — negative.
- To cash-flow at today's rent, offer at most $179k (18.4% below list).
- To meet the 1% rule (rent ≥ 1% of price), the offer needs to be $159k (27.8% below list).
- Recommended offer: $159k (27.8% below list) — sets the bar for 1% rule.
- Cap rate 4.8% vs local median 2.5% in Deer Park — top-decile yield for the area; either an underpriced asset or a hidden risk that comps aren't pricing in. Stress-test before assuming the spread holds.
Location & tenants
- Location reads 57/100 on livability (#531 in WA) — a working-class tenant base; expect higher turnover. Strengths: housing A+, cost of living B+; Watch: amenities F, commute F, employment D-.
- Deer Park School District (rural): math 52% / reading 66% proficiency, ranked #74 of 291 in WA (top 25%) — acceptable for families but not a draw, mixed tenant base, ~2y average lease.
- Market conditions: 354 active listings in the ZIP; 4 comparable units currently listed for rent nearby; rentals leasing fast (median 14d on market — plan ~1-2 weeks tenant-placement turnaround); 3,608 units permitted in Spokane County in 2024 (1,792 in 5+ unit buildings).
Forward outlook
- Local home prices are declining (-3.0%/yr); year-one equity from $2k of loan paydown is wiped out by about $7k of value loss. Plan a longer hold.
- Spokane County population projected at +13% by 2050 — modest demand growth; plan on rents tracking national, not racing it.
Negotiation context
- It's been on market 79 days — a 6% lower offer ($207k) is reasonable based on typical stale-listing flexibility.
Risks & watch-outs
- Climate carrying-cost: major wildfire risk — expect insurance premiums to compound above CPI over the hold.
Questions for the listing agent
- What do current leases actually rent for vs. the listed asking? Can we see a recent rent roll and the last 12 months of T-12 income?
- It's been on market 79 days. Have you received any prior offers? Is the seller open to a 28% concession, seller financing, or rate buy-down credit?
- What does the HOA fee cover, when was the last increase, and are there any pending special assessments or reserve-fund shortfalls?
- Why hasn't it sold? Are there any deal-killer items the seller is aware of (foundation, flood, title, zoning, code violations)?
- Is there a deadline driving the sale (1031 exchange, divorce, estate, relocation)? That informs how much negotiation room exists.
- The area grade is low — what's the realistic commute time and amenity access for the typical tenant pool here? Any planned neighborhood developments (good or bad) we should know about?
- What's the average days-on-market for RENTAL listings here right now (not sales)? A rising rental-DOM trend means longer vacancies and softer asking-rent achievability than the comps imply.
- What's the recent tenant-quality profile in this submarket — average credit score on applications, eviction rate, late-payment / NSF rate, and stable-employment percentage? A property-management company in the area should have these aggregated.
- How much new for-sale + rental construction is in the pipeline within 1–3 miles? Heavy new supply typically softens prices + rents 12–24 months out; constrained supply supports both.
Investment metrics
- 1% rule
- 0.72% ✗
- Cap rate
- 4.76%
- Cash-on-cash
- -5.46%
- DSCR
- 0.76
- GRM
- 11.5
CMA / ARV
- ARV (median comp)
- $356,681
- List price
- $220,000
- Delta
- -38.32%
- Verdict
- UNDERPRICED
- Comps
- 20 within 1.0 mi
Show comp detail 9 sales within ~0.75 mi
| Address | Dist | Beds/Ba | Sqft | Sold | Price | $/sf | Match |
|---|---|---|---|---|---|---|---|
| 315 E I St | 0.02mi | 2/1.0 | 1,072 (-2%) | 9mo | $260,000 | $243 | 88 |
| 410 E I St | 0.04mi | 2/1.0 | 1,176 (+7%) | 1mo | $242,403 | $206 | 85 |
| 406 E I St | 0.04mi | 2/1.0 | 1,176 (+7%) | 3mo | $242,131 | $206 | 83 |
| 608 S Margaret St | 0.27mi | 2/2.0 | 1,120 (+2%) | 11mo | $335,000 | $299 | 71 |
| 17 S Arnim St | 0.60mi | 2/1.0 | 1,040 (-5%) | 9mo | $255,000 | $245 | 56 |
| 219 E Meadowmere Rd | 0.21mi | 3/2.0 (+1) | 1,196 (+9%) | 13mo | $325,000 | $272 | 55 |
| 404 E Crawford Ave | 0.61mi | 3/1.0 (+1) | 1,200 (+10%) | 12mo | $290,000 | $242 | 41 |
| 301 S Forest Ave | 0.65mi | 3/2.0 (+1) | 1,200 (+10%) | 10mo | $415,000 | $346 | 36 |
| 820 E D St | 0.48mi | 2/1.0 | 938 (-14%) | 23mo | $315,000 | $336 | 35 |
Match score weights: distance 35% · size 25% · config 20% · recency 20%. Top-matched comps best support the ARV.
Projected returns pro-forma
-3.0% appreciation · 3.0% rent growth · sell at horizon
- IRR
- -25.6%
- Equity multiple
- 0.13×
- Total profit
- $-53,481
- Equity at exit
- $32,803
- IRR
- -22.0%
- Equity multiple
- -0.13×
- Total profit
- $-69,438
- Equity at exit
- $19,022
Cash invested: $61,600 (down + closing). Projections, not guarantees.
Landlord ↔ Tenant lean methodology
- Overall (STATE)
- 28 Tenant-Leaning
- State Washington
- 28 Tenant-Leaning · D+8
- County
- — inherits STATE
- City
- — inherits STATE
ZIP-level market 99006
- Home prices YoY
- -17.4%
- Active inventory
- 354
- Price-to-rent
- 11.5×
Monthly cashflow live
- Estimated rent
- $1,588 medium interval (Pro) →
- Mortgage (P&I)
- −$1,154
- Tax est. 1.5%
- −$275 /mo · $3,300/yr
- Insurance
- −$92
- HOA
- −$15
- Vacancy / Maint / Mgmt
- −$334
- Net cashflow
- $-280
Break-even live
UW: 25.0% down · 7.5% · 30yr · 1.5% tax · 5.0% vac · 8.0% maint · 8.0% mgmt
Financing live
Cash to close
- Down payment
- $55,000
- Closing costs
- $6,600
- Reserves months
- —
- Total cash needed
- —
Loan-product check · same deal, 3 products live
Conventional
25% down · 7.5% · 30yr
- Down + closing
- —
- Monthly P&I
- —
- Monthly cashflow
- —
- DSCR
- —
- Eligible?
- —
Personal DTI + credit; lowest rate.
DSCR
20% down · 8.5% · 30yr
- Down + closing
- —
- Monthly P&I
- —
- Monthly cashflow
- —
- DSCR
- —
- Eligible?
- —
No personal income docs; deal must DSCR.
Hard money
10% down · 12.0% · 12mo
- Down + closing
- —
- Monthly P&I
- —
- Monthly cashflow
- —
- DSCR
- —
- Eligible?
- —
Short-term bridge; refi at stabilization.
Rent comps 4 comps
| Address | Beds | Baths | Sqft | Rent | $/sqft | DOM | Units | Dist |
|---|---|---|---|---|---|---|---|---|
| 107 E H St Unit 101-C Deer Park, WA | 3.0 | 2.0 | 1086 | $1,450 | $1.34 | 13d | 1 | 0.29mi |
| 425 S Main St Deer Park, WA | 2.0 | 2.0 | 950 | $1,300 | $1.37 | 13d | 1 | 0.35mi |
| 420 E C St, Unit 422 Deer Park, WA | 2.0 | 1.0 | 720 | $1,200 | $1.67 | 13d | 1 | 0.72mi |
| 1814 E Carol St Deer Park, WA | 2.0 | 2.0 | 1320 | $1,695 | $1.28 | 13d | 1 | 1.24mi |
HOA detail
- Monthly dues
- $15 · $180/yr
Listing history 16 events
-
2026-06-18days on market $220,000 Active 79 DOM
-
2026-06-17days on market $220,000 Active 78 DOM
-
2026-06-16days on market $220,000 Active 77 DOM
-
2026-06-15days on market $220,000 Active 76 DOM
-
2026-06-14days on market $220,000 Active 74 DOM
-
2026-06-13days on market $220,000 Active 73 DOM
-
2026-06-10days on market $220,000 Active 71 DOM
-
2026-06-09days on market $220,000 Active 70 DOM
-
2026-06-08days on market $220,000 Active 69 DOM
-
2026-06-07days on market $220,000 Active 68 DOM
-
2026-06-03days on market $220,000 Active 64 DOM
-
2026-06-02days on market $220,000 Active 63 DOM
-
2026-06-01days on market $220,000 Active 62 DOM
-
2026-05-31days on market $220,000 Active 61 DOM
-
2026-05-31days on market $220,000 Active 60 DOM
-
2026-03-31$220,000 Active 422-char remark
Show marketing remark (422 chars)
Opportunity awaits in this 2-bedroom, 1-bathroom Deer Park area home built in 2011! Featuring solid single-level construction and a functional layout, the property includes a two-car sized tandem garage for added storage and radiant floor heat for year-round comfort and efficiency. Currently tenant-occupied, this home is competitively priced and presents a compelling value for those seeking affordability and potential!
ⓘ Source: listings_history table (triggers on properties + properties_extension) + one-shot
backfill from property_details.listing_events for pre-trigger history.
Climate risk First Street
- Flood 1/10 Low FEMA zone X (unshaded) · 0% chance over 30 yrs
- Wildfire 7/10 Severe
- Heat 3/10 Moderate 7 d/yr ≥94°F today · 14 d/yr by 30 yrs out
- Wind 1/10 Low
- Air quality 8/10 Severe 13 unhealthy d/yr today · 16 by 30 yrs out
Nearby sold comps map
Loading sold comps map…
Walkable amenities ~0.75 mi
Loading nearby amenities…
Taxation est. · year 1
- Rental income
- $19,062
- − Mortgage interest
- −$12,323
- − Property taxes
- −$3,300
- − Insurance
- −$1,100
- − Repairs & maintenance
- −$1,525
- − Management
- −$1,525
- − HOA
- −$180
- − Depreciation
- −$6,400
- Taxable loss
- −$7,292
- Est. tax savings @ 24.0%
- +$1,750
- After-tax cash flow
- $-1,616/yr
For passive investors: Depreciation is non-cash, so a rental often shows a tax loss while cash-flowing — sheltering income. Rental losses are passive: they offset passive income freely, and up to $25,000/yr can offset ordinary (W-2) income if you actively participate and your MAGI is under $100k (phasing out to $0 by $150k); unused losses carry forward. On sale, claimed depreciation is recaptured at up to 25%, and gains may owe capital-gains tax (a 1031 exchange can defer both). Figures are a year-1 estimate at your 24.0% rate — not tax advice; consult a CPA.
Schools (NCES district)
- District
- Deer Park School District
- NCES district ID
- 5302070
- Math proficiency
- 52% ▼ -1.00%
- Reading proficiency
- 66% ▬ 0.00%
- Median HH income
- $47,808
- Composite
- 51.66/100
- National rank
- #3620
- State rank
- #74 of 291 in WA
Livability — Deer Park
- Score
- 57/100
- State rank
- #531
- US rank
- #22045
Category grades
Schools grade is shown separately in the Schools card above.
Census & demographics
- Census place
- Deer Park, WA
- County
- Spokane County · 496,401 people
- City population
- 16,177
- Metro
- Spokane-Spokane Valley, WA
- Population (ZIP)
- 16,177
- Household income
- $72,200
- Rent vs Own
- Severe rent burden
- 144.0
Population outlook (Spokane County) Hauer SSP2
- Today (2025)
- 531,314 people
- By 2030
- 549,278 · +3.4%
- By 2040
- 577,822 · +8.8%
- By 2050
- 598,188 · +12.6%
- By 2075
- 630,744 · +18.7%
- By 2100
- 622,360 · +17.1%
Race, ethnicity, and origin ACS 2023
- Neighborhood character
- Predominantly White (91%)
- Race & ethnicity
- White 91% Two or more races 6% Hispanic / Latino 4%
- Common ancestry
- Portuguese 6% Slovak 3% Serbian 3%
- Foreign-born
- 2% · Canada
- Languages at home
- 96% English-only · Spanish 2% Other Asian/Pacific 1%
Political lean MEDSL · Spokane
- 2024 margin
- Toss-up / Even · D 46.0% · R 51.0% · Other 3.0%
- 2008→2024 swing
- -3.8pp toward R · 2008: -1.1pp · 2024: -5.0pp
- All cycles
- 2024: R+5.0 2020: R+4.3 2016: R+8.3 2012: R+6.3 2008: R+1.1
Not yet ingested
- Civics
- —
Market trends
- HPI YoY
- ▼ -79.74%
- Current HPI
- 378.0416
- Rent YoY
- —
- Metro
- Spokane-Spokane Valley, WA
- State GDP YoY
- ▲ 4.65%
- F500 in state
- 22
Industry mix (Fortune 500 HQ in WA)
| Industry | F500 HQs | Revenue |
|---|---|---|
| Retail | 2 | $269B |
|
||
| Technology / Retail | 1 | $638B |
|
||
| Technology | 1 | $245B |
|
||
| Telecommunications | 1 | $38B |
|
||
| Food / Beverage | 1 | $36B |
|
||
| Automotive / Trucks | 1 | $34B |
|
||
Price history
1 event — show timeline
- 2026-03-31 Listed $220,000 SPOKANEMLS as Distributed by MLS Grid
Cash-flow waterfall
monthlySold comps — $/sqft
last 12 mo · ≤1 miLoading sold comps…