2323 Sidney Ave · Baltimore, MD
Flood risk 1/10 · Minimal
- FEMA flood zone
- X (unshaded)
- Chance of flooding over 30 yrs
- 0.0%
- Est. flood insurance / yr
- $473 – $860
Fire risk 1/10 · Minimal
- Est. fire insurance / yr
- $755 – $1,403
Heat risk 8/10 · Major
- Hot days now (above 102°F)
- 7 days/yr
- Hot days in 30 yrs
- 15 days/yr
Wind risk 6/10 · Moderate
- Chance of severe wind over 30 yrs
- 27.0%
Air-quality risk 4/10 · Minor
- Unhealthy air days now
- 6 days/yr
- Unhealthy air days in 30 yrs
- 7 days/yr
Risk factors via First Street. Map © Google.
Why this score? — see what drove the B- grade
The composite is a weighted blend of 9 inputs, each scored 0–100. Each bar is that input's sub-score; the figure is the points it added to the 100-point composite (weight × sub-score).
- Cash flow +30.0/30.0
- 1% rule +10.0/10.0
- DSCR +10.0/10.0
- ARV discount +7.5/15.0
- Livability +3.8/5.0
- Condition / age +2.5/5.0
- Rent growth +2.2/5.0
- Schools +1.0/10.0
- Appreciation +0.0/10.0
$140,000
🖨 Deal sheet 📄 Offer letter ✓ Due diligence
Listing remarks MLS
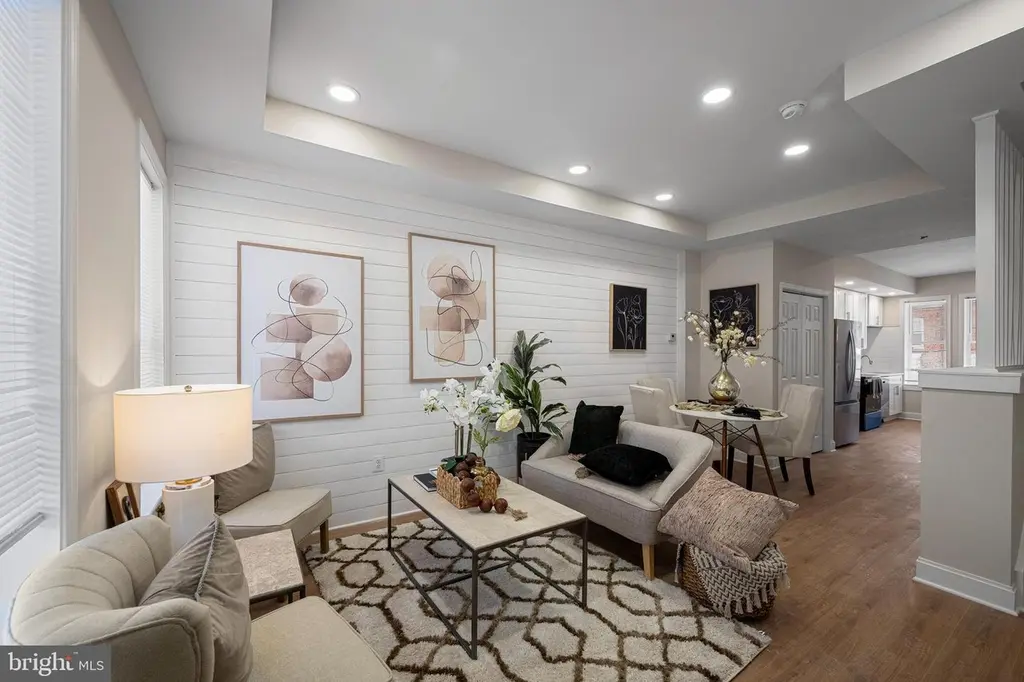
Check buyer eligibility requirements in the disclosures. Welcome to 2323 Sidney Avenue, Baltimore, MD 21230! This beautifully renovated 2BR, 1.5 BA home offers 1,120 square feet of above-grade finished living space and blends modern updates with everyday comfort in a wonderfully convenient location. Step inside to discover freshly painted interiors and an abundance of natural light that fills the home, creating a warm and inviting atmosphere throughout. The main living areas flow seamlessly, making the space perfect for both relaxing evenings and entertaining guests. The heart of the home features a modern kitchen equipped with stainless steel appliances, offering both style and functionality for daily living and hosting. Downstairs, the partially finished lower level is a perfect bonus space which can serve as a den, guest suite, office space, or a workout area. Situated close to schools, shopping, dining, and popular Baltimore destinations, this home also offers convenient access to major highways, making commuting and city living a breeze. With its new renovations, thoughtful updates, and prime location, 2323 Sidney Avenue is move-in ready and perfectly suited for buyers looking for comfort, convenience, and value. Don’t miss the opportunity to make this stunning home your own.
Key facts
- Renovated
- Convenient access
- Bonus space
Tags
Neighborhood map
What this means for you Summary
Snapshot
- This is a 2-bed/1.0-bath townhouse listed at $140k.
Deal economics
- At list price, monthly cash flow is $790 ($9k/yr) — positive.
- The deal already cash-flows at list — no discount required.
- Meets the 1% rule at list price ($2k rent vs $140k).
- Recommended offer: $123k (12.0% below list) — sets the bar for market timing.
- Cap rate 13.1% vs local median 6.0% in Baltimore — top-decile yield for the area; either an underpriced asset or a hidden risk that comps aren't pricing in. Stress-test before assuming the spread holds.
Location & tenants
- Location reads 76/100 on livability (#90 in MD, #3,396 nationally) — a middle-class / working-renter tenant base. Strengths: amenities A+, commute A+, housing A+; Watch: schools D, crime F.
- Baltimore City Public Schools (urban): math 7% / reading 16% proficiency, ranked #24 of 24 in MD (top 100%) — low school quality limits family demand, transient renter base, plan for 1-2y turnover; 79% free/reduced lunch — lower-income household profile, screen leases tightly.
- Market conditions: Rents soft (-1.0%/yr); 362 active listings in the ZIP; 40 comparable units currently listed for rent nearby; rentals at typical pace (median 22d on market — plan ~3-4 weeks tenant-placement turnaround); solid renter incomes; 1,273 units permitted in Baltimore city in 2024 (1,104 in 5+ unit buildings).
Forward outlook
- Local home prices are declining (-3.0%/yr); year-one equity from $968 of loan paydown is wiped out by about $4k of value loss. Plan a longer hold.
- Baltimore County population projected to shrink 4% by 2050 — rents likely to lag national; underwrite the cash flow, not the appreciation.
- At projected returns (-3.0% appreciation + 0.0% rent growth), your $39k cash investment doubles in ~6 years — after that, you're playing with house money.
Negotiation context
- It's been on market 139 days — a 12% lower offer ($123k) is reasonable based on typical stale-listing flexibility.
- 4 sale attempts since 16y ago with the ask held roughly flat each time — persistent listings suggest the price (not the market) is what's stuck; bring a comps-based counter.
- Current owner paid $50k; list at $140k implies a 180% gain — meaningful room to come down on a strong offer.
Risks & watch-outs
- Watch-outs: built in 1920 — expect roof / HVAC / electrical / plumbing capex.
- Climate carrying-cost: major wind risk, 27% chance of damaging wind over 30y; extreme-heat days projected 7→15/yr by 2055 (HVAC capex compounding) — expect insurance premiums to compound above CPI over the hold.
Questions for the listing agent
- It's been on market 139 days. Have you received any prior offers? Is the seller open to a 12% concession, seller financing, or rate buy-down credit?
- Built in 1920 — when were the roof, HVAC, electrical panel, plumbing, and water heater last replaced?
- Why hasn't it sold? Are there any deal-killer items the seller is aware of (foundation, flood, title, zoning, code violations)?
- Is there a deadline driving the sale (1031 exchange, divorce, estate, relocation)? That informs how much negotiation room exists.
- Schools are D-rated, which usually means shorter tenancies and higher turnover. Who's the typical renter profile here, and what's been the actual vacancy rate?
- Crime grade is F in this area — have there been break-ins, vandalism, or insurance claims at this property in the last 3 years? What carrier currently insures it and at what premium?
- What's the average days-on-market for RENTAL listings here right now (not sales)? A rising rental-DOM trend means longer vacancies and softer asking-rent achievability than the comps imply.
- What's the recent tenant-quality profile in this submarket — average credit score on applications, eviction rate, late-payment / NSF rate, and stable-employment percentage? A property-management company in the area should have these aggregated.
- How much new for-sale + rental construction is in the pipeline within 1–3 miles? Heavy new supply typically softens prices + rents 12–24 months out; constrained supply supports both.
Investment metrics
- 1% rule
- 1.54% ✓
- Cap rate
- 13.06%
- Cash-on-cash
- 24.18%
- DSCR
- 2.08
- GRM
- 5.4
CMA / ARV
- ARV (median comp)
- $63,620
- List price
- $140,000
- Delta
- 120.06%
- Verdict
- OVERPRICED
- Comps
- 20 within 1.0 mi
Show comp detail 12 sales within ~0.75 mi
| Address | Dist | Beds/Ba | Sqft | Sold | Price | $/sf | Match |
|---|---|---|---|---|---|---|---|
| 2318 Sidney Ave | 0.03mi | 3/1.0 (+1) | 1,120 (0%) | 2mo | $72,500 | $65 | 92 |
| 2316 Cedley St | 0.02mi | 3/2.0 (+1) | 1,144 (+2%) | 4mo | $140,000 | $122 | 83 |
| 2405 Westport St | 0.17mi | 2/2.0 | 1,200 (+7%) | 0mo | $75,000 | $63 | 76 |
| 2113 Sidney Ave | 0.17mi | 3/1.0 (+1) | 1,260 (+12%) | 2mo | $72,500 | $58 | 65 |
| 2521 S Paca St | 0.65mi | 3/1.5 (+1) | 1,152 (+3%) | 1mo | $30,000 | $26 | 57 |
| 2630 Alaska St | 0.32mi | 3/1.5 (+1) | 1,008 (-10%) | 7mo | $85,000 | $84 | 55 |
| 2625 Waterview Ave | 0.35mi | 3/1.0 (+1) | 1,260 (+12%) | 6mo | $94,200 | $75 | 53 |
| 2619 Northshire Dr | 0.65mi | 3/1.0 (+1) | 1,024 (-9%) | 2mo | $145,000 | $142 | 48 |
| 2628 Northshire Dr | 0.66mi | 3/1.0 (+1) | 1,024 (-9%) | 4mo | $175,000 | $171 | 47 |
| 2639 Northshire Dr | 0.64mi | 3/2.0 (+1) | 1,024 (-9%) | 5mo | $120,000 | $117 | 43 |
| 2620 Northshire Dr | 0.67mi | 3/1.0 (+1) | 1,024 (-9%) | 8mo | $110,000 | $107 | 43 |
| 2839 Hinsdale Dr | 0.75mi | 3/1.0 (+1) | 1,024 (-9%) | 4mo | $152,000 | $148 | 42 |
Match score weights: distance 35% · size 25% · config 20% · recency 20%. Top-matched comps best support the ARV.
Projected returns pro-forma
-3.0% appreciation · 0.0% rent growth · sell at horizon
- IRR
- 14.1%
- Equity multiple
- 1.54×
- Total profit
- $21,295
- Equity at exit
- $20,874
- IRR
- 20.6%
- Equity multiple
- 2.50×
- Total profit
- $58,897
- Equity at exit
- $12,105
Cash invested: $39,200 (down + closing). Projections, not guarantees.
Landlord ↔ Tenant lean methodology
- Overall (CITY)
- 12 Strongly Tenant-Friendly
- State Maryland
- 27 Tenant-Leaning · D+14
- County
- — inherits STATE
- City Baltimore
- 12 Strongly Tenant-Friendly · D+58
ZIP-level market 21230
- Rents YoY
- -1.0%
- Active inventory
- 362
- Price-to-rent
- 5.4×
Monthly cashflow live
- Estimated rent
- $2,155 high interval (Pro) →
- Mortgage (P&I)
- −$734
- Tax from tax record
- −$120 /mo · $1,444/yr
- Insurance
- −$58
- HOA
- −$0
- Vacancy / Maint / Mgmt
- −$453
- Net cashflow
- $790
Break-even live
UW: 25.0% down · 7.5% · 30yr · 1.5% tax · 5.0% vac · 8.0% maint · 8.0% mgmt
Financing live
Cash to close
- Down payment
- $35,000
- Closing costs
- $4,200
- Reserves months
- —
- Total cash needed
- —
Loan-product check · same deal, 3 products live
Conventional
25% down · 7.5% · 30yr
- Down + closing
- —
- Monthly P&I
- —
- Monthly cashflow
- —
- DSCR
- —
- Eligible?
- —
Personal DTI + credit; lowest rate.
DSCR
20% down · 8.5% · 30yr
- Down + closing
- —
- Monthly P&I
- —
- Monthly cashflow
- —
- DSCR
- —
- Eligible?
- —
No personal income docs; deal must DSCR.
Hard money
10% down · 12.0% · 12mo
- Down + closing
- —
- Monthly P&I
- —
- Monthly cashflow
- —
- DSCR
- —
- Eligible?
- —
Short-term bridge; refi at stabilization.
Rent comps 40 comps
| Address | Beds | Baths | Sqft | Rent | $/sqft | DOM | Units | Dist |
|---|---|---|---|---|---|---|---|---|
| 2454 Terra Firma Rd Brooklyn, MD | 3.0 | 1.0 | 1024 | $1,650 | $1.61 | 14d | 1 | 0.83mi |
| 607 Cheraton Rd Brooklyn, MD | 3.0 | 3.0 | 1200 | $1,750 | $1.46 | 14d | 1 | 0.88mi |
| 2056 Griffis Ave Baltimore, MD | 3.0 | 1.5 | 1230 | $1,495 | $1.22 | 21d | 1 | 0.89mi |
| 1931 Griffis Ave Baltimore, MD | 2.0 | 1.0 | 912 | $1,349 | $1.48 | 4d | 1 | 1.00mi |
| 2200 W Patapsco Ave Baltimore, MD | 3.0 | 1.0 | 890 | $1,569 | $1.76 | 43d | 1 | 1.01mi |
| 2868 Potee St Baltimore, MD | 1.0–3.0 | 1.0 | 720 | $1,392 | $1.93 | 2d | 22 | 1.03mi |
| 2745 Round Rd Brooklyn, MD | 2.0 | 2.0 | 756 | $1,800 | $2.38 | 43d | 1 | 1.03mi |
| 1900 S Hanover St Baltimore, MD | 3.0 | 1.0–2.0 | 875 | $3,119 | $3.56 | 1d | 66 | 1.05mi |
| 2429 Washington Blvd Baltimore, MD | 1.0 | 1.0 | 940 | $600 | $0.64 | 23d | 1 | 1.05mi |
| 111 W Heath St Baltimore, MD | 2.0 | 1.0–2.5 | 1263 | $2,850 | $2.26 | 3d | 7 | 1.05mi |
| 2500 Insulator Dr Baltimore, MD | 3.0 | 1.0–2.0 | 988 | $3,816 | $3.86 | 2d | 152 | 1.05mi |
| 3004 Elizabeth Ave Unit 1 Baltimore, MD | 3.0 | 1.0 | 1024 | $1,395 | $1.36 | 4d | 1 | 1.08mi |
| 1746 S Hanover St Baltimore, MD | 3.0 | 2.0 | 1490 | $2,700 | $1.81 | 10d | 1 | 1.09mi |
| 1718 S Hanover St Baltimore, MD | 2.0 | 2.5 | 1296 | $2,700 | $2.08 | 23d | 1 | 1.10mi |
| 3017 Janice Ave Baltimore, MD | 3.0 | 1.0 | 1024 | $1,995 | $1.95 | 23d | 1 | 1.11mi |
| 1839 S Charles St Baltimore, MD | 3.0 | 2.5 | 1238 | $2,600 | $2.10 | 43d | 1 | 1.14mi |
| 1516 Clarkson St Baltimore, MD | 2.0 | 1.5 | 1050 | $1,795 | $1.71 | 23d | 1 | 1.14mi |
| 1432 Carroll St Baltimore, MD | 2.0 | 1.5 | 912 | $1,900 | $2.08 | 43d | 1 | 1.14mi |
| 1608 S Hanover St Baltimore, MD | 3.0 | 3.5 | 1346 | $3,000 | $2.23 | 17d | 1 | 1.14mi |
| 1815 S Charles St Baltimore, MD | 2.0 | 2.0 | 1208 | $2,100 | $1.74 | 43d | 1 | 1.15mi |
| 1601 S Hanover St Apt 1R Baltimore, MD | 2.0 | 1.0 | 900 | $1,600 | $1.78 | 2d | 1 | 1.17mi |
| 1403 Race St Baltimore, MD | 3.0 | 3.0 | 1008 | $2,200 | $2.18 | 43d | 1 | 1.17mi |
| 1942 Light St Baltimore, MD | 2.0 | 2.5 | 1150 | $2,200 | $1.91 | 21d | 1 | 1.17mi |
| 2600 W Patapsco Ave Baltimore, MD | 1.0–2.0 | 1.0 | 856 | $1,309 | $1.53 | 2d | 24 | 1.18mi |
| 1631 S Charles St Baltimore, MD | 2.0 | 3.0 | 1460 | $2,607 | $1.79 | 4d | 1 | 1.19mi |
| 126 Burnett St Baltimore, MD | 2.0 | 2.5 | 984 | $2,200 | $2.24 | 23d | 1 | 1.21mi |
| 1125 Wicomico St Baltimore, MD | 3.0 | 3.0 | 1068 | $1,955 | $1.83 | 23d | 1 | 1.22mi |
| 1108 Sterrett St Baltimore, MD | 2.0 | 1.0 | 1400 | $2,300 | $1.64 | 23d | 1 | 1.22mi |
| 8 E Randall St Baltimore, MD | 2.0 | 2.5 | 1148 | $2,600 | $2.26 | 4d | 1 | 1.24mi |
| 1710 Marshall St Baltimore, MD | 2.0 | 1.0 | 1110 | $2,500 | $2.25 | 43d | 1 | 1.24mi |
| 1205 Cleveland St Baltimore, MD | 2.0 | 2.0 | 1232 | $1,900 | $1.54 | 43d | 1 | 1.25mi |
| 1503 S Charles St Unit 2 Baltimore, MD | 2.0 | 2.0 | 1100 | $2,375 | $2.16 | 43d | 1 | 1.26mi |
| 49 E Heath St Baltimore, MD | 2.0 | 1.5 | 858 | $1,800 | $2.10 | 11d | 1 | 1.26mi |
| 1312 S Hanover St Apt 3 Baltimore, MD | 2.0 | 1.0 | 750 | $2,200 | $2.93 | 43d | 1 | 1.26mi |
| 511 Seagull Ave Brooklyn, MD | 2.0 | 1.0 | 756 | $1,550 | $2.05 | 23d | 1 | 1.26mi |
| 1807 Westphal Pl Baltimore, MD | 2.0 | 2.5 | 1378 | $2,500 | $1.81 | 4d | 1 | 1.27mi |
| 130 Reedbird Ave Brooklyn, MD | 2.0 | 1.0 | 1152 | $1,700 | $1.48 | 23d | 1 | 1.27mi |
| 1702 Light St Unit 302 Baltimore, MD | 2.0 | 2.0 | 735 | $2,300 | $3.13 | 17d | 1 | 1.28mi |
| 101 W Cross St Baltimore, MD | 2.0 | 1.0–2.0 | 937 | $3,332 | $3.55 | 1d | 23 | 1.30mi |
| 1259 Washington Blvd Baltimore, MD | 3.0 | 3.0 | 1232 | $2,999 | $2.43 | 4d | 1 | 1.30mi |
Listing history 25 events
-
2026-06-18days on market $140,000 Active 139 DOM
-
2026-06-17days on market $140,000 Active 138 DOM
-
2026-06-16days on market $140,000 Active 137 DOM
-
2026-06-15days on market $140,000 Active 136 DOM
-
2026-06-13days on market $140,000 Active 134 DOM
-
2026-06-09days on market $140,000 Active 130 DOM
-
2026-06-08days on market $140,000 Active 129 DOM
-
2026-06-07days on market $140,000 Active 128 DOM
-
2026-06-04days on market $140,000 Active 125 DOM
-
2026-06-03days on market $140,000 Active 124 DOM
-
2026-06-02days on market $140,000 Active 123 DOM
-
2026-06-01days on market $140,000 Active 122 DOM
-
2026-05-31days on market $140,000 Active 121 DOM
-
2026-01-30$140,000 Active 1308-char remark
Show marketing remark (1308 chars)
Check buyer eligibility requirements in the disclosures. Welcome to 2323 Sidney Avenue, Baltimore, MD 21230! This beautifully renovated 2BR, 1.5 BA home offers 1,120 square feet of above-grade finished living space and blends modern updates with everyday comfort in a wonderfully convenient location. Step inside to discover freshly painted interiors and an abundance of natural light that fills the home, creating a warm and inviting atmosphere throughout. The main living areas flow seamlessly, making the space perfect for both relaxing evenings and entertaining guests. The heart of the home features a modern kitchen equipped with stainless steel appliances, offering both style and functionality for daily living and hosting. Downstairs, the partially finished lower level is a perfect bonus space which can serve as a den, guest suite, office space, or a workout area. Situated close to schools, shopping, dining, and popular Baltimore destinations, this home also offers convenient access to major highways, making commuting and city living a breeze. With its new renovations, thoughtful updates, and prime location, 2323 Sidney Avenue is move-in ready and perfectly suited for buyers looking for comfort, convenience, and value. Don’t miss the opportunity to make this stunning home your own.
-
2024-09-19soldstatus $50,000
-
2016-11-15soldstatus $44,000 134-char remark
Show marketing remark (134 chars)
Here is a great opportunity to get in the ground floor on an up and coming area. 2326 Sidney and 2235 Annapolis rd are also available.
-
2016-11-15soldstatus $44,000 Sold
Show marketing remark (134 chars)
Here is a great opportunity to get in the ground floor on an up and coming area. 2326 Sidney and 2235 Annapolis rd are also available.
-
2016-09-08status Contract
-
2016-06-28$49,900 Active
-
2010-08-19historical
-
2010-08-19historical
-
2010-02-03Active
-
2010-02-03$78,500
-
2005-09-21soldstatus $52,000
-
2004-06-23soldstatus $53,000
ⓘ Source: listings_history table (triggers on properties + properties_extension) + one-shot
backfill from property_details.listing_events for pre-trigger history.
Tax reassessment forecast MD · Partial reset (capped growth)
- Current annual tax
- $1,444 · $120/mo
- Projected year-2 tax
- $1,485 · $124/mo
- Expected delta
- +$41/yr (+$3/mo · 2.8%)
ⓘ Screening estimate from a state-policy table — verify with the county assessor before closing.
Climate risk First Street
- Flood 1/10 Low FEMA zone X (unshaded) · 0% chance over 30 yrs
- Wildfire 1/10 Low
- Heat 8/10 Severe 7 d/yr ≥102°F today · 15 d/yr by 30 yrs out
- Wind 6/10 Major 27% chance of damaging wind over 30 yrs
- Air quality 4/10 Moderate 6 unhealthy d/yr today · 7 by 30 yrs out
Nearby sold comps map
Loading sold comps map…
Walkable amenities ~0.75 mi
Loading nearby amenities…
Taxation est. · year 1
- Rental income
- $25,861
- − Mortgage interest
- −$7,842
- − Property taxes
- −$1,444
- − Insurance
- −$700
- − Repairs & maintenance
- −$2,069
- − Management
- −$2,069
- − Depreciation
- −$4,073
- Taxable income
- $7,665
- Est. tax owed @ 24.0%
- −$1,840
- After-tax cash flow
- $7,637/yr
For passive investors: Depreciation is non-cash, so a rental often shows a tax loss while cash-flowing — sheltering income. Rental losses are passive: they offset passive income freely, and up to $25,000/yr can offset ordinary (W-2) income if you actively participate and your MAGI is under $100k (phasing out to $0 by $150k); unused losses carry forward. On sale, claimed depreciation is recaptured at up to 25%, and gains may owe capital-gains tax (a 1031 exchange can defer both). Figures are a year-1 estimate at your 24.0% rate — not tax advice; consult a CPA.
Schools (NCES district)
- District
- Baltimore City Public Schools
- NCES district ID
- 2400090
- Math proficiency
- 7% ▼ -9.00%
- Reading proficiency
- 16% ▼ -5.00%
- Median HH income
- $42,108
- Composite
- 10.08/100
- National rank
- #9805
- State rank
- #24 of 24 in MD
Livability — Baltimore
- Score
- 76/100
- State rank
- #90
- US rank
- #3396
Category grades
Schools grade is shown separately in the Schools card above.
Census & demographics
- Census place
- Baltimore, MD
- County
- Baltimore City · 558,601 people
- City population
- 588,727
- Metro
- Baltimore-Columbia-Towson, MD
- Population (ZIP)
- 32,977
- Household income
- $91,842
- Rent vs Own
- Severe rent burden
- 1463.0
Population outlook (Baltimore County) Hauer SSP2
- Today (2025)
- 624,249 people
- By 2030
- 621,541 · -0.4%
- By 2040
- 609,756 · -2.3%
- By 2050
- 597,249 · -4.3%
- By 2075
- 552,236 · -11.5%
- By 2100
- 513,934 · -17.7%
Race, ethnicity, and origin ACS 2023
- Neighborhood character
- Diverse neighborhood (Simpson 0.63)
- Race & ethnicity
- White 55% Black 23% Hispanic / Latino 13% Two or more races 6% Asian 4%
- Hispanic origin (detail)
- Mexican 1% Puerto Rican 1%
- Common ancestry
- Romanian 5% Lithuanian 2% Italian 2%
- Foreign-born
- 10% · Canada, China
- Languages at home
- 85% English-only · Spanish 9% Other Indo-European 1% Other Asian/Pacific 1%
Political lean MEDSL · Baltimore
- 2024 margin
- Solid D (+73.0) · D 85.2% · R 12.2% · Other 2.6%
- 2008→2024 swing
- -2.5pp toward R · 2008: 75.5pp · 2024: 73.0pp
- All cycles
- 2024: D+73.0 2020: D+76.6 2016: D+74.6 2012: D+76.4 2008: D+75.5
Not yet ingested
- Civics
- —
Market trends
- HPI YoY
- ▼ -311.43%
- Current HPI
- 284.338
- Rent YoY
- ▼ -1.00%
- Metro
- Baltimore-Columbia-Towson, MD
- State GDP YoY
- ▲ 2.97%
- F500 in state
- 12
Industry mix (Fortune 500 HQ in MD)
| Industry | F500 HQs | Revenue |
|---|---|---|
| Aerospace / Defense | 1 | $71B |
|
||
| Utilities | 1 | $25B |
|
||
| Hotels | 1 | $24B |
|
||
| Consumer Goods | 1 | $7B |
|
||
| Real Estate | 1 | $6B |
|
||
| Chemicals | 1 | $2B |
|
||
Price history
+164.2% since first listed12 events — show timeline
- 2026-01-30 Listed $140,000 BRIGHT MLS
- 2024-09-19 Sold (Public Records) $50,000 Public Records
- 2016-11-15 Sold (MLS) $44,000 MRIS
- 2016-11-15 Sold (MLS) $44,000 BRIGHT MLS
- 2016-09-08 Pending — MRIS
- 2016-06-28 Listed $49,900 MRIS
- 2010-08-19 Delisted — MRIS
- 2010-08-19 Listing Removed — BRIGHT MLS
- 2010-02-03 Listed — MRIS
- 2010-02-03 Listed $78,500 BRIGHT MLS
- 2005-09-21 Sold (Public Records) $52,000 Public Records
- 2004-06-23 Sold (Public Records) $53,000 Public Records
Property tax history
+2.8%/yrLatest (2025): $1,444 · +16.6% YoY. Source: county tax records.
Cash-flow waterfall
monthlySold comps — $/sqft
last 12 mo · ≤1 miLoading sold comps…