31612 Angel Aura Dr · French Valley, CA
Flood risk No data
- FEMA flood zone
- —
- Chance of flooding over 30 yrs
- —
- Est. flood insurance / yr
- —
Fire risk No data
- Est. fire insurance / yr
- —
Heat risk No data
- Hot days now (above threshold)
- —
- Hot days in 30 yrs
- —
Wind risk No data
- Chance of severe wind over 30 yrs
- —
Air-quality risk No data
- Unhealthy air days now
- —
- Unhealthy air days in 30 yrs
- —
Risk factors via First Street. Map © Google.
Why this score? — see what drove the D- grade
The composite is a weighted blend of 9 inputs, each scored 0–100. Each bar is that input's sub-score; the figure is the points it added to the 100-point composite (weight × sub-score).
- Appreciation +10.0/10.0
- ARV discount +7.5/15.0
- Schools +5.3/10.0
- Cash flow +4.2/30.0
- Livability +3.0/5.0
- Condition / age +2.5/5.0
- Rent growth +2.3/5.0
- 1% rule +1.2/10.0
- DSCR +0.0/10.0
$544,390
🖨 Deal sheet (PDF) 📄 Offer letter ✓ Due diligence
Listing remarks
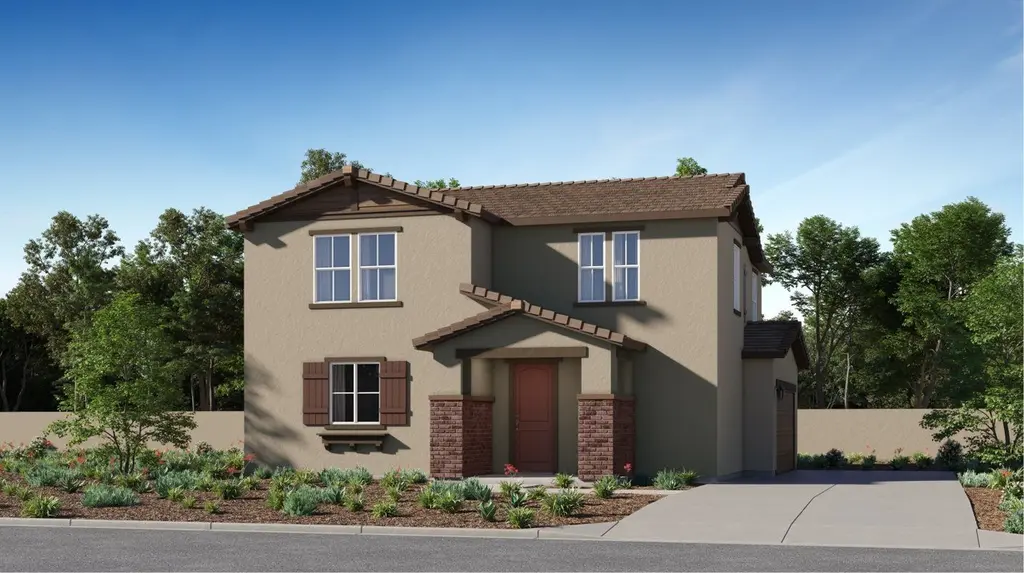
This new two-story home is ready for modern lifestyles, complete with an inviting open-concept floorplan on the first level consisting of the kitchen, living and dining areas. A patio provides a space for outdoor leisure. Three bedrooms make up the second floor, including the owner's suite with an en-suite bathroom and walk-in closet.
Key facts
- Walk-in closet
- En-suite bathroom
- Owner's suite
Tags
Neighborhood map
What this means for you Summary
Snapshot
- This is a 3-bed/2.5-bath condo listed at $544k.
Deal economics
- At list price, monthly cash flow is $-1k ($-18k/yr) — negative.
- To cash-flow at today's rent, offer at most $386k (29.1% below list).
- To meet the 1% rule (rent ≥ 1% of price), the offer needs to be $338k (38.0% below list).
- Recommended offer: $338k (38.0% below list) — sets the bar for 1% rule.
Location & tenants
- Location reads 59/100 on livability (#655 in CA) — a working-class tenant base; expect higher turnover. Strengths: employment A+, housing A+; Watch: crime D-, amenities F, commute F.
- Murrieta Valley Unified (suburban): math 51% / reading 64% proficiency, ranked #255 of 1,400 in CA (top 18%) — acceptable for families but not a draw, mixed tenant base, ~2y average lease.
- Zoned schools: Lisa J. Mails Elementary (1,019 students, 37% FRL); Dorothy Mcelhinney Middle (1,396 students, 44% FRL); Vista Murrieta High (3,493 students, 46% FRL) — zoned schools average 42% FRL vs 23% district-wide (19 pts higher); higher-poverty schools than district average — tighter screening recommended.
- Market conditions: Rents soft (-0.8%/yr); 353 active listings in the ZIP; 10 comparable units currently listed for rent nearby; rentals at typical pace (median 20d on market — plan ~3-4 weeks tenant-placement turnaround); high-income renter base; 9,195 units permitted in Riverside County in 2024 (1,512 in 5+ unit buildings).
- This rent runs 31% of the median local income ($133k/yr) — at the standard rent-burdened threshold; future hikes will face affordability resistance.
Forward outlook
- In year one you build about $58k of equity ($4k loan paydown + $54k appreciation (10.0% local appreciation)).
- Riverside County population projected at +22% by 2050 — long-run rental-demand tailwind backs the buy-and-hold thesis.
- By year 2, paydown + projected appreciation supports a ~$94k cash-out refi (75% LTV) — recoverable capital for the next deal without selling this one.
Negotiation context
- It's been on market 20 days — a 2% lower offer ($536k) is reasonable based on typical stale-listing flexibility.
Questions for the listing agent
- What do current leases actually rent for vs. the listed asking? Can we see a recent rent roll and the last 12 months of T-12 income?
- What does the HOA fee cover, when was the last increase, and are there any pending special assessments or reserve-fund shortfalls?
- Any open or pending special assessments — roof, HVAC, plumbing, elevator, façade? What's the per-unit balance and payoff schedule, and is the seller paying it off at close or rolling it to the buyer?
- Is there a deadline driving the sale (1031 exchange, divorce, estate, relocation)? That informs how much negotiation room exists.
- Schools are D-rated, which usually means shorter tenancies and higher turnover. Who's the typical renter profile here, and what's been the actual vacancy rate?
- Crime grade is D in this area — have there been break-ins, vandalism, or insurance claims at this property in the last 3 years? What carrier currently insures it and at what premium?
- The area grade is low — what's the realistic commute time and amenity access for the typical tenant pool here? Any planned neighborhood developments (good or bad) we should know about?
- What's the average days-on-market for RENTAL listings here right now (not sales)? A rising rental-DOM trend means longer vacancies and softer asking-rent achievability than the comps imply.
- What's the recent tenant-quality profile in this submarket — average credit score on applications, eviction rate, late-payment / NSF rate, and stable-employment percentage? A property-management company in the area should have these aggregated.
- How much new apartment / multifamily construction is in the pipeline within 1–3 miles? Heavy new supply (>2% of stock underway) typically softens rents 12–24 months out; light construction supports rent growth.
Investment metrics
- 1% rule
- 0.62% ✗
- Cap rate
- 3.06%
- Cash-on-cash
- -11.56%
- DSCR
- 0.49
- GRM
- 13.4
CMA / ARV
No comps found within radius.
Projected returns pro-forma
10.0% appreciation · 0.0% rent growth · sell at horizon
- IRR
- 15.5%
- Equity multiple
- 2.27×
- Total profit
- $193,368
- Equity at exit
- $490,430
- IRR
- 14.6%
- Equity multiple
- 5.11×
- Total profit
- $625,805
- Equity at exit
- $1,057,630
Cash invested: $152,429 (down + closing). Projections, not guarantees.
Landlord ↔ Tenant lean methodology
- Overall (STATE)
- 18 Strongly Tenant-Friendly
- State California
- 18 Strongly Tenant-Friendly · D+13
- County
- — inherits STATE
- City
- — inherits STATE
ZIP-level market 92596
- Home prices YoY
- 3.9%
- Rents YoY
- -0.8%
- Active inventory
- 353
- Price-to-rent
- 13.4×
Monthly cashflow live
- Estimated rent
- $3,377 high interval (Pro) →
- Mortgage (P&I)
- −$2,855
- Tax est. 1.5%
- −$680 /mo · $8,166/yr
- Insurance
- −$227
- HOA est. from 1 same-building comp
- −$374
- Vacancy / Maint / Mgmt
- −$709
- Net cashflow
- $-1,468
Break-even live
Sensitivity live
| Price | -10% $-1,092 | -5% $-1,280 | +0% $-1,468 | +5% $-1,656 | +10% $-1,844 |
|---|---|---|---|---|---|
| Rent | -10% $-1,735 | -5% $-1,602 | +0% $-1,468 | +5% $-1,335 | +10% $-1,201 |
| Rate | -1.0pp $-1,194 | -0.5pp $-1,330 | base $-1,468 | +0.5pp $-1,609 | +1.0pp $-1,753 |
UW: 25.0% down · 7.5% · 30yr · 1.5% tax · 5.0% vac · 8.0% maint · 8.0% mgmt
Financing live
Cash to close
- Down payment
- $136,098
- Closing costs
- $16,332
- Reserves months
- —
- Total cash needed
- —
Loan-product check · same deal, 3 products live
Conventional
25% down · 7.5% · 30yr
- Down + closing
- —
- Monthly P&I
- —
- Monthly cashflow
- —
- DSCR
- —
- Eligible?
- —
Personal DTI + credit; lowest rate.
DSCR
20% down · 8.5% · 30yr
- Down + closing
- —
- Monthly P&I
- —
- Monthly cashflow
- —
- DSCR
- —
- Eligible?
- —
No personal income docs; deal must DSCR.
Hard money
10% down · 12.0% · 12mo
- Down + closing
- —
- Monthly P&I
- —
- Monthly cashflow
- —
- DSCR
- —
- Eligible?
- —
Short-term bridge; refi at stabilization.
Rent comps 10 comps
| Address | Beds | Baths | Sqft | Rent | $/sqft | DOM | Units | Dist |
|---|---|---|---|---|---|---|---|---|
| 31629 Angel Aura Dr Winchester, CA | 3.0 | 3.0 | 1711 | $3,099 | $1.81 | 24d | 1 | 0.03mi |
| 31647 Angel Aura Dr Winchester, CA | 3.0 | 2.5 | 1711 | $3,195 | $1.87 | 18d | 1 | 0.06mi |
| 35350 Marabella Ct Unit 35350 Winchester, CA | 3.0 | 2.5 | 1925 | $3,300 | $1.71 | 0d | 1 | 0.30mi |
| 34715 Ribbon Grass Way Murrieta, CA | 4.0 | 3.0 | 2319 | $3,800 | $1.64 | 0d | 1 | 0.74mi |
| 36026 Kiel Ct Winchester, CA | 4.0 | 2.5 | 2366 | $3,295 | $1.39 | 0d | 1 | 0.95mi |
| 34495 Agave Dr Bldg 24 Winchester, CA | 3.0 | 2.5 | 1400 | $2,645 | $1.89 | 26d | 1 | 0.96mi |
| 34495 Agave Dr #20106 Winchester, CA | 3.0 | 2.5 | 1400 | $3,050 | $2.18 | 20d | 1 | 0.96mi |
| 34495 Agave Dr #1105 Winchester, CA | 3.0 | 2.5 | 1399 | $3,250 | $2.32 | 12d | 1 | 0.96mi |
| 36264 Capri Dr Winchester, CA | 4.0 | 2.5 | 1999 | $3,300 | $1.65 | 20d | 1 | 1.17mi |
| 36308 Cosimo Ln Winchester, CA | 3.0 | 2.5 | 1550 | $2,695 | $1.74 | 22d | 1 | 1.25mi |
HOA detail condo
- Monthly dues
- $0 · $0/yr
- Assessments
- None detected in remarks — confirm with the listing agent.
Listing history 4 events
-
2026-06-02days on market $544,390 Active 20 DOM
-
2026-06-01days on market $544,390 Active 19 DOM
-
2026-05-31days on market $544,390 Active 18 DOM
-
2026-05-13$544,390 Active 336-char remark
ⓘ Source: listings_history table (triggers on properties + properties_extension) + one-shot
backfill from property_details.listing_events for pre-trigger history.
Nearby sold comps map
Loading sold comps map…
Walkable amenities ~0.75 mi
Loading nearby amenities…
Taxation est. · year 1
- Rental income
- $40,527
- − Mortgage interest
- −$30,494
- − Property taxes
- −$8,166
- − Insurance
- −$2,722
- − Repairs & maintenance
- −$3,242
- − Management
- −$3,242
- − HOA
- −$4,488
- − Depreciation
- −$15,837
- Taxable loss
- −$27,664
- Est. tax savings @ 24.0%
- +$6,639
- After-tax cash flow
- $-10,978/yr
For passive investors: Depreciation is non-cash, so a rental often shows a tax loss while cash-flowing — sheltering income. Rental losses are passive: they offset passive income freely, and up to $25,000/yr can offset ordinary (W-2) income if you actively participate and your MAGI is under $100k (phasing out to $0 by $150k); unused losses carry forward. On sale, claimed depreciation is recaptured at up to 25%, and gains may owe capital-gains tax (a 1031 exchange can defer both). Figures are a year-1 estimate at your 24.0% rate — not tax advice; consult a CPA.
Schools (NCES district)
- District
- Murrieta Valley Unified
- NCES district ID
- 0600029
- Math proficiency
- 51% ▲ 3.00%
- Reading proficiency
- 64% ▲ 4.00%
- Median HH income
- $78,615
- Composite
- 53.42/100
- National rank
- #3152
- State rank
- #255 of 1400 in CA
Livability — French Valley
- Score
- 59/100
- State rank
- #655
- US rank
- #20351
Category grades
Schools grade is shown separately in the Schools card above.
Census & demographics
- Census place
- French Valley, CA
- County
- Riverside County · 2,287,001 people
- Metro
- Riverside-San Bernardino-Ontario, CA
- Population (ZIP)
- 38,981
- Household income
- $132,538
- Rent vs Own
- Severe rent burden
- 591.0
Population outlook (Riverside County) Hauer SSP2
- Today (2025)
- 2,664,475 people
- By 2030
- 2,802,692 · +5.2%
- By 2040
- 3,050,904 · +14.5%
- By 2050
- 3,256,783 · +22.2%
- By 2075
- 3,655,058 · +37.2%
- By 2100
- 3,766,594 · +41.4%
Race, ethnicity, and origin ACS 2023
- Neighborhood character
- Highly diverse neighborhood (Simpson 0.72)
- Race & ethnicity
- White 38% Hispanic / Latino 34% Two or more races 16% Asian 12% Black 6% Pacific Islander 2%
- Hispanic origin (detail)
- Mexican 29%
- Common ancestry
- Slovak 3% Italian 2% Portuguese 1%
- Foreign-born
- 14% · Canada, Vietnam
- Languages at home
- 76% English-only · Spanish 16% Tagalog/Filipino 4% Vietnamese 1%
Political lean MEDSL · Riverside
- 2024 margin
- Toss-up / Even · D 48.0% · R 49.3% · Other 2.6%
- 2008→2024 swing
- -3.6pp toward R · 2008: 2.3pp · 2024: -1.3pp
- All cycles
- 2024: R+1.3 2020: D+8.0 2016: D+4.3 2012: R+0.4 2008: D+2.3
Not yet ingested
- Civics
- —
Market trends
- HPI YoY
- ▲ 12.43%
- Current HPI
- 332.169
- Rent YoY
- ▼ -0.79%
- Metro
- Riverside-San Bernardino-Ontario, CA
- State GDP YoY
- ▲ 3.21%
- F500 in state
- 116
Industry mix (Fortune 500 HQ in CA)
| Industry | F500 HQs | Revenue |
|---|---|---|
| Technology | 27 | $1,492B |
|
||
| Financial Services | 3 | $174B |
|
||
| Retail | 3 | $44B |
|
||
| Insurance | 3 | $26B |
|
||
| Media / Entertainment | 2 | $115B |
|
||
| Pharmaceuticals / Biotech | 2 | $62B |
|
||
Cash-flow waterfall
monthlySold comps — $/sqft
last 12 mo · ≤1 miLoading sold comps…