919 N Grant Ave · Booneville, AR
Flood risk 1/10 · Minimal
- FEMA flood zone
- X (unshaded)
- Chance of flooding over 30 yrs
- 0.0%
- Est. flood insurance / yr
- $507 – $1,088
Fire risk 7/10 · Major
- Est. fire insurance / yr
- $1,499 – $2,785
Heat risk 6/10 · Moderate
- Hot days now (above 114°F)
- 7 days/yr
- Hot days in 30 yrs
- 20 days/yr
Wind risk 2/10 · Minimal
- Chance of severe wind over 30 yrs
- 2.0%
Air-quality risk 2/10 · Minimal
- Unhealthy air days now
- 0 days/yr
- Unhealthy air days in 30 yrs
- 1 days/yr
Risk factors via First Street. Map © Google.
Why this score? — see what drove the C+ grade
The composite is a weighted blend of 9 inputs, each scored 0–100. Each bar is that input's sub-score; the figure is the points it added to the 100-point composite (weight × sub-score).
- Cash flow +21.0/30.0
- ARV discount +15.0/15.0
- DSCR +6.7/10.0
- 1% rule +4.4/10.0
- Livability +3.6/5.0
- Schools +2.7/10.0
- Appreciation +2.6/10.0
- Rent growth +2.5/5.0
- Condition / age +2.5/5.0
$139,000
🖨 Deal sheet 📄 Offer letter ✓ Due diligence
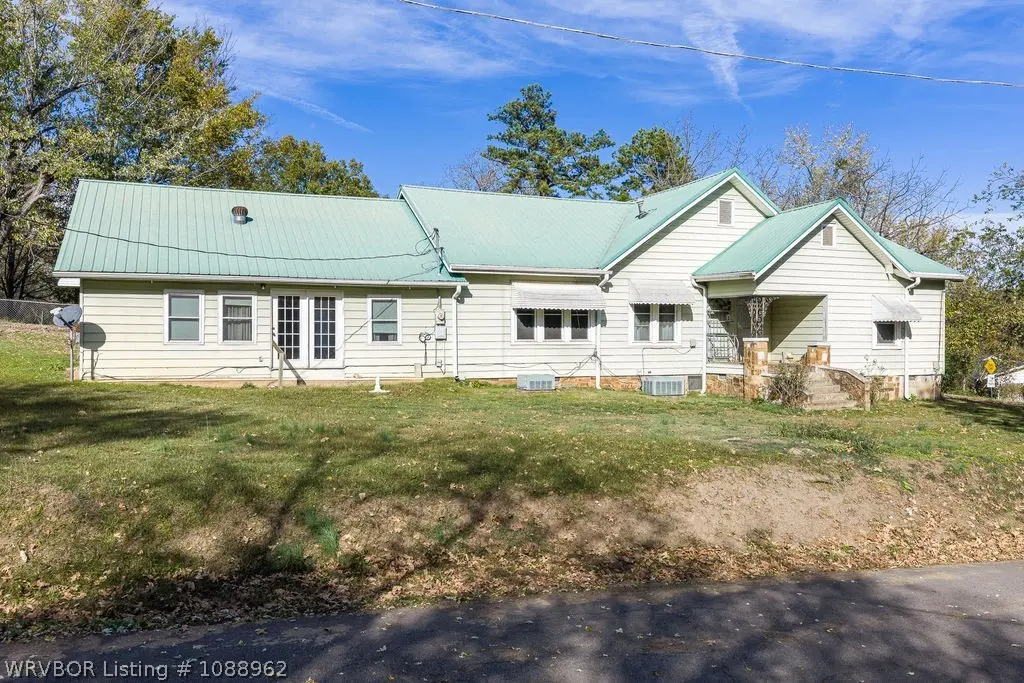
Listing remarks
Originally built in the 1920s and expanded in 1990, 919 N. Grant offers an opportunity to create your own space and write a new chapter for this historic home's next 100 years. The original portion of the home includes three bedrooms, two bathrooms, kitchen, dining, and formal living. Several stylistic details from the glory days still remain and provide an excellent starting point to revitalize the space. The 1990 addition includes a second living area, upstairs and downstairs bedroom, and third bath. It's an exceptionally versatile layout to accommodate guests or multi-generational living arrangements. Outside, the exterior is protected by metal siding and a metal roof to preserve the hom
Key facts
- 0.45 acre lot
- Garage
- Listed 40 days
Property features AI
Finance
- Other: Property listed as residential single family residence
- HOA & community: Community amenities include golf and park access
Exterior
- Parking: Detached concrete garage; 2 covered parking spaces
- Security: Smoke detectors
- Utilities: Public water; Public sewer; Electricity available; Natural gas available
- Home design: Single family house; Two levels (2 stories)
- Construction: Metal siding; Metal roof
- Exterior features: Front porch; Partial backyard fencing; Corner city lot; Paved road access; Workshop and outbuilding
Interior
- Kitchen: Dishwasher; Plumbed for ice maker
- Bedrooms: Bedrooms located on multiple levels
- Flooring: Carpet; Vinyl
- Bathrooms: 3 full bathrooms
- Heating & cooling: Central heating; Natural gas heating; Electric heating; Central air conditioning; Ceiling fans
- Interior features: Built-in features; Ceiling fans; Eat-in kitchen; Walk-in closets; Blinds; Wood-burning fireplace in family room
- Laundry & utility: Washer hookup; Electric dryer hookup; Gas water heater
Neighborhood map
What this means for you Summary
Snapshot
- This is a 5-bed/3.5-bath single-family listed at $139k.
Deal economics
- At list price, monthly cash flow is $196 ($2k/yr) — positive.
- The deal already cash-flows at list — no discount required.
- To meet the 1% rule (rent ≥ 1% of price), the offer needs to be $130k (6.4% below list).
- Recommended offer: $130k (6.4% below list) — sets the bar for 1% rule.
- Cap rate 8.0% vs local median 3.7% in Booneville — top-decile yield for the area; either an underpriced asset or a hidden risk that comps aren't pricing in. Stress-test before assuming the spread holds.
Location & tenants
- Location reads 72/100 on livability (#34 in AR) — a middle-class / working-renter tenant base. Strengths: cost of living A+, health & safety A+, housing A; Watch: crime D-, amenities F, commute F.
- Booneville School District (town): math 33% / reading 33% proficiency, ranked #133 of 238 in AR (top 56%) — families likely to look elsewhere, expect single-tenant / working-renter base with shorter leases; 62% free/reduced lunch — lower-income household profile, screen leases tightly.
- Zoned schools: Booneville Elementary School (math 39% / reading 32%, grade F, #250 of 454 statewide, top 55%, 766 students, 100% FRL); Booneville Jr High School (math 27% / reading 33%, grade F, #139 of 201 statewide, top 71%, 335 students, 100% FRL); Booneville High School (math 27% / reading 42%, grade F, #92 of 292 statewide, top 37%, 243 students, 100% FRL) — zoned schools average 100% FRL vs 62% district-wide (38 pts higher); higher-poverty schools than district average — tighter screening recommended.
- Market conditions: 79 active listings in the ZIP; 11 units permitted in Logan County in 2024 (0 in 5+ unit buildings).
Forward outlook
- Local home prices are declining (-3.0%/yr); year-one equity from $961 of loan paydown is wiped out by about $4k of value loss. Plan a longer hold.
- Logan County population projected at -13% by 2050 — secular population decline; favor cash flow + early exit over multi-decade hold.
Negotiation context
- It's been on market 40 days — a 3% lower offer ($135k) is reasonable based on typical stale-listing flexibility.
- 2 sale attempts with the ask held roughly flat each time — persistent listings suggest the price (not the market) is what's stuck; bring a comps-based counter.
Risks & watch-outs
- Climate carrying-cost: major wildfire risk; extreme-heat days projected 7→20/yr by 2055 (HVAC capex compounding) — expect insurance premiums to compound above CPI over the hold.
Questions for the listing agent
- It's been on market 40 days. Have you received any prior offers? Is the seller open to a 6% concession, seller financing, or rate buy-down credit?
- Is there a deadline driving the sale (1031 exchange, divorce, estate, relocation)? That informs how much negotiation room exists.
- Schools are D-rated, which usually means shorter tenancies and higher turnover. Who's the typical renter profile here, and what's been the actual vacancy rate?
- Crime grade is D in this area — have there been break-ins, vandalism, or insurance claims at this property in the last 3 years? What carrier currently insures it and at what premium?
- What's the average days-on-market for RENTAL listings here right now (not sales)? A rising rental-DOM trend means longer vacancies and softer asking-rent achievability than the comps imply.
- What's the recent tenant-quality profile in this submarket — average credit score on applications, eviction rate, late-payment / NSF rate, and stable-employment percentage? A property-management company in the area should have these aggregated.
- How much new for-sale + rental construction is in the pipeline within 1–3 miles? Heavy new supply typically softens prices + rents 12–24 months out; constrained supply supports both.
Investment metrics
- 1% rule
- 0.94% ✗
- Cap rate
- 7.99%
- Cash-on-cash
- 6.05%
- DSCR
- 1.27
- GRM
- 8.9
CMA / ARV
- ARV (median comp)
- $232,946
- List price
- $139,000
- Delta
- -40.33%
- Verdict
- UNDERPRICED
- Comps
- 13 within 1.0 mi
Projected returns pro-forma
-3.0% appreciation · 3.0% rent growth · sell at horizon
- IRR
- -7.0%
- Equity multiple
- 0.74×
- Total profit
- $-10,095
- Equity at exit
- $20,725
- IRR
- 2.5%
- Equity multiple
- 1.18×
- Total profit
- $7,048
- Equity at exit
- $12,018
Cash invested: $38,920 (down + closing). Projections, not guarantees.
Landlord ↔ Tenant lean methodology
- Overall (STATE)
- 92 Strongly Landlord-Friendly
- State Arkansas
- 92 Strongly Landlord-Friendly · R+14
- County
- — inherits STATE
- City
- — inherits STATE
ZIP-level market 72927
- Home prices YoY
- -2.1%
- Active inventory
- 79
- Price-to-rent
- 8.9×
Monthly cashflow live
- Estimated rent
- $1,301 medium interval (Pro) →
- Mortgage (P&I)
- −$729
- Tax from tax record
- −$45 /mo · $539/yr
- Insurance
- −$58
- HOA
- −$0
- Vacancy / Maint / Mgmt
- −$273
- Net cashflow
- $196
Break-even live
UW: 25.0% down · 7.5% · 30yr · 1.5% tax · 5.0% vac · 8.0% maint · 8.0% mgmt
Financing live
Cash to close
- Down payment
- $34,750
- Closing costs
- $4,170
- Reserves months
- —
- Total cash needed
- —
Loan-product check · same deal, 3 products live
Conventional
25% down · 7.5% · 30yr
- Down + closing
- —
- Monthly P&I
- —
- Monthly cashflow
- —
- DSCR
- —
- Eligible?
- —
Personal DTI + credit; lowest rate.
DSCR
20% down · 8.5% · 30yr
- Down + closing
- —
- Monthly P&I
- —
- Monthly cashflow
- —
- DSCR
- —
- Eligible?
- —
No personal income docs; deal must DSCR.
Hard money
10% down · 12.0% · 12mo
- Down + closing
- —
- Monthly P&I
- —
- Monthly cashflow
- —
- DSCR
- —
- Eligible?
- —
Short-term bridge; refi at stabilization.
Listing history 18 events
-
2026-06-18status $139,000 Pending 40 DOM
-
2026-06-17days on market $139,000 Active 40 DOM
-
2026-06-16days on market $139,000 Active 39 DOM
-
2026-06-15days on market $139,000 Active 38 DOM
-
2026-06-14days on market $139,000 Active 36 DOM
-
2026-06-12days on market $139,000 Active 35 DOM
-
2026-06-09days on market $139,000 Active 32 DOM
-
2026-06-08days on market $139,000 Active 31 DOM
-
2026-06-07days on market $139,000 Active 30 DOM
-
2026-06-07days on market $139,000 Active 29 DOM
-
2026-06-04days on market $139,000 Active 26 DOM
-
2026-06-02days on market $139,000 Active 25 DOM
-
2026-06-01days on market $139,000 Active 24 DOM
-
2026-05-31days on market $139,000 Active 23 DOM
-
2026-05-31days on market $139,000 Active 22 DOM
-
2026-05-07$139,000 Active 1806-char remark
-
2025-11-24$150,000 Active
-
2025-10-14price $135,000
ⓘ Source: listings_history table (triggers on properties + properties_extension) + one-shot
backfill from property_details.listing_events for pre-trigger history.
Tax reassessment forecast AR · Resets to sale price
- Current annual tax
- $539 · $45/mo
- Projected year-2 tax
- $890 · $74/mo
- Expected delta
- +$350/yr (+$29/mo · 64.9%)
ⓘ Screening estimate from a state-policy table — verify with the county assessor before closing.
Climate risk First Street
- Flood 1/10 Low FEMA zone X (unshaded) · 0% chance over 30 yrs
- Wildfire 7/10 Severe
- Heat 6/10 Major 7 d/yr ≥114°F today · 20 d/yr by 30 yrs out
- Wind 2/10 Low 2% chance of damaging wind over 30 yrs
- Air quality 2/10 Low 0 unhealthy d/yr today · 1 by 30 yrs out
Nearby sold comps map
Loading sold comps map…
Walkable amenities ~0.75 mi
Loading nearby amenities…
Taxation est. · year 1
- Rental income
- $15,613
- − Mortgage interest
- −$7,786
- − Property taxes
- −$539
- − Insurance
- −$695
- − Repairs & maintenance
- −$1,249
- − Management
- −$1,249
- − Depreciation
- −$4,044
- Taxable income
- $51
- Est. tax owed @ 24.0%
- −$12
- After-tax cash flow
- $2,341/yr
For passive investors: Depreciation is non-cash, so a rental often shows a tax loss while cash-flowing — sheltering income. Rental losses are passive: they offset passive income freely, and up to $25,000/yr can offset ordinary (W-2) income if you actively participate and your MAGI is under $100k (phasing out to $0 by $150k); unused losses carry forward. On sale, claimed depreciation is recaptured at up to 25%, and gains may owe capital-gains tax (a 1031 exchange can defer both). Figures are a year-1 estimate at your 24.0% rate — not tax advice; consult a CPA.
Schools (NCES district)
- District
- Booneville School District
- NCES district ID
- 0503450
- Math proficiency
- 33% ▼ -9.00%
- Reading proficiency
- 33% ▼ -7.00%
- Median HH income
- $36,171
- Composite
- 27.37/100
- National rank
- #6977
- State rank
- #133 of 238 in AR
Livability — Booneville
- Score
- 72/100
- State rank
- #34
- US rank
- #6310
Category grades
Schools grade is shown separately in the Schools card above.
Census & demographics
- Census place
- Booneville, AR
- Population (ZIP)
- 8,314
Population outlook (Logan County) Hauer SSP2
- Today (2025)
- 21,046 people
- By 2030
- 20,537 · -2.4%
- By 2040
- 19,443 · -7.6%
- By 2050
- 18,220 · -13.4%
- By 2075
- 16,164 · -23.2%
- By 2100
- 14,858 · -29.4%
Race, ethnicity, and origin ACS 2023
- Neighborhood character
- Predominantly White (87%)
- Race & ethnicity
- White 87% Two or more races 9% Hispanic / Latino 5% Black 3%
- Common ancestry
- Italian 2% Romanian 1% Iranian 1%
- Foreign-born
- 2% · Canada
- Languages at home
- 96% English-only · Spanish 2% German/W. Germanic 1%
Political lean MEDSL · Logan
- 2024 margin
- Solid R (+62.2) · D 17.8% · R 80.0% · Other 2.1%
- 2008→2024 swing
- -23.5pp toward R · 2008: -38.8pp · 2024: -62.2pp
- All cycles
- 2024: R+62.2 2020: R+59.5 2016: R+51.4 2012: R+41.9 2008: R+38.8
Not yet ingested
- Civics
- —
Market trends
- HPI YoY
- ▼ -4.71%
- Current HPI
- 221.23
- Rent YoY
- —
- Metro
- —
- State GDP YoY
- ▲ 3.80%
- F500 in state
- 10
Industry mix (Fortune 500 HQ in AR)
| Industry | F500 HQs | Revenue |
|---|---|---|
| Retail | 1 | $681B |
|
||
| Food / Agriculture | 1 | $53B |
|
||
| Retail / Energy | 1 | $22B |
|
||
| Transportation / Logistics | 1 | $12B |
|
||
| Energy | 1 | $4B |
|
||
Price history
+3.0% since first listed4 events — show timeline
- 2026-06-18 Pending — WRVBOR
- 2026-05-07 Listed $139,000 WRVBOR
- 2025-11-24 Listed $150,000 WRVBOR
- 2025-10-14 Price Changed $135,000 NWARMLS
Property tax history
-0.7%/yrLatest (2025): $539 · -7.8% YoY. Source: county tax records.
Cash-flow waterfall
monthlySold comps — $/sqft
last 12 mo · ≤1 miLoading sold comps…