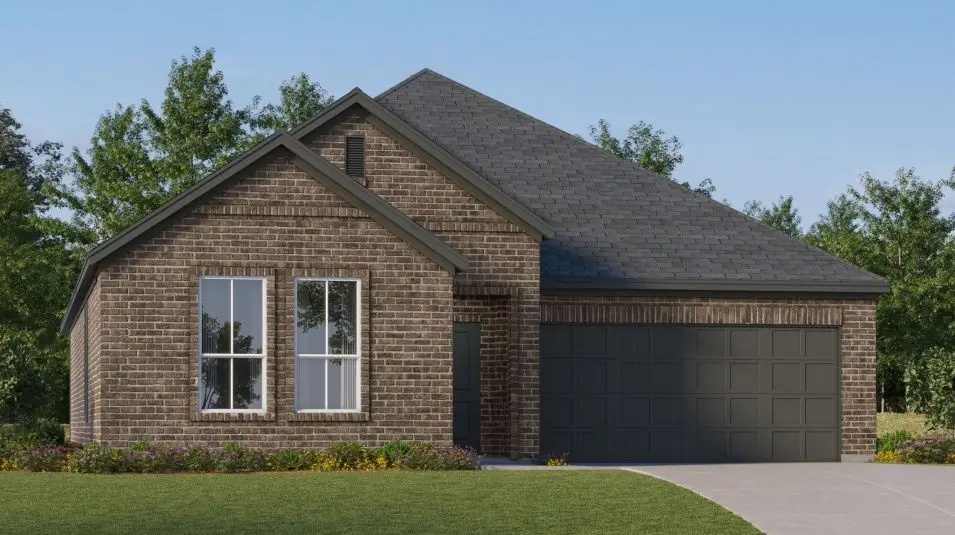
14838 Lovelace St · Pilot Point, TX
Flood risk No data
- FEMA flood zone
- —
- Chance of flooding over 30 yrs
- —
- Est. flood insurance / yr
- —
Fire risk No data
- Est. fire insurance / yr
- —
Heat risk No data
- Hot days now (above threshold)
- —
- Hot days in 30 yrs
- —
Wind risk No data
- Chance of severe wind over 30 yrs
- —
Air-quality risk No data
- Unhealthy air days now
- —
- Unhealthy air days in 30 yrs
- —
Risk factors via First Street. Map © Google.
Why this score? — see what drove the D grade
The composite is a weighted blend of 9 inputs, each scored 0–100. Each bar is that input's sub-score; the figure is the points it added to the 100-point composite (weight × sub-score).
- ARV discount +15.0/15.0
- Cash flow +7.9/30.0
- Schools +5.0/10.0
- Livability +3.3/5.0
- Rent growth +2.5/5.0
- Condition / age +2.5/5.0
- 1% rule +2.4/10.0
- DSCR +2.0/10.0
- Appreciation +0.0/10.0
$324,999
🖨 Deal sheet (PDF) 📄 Offer letter ✓ Due diligence
Listing remarks
This single-story home shares an open layout between the kitchen, nook and family room for easy entertaining, along with access to the covered patio for year-round outdoor lounging. A luxe owner's suite is at the back of the home and comes complete with an en-suite bathroom and walk-in closet, while three secondary bedrooms are near the front of the home, ideal for household members and overnight guests.
Key facts
- Walk-in closet
- Open layout
- Covered patio
Tags
Property features AI
Finance
- Other: Address: 14838 Lovelace St, Pilot Point TX 76258; Status: Active; Last updated: 2026-05-21
- Financial info: List price $324,999
Exterior
- Parking: 2 garage spaces (2 total parking spaces)
- Home design: Single-family home; Spec home (Walsh plan)
- Exterior features: Living area approximately 1902
Interior
- Bedrooms: 4 bedrooms
- Bathrooms: 2 full bathrooms
- Interior features: Spec-built new construction (Walsh plan)
Neighborhood map
What this means for you Summary
Snapshot
- This is a 4-bed/2.0-bath single-family listed at $325k.
Deal economics
- At list price, monthly cash flow is $-348 ($-4k/yr) — negative.
- To cash-flow at today's rent, offer at most $275k (15.5% below list).
- To meet the 1% rule (rent ≥ 1% of price), the offer needs to be $240k (26.1% below list).
- Recommended offer: $240k (26.1% below list) — sets the bar for 1% rule.
- Cap rate 5.0% vs local median 4.0% in Pilot Point — meaningfully above typical; check what's discounted (condition, days-on-market, listing class) to confirm the premium yield is real.
Location & tenants
- Location reads 66/100 on livability (#613 in TX) — a middle-class / working-renter tenant base. Strengths: crime A+, cost of living A+, housing A+; Watch: employment C-, amenities F, commute F.
- Celina ISD (rural): math 50% / reading 61% proficiency, ranked #71 of 826 in TX (top 9%) — acceptable for families but not a draw, mixed tenant base, ~2y average lease.
- Zoned schools: Marcy B Lykins El (math 38% / reading 50%, grade F, #1,243 of 4,322 statewide, top 29%, 708 students, 22% FRL); Jerry & Linda Moore Middle (math 56% / reading 60%, grade B, #197 of 1,662 statewide, top 12%, 903 students, 20% FRL); Celina H S (math 44% / reading 72%, grade C, #320 of 1,632 statewide, top 20%, 1,074 students, 18% FRL).
- Market conditions: 491 active listings in the ZIP; 29 comparable units currently listed for rent nearby; rentals at typical pace (median 20d on market — plan ~3-4 weeks tenant-placement turnaround); 10,531 units permitted in Denton County in 2024 (2,713 in 5+ unit buildings).
Forward outlook
- Local home prices are declining (-3.0%/yr); year-one equity from $2k of loan paydown is wiped out by about $10k of value loss. Plan a longer hold.
- Denton County population projected at +66% by 2050 — long-run rental-demand tailwind backs the buy-and-hold thesis.
Negotiation context
- It's been on market 51 days — a 3% lower offer ($315k) is reasonable based on typical stale-listing flexibility.
Questions for the listing agent
- What do current leases actually rent for vs. the listed asking? Can we see a recent rent roll and the last 12 months of T-12 income?
- It's been on market 51 days. Have you received any prior offers? Is the seller open to a 26% concession, seller financing, or rate buy-down credit?
- Is there a deadline driving the sale (1031 exchange, divorce, estate, relocation)? That informs how much negotiation room exists.
- Schools are D-rated, which usually means shorter tenancies and higher turnover. Who's the typical renter profile here, and what's been the actual vacancy rate?
- The area grade is low — what's the realistic commute time and amenity access for the typical tenant pool here? Any planned neighborhood developments (good or bad) we should know about?
- What's the average days-on-market for RENTAL listings here right now (not sales)? A rising rental-DOM trend means longer vacancies and softer asking-rent achievability than the comps imply.
- What's the recent tenant-quality profile in this submarket — average credit score on applications, eviction rate, late-payment / NSF rate, and stable-employment percentage? A property-management company in the area should have these aggregated.
- How much new for-sale + rental construction is in the pipeline within 1–3 miles? Heavy new supply typically softens prices + rents 12–24 months out; constrained supply supports both.
Investment metrics
- 1% rule
- 0.74% ✗
- Cap rate
- 5.01%
- Cash-on-cash
- -4.59%
- DSCR
- 0.80
- GRM
- 11.3
CMA / ARV
- ARV (median comp)
- $426,568
- List price
- $324,999
- Delta
- -23.81%
- Verdict
- UNDERPRICED
- Comps
- 20 within 1.0 mi
Show comp detail 12 sales within ~0.75 mi
| Address | Dist | Beds/Ba | Sqft | Sold | Price | $/sf | Match |
|---|---|---|---|---|---|---|---|
| 5715 Smiley Rd | 0.42mi | 4/2.0 | 1,850 (-3%) | 2mo | $850,000 | $459 | 74 |
| 14549 Flossie St | 0.49mi | 4/2.0 | 1,866 (-2%) | 1mo | $389,990 | $209 | 74 |
| 14498 Lovelace St | 0.54mi | 4/3.0 | 1,944 (+2%) | 5mo | $359,990 | $185 | 63 |
| 14437 Lovelace St | 0.46mi | 4/3.0 | 1,978 (+4%) | 16mo | $398,905 | $202 | 55 |
| 14474 Lovelace St | 0.54mi | 4/3.0 | 1,944 (+2%) | 16mo | $437,060 | $225 | 54 |
| 5917 Mayer Ave | 0.61mi | 3/2.0 (-1) | 1,991 (+5%) | 6mo | $334,990 | $168 | 54 |
| 14550 Flossie St | 0.49mi | 4/3.0 | 2,140 (+12%) | 2mo | $399,990 | $187 | 51 |
| 14441 Mietner St | 0.70mi | 3/2.0 (-1) | 1,991 (+5%) | 5mo | $349,990 | $176 | 50 |
| 14446 Mcclint St | 0.68mi | 4/3.0 | 1,944 (+2%) | 14mo | $393,905 | $203 | 49 |
| 14437 Mcclint St | 0.70mi | 4/3.0 | 1,944 (+2%) | 15mo | $464,750 | $239 | 47 |
| 5863 Anning Way | 0.48mi | 4/3.0 | 2,098 (+10%) | 12mo | $445,000 | $212 | 46 |
| 14426 Mcclint St | 0.70mi | 4/3.0 | 2,103 (+11%) | 1mo | $398,000 | $189 | 45 |
Match score weights: distance 35% · size 25% · config 20% · recency 20%. Top-matched comps best support the ARV.
Projected returns pro-forma
-3.0% appreciation · 3.0% rent growth · sell at horizon
- IRR
- -24.1%
- Equity multiple
- 0.18×
- Total profit
- $-74,781
- Equity at exit
- $48,458
- IRR
- -19.2%
- Equity multiple
- -0.03×
- Total profit
- $-93,496
- Equity at exit
- $28,100
Cash invested: $91,000 (down + closing). Projections, not guarantees.
Landlord ↔ Tenant lean methodology
- Overall (STATE)
- 87 Strongly Landlord-Friendly
- State Texas
- 87 Strongly Landlord-Friendly · R+5
- County
- — inherits STATE
- City
- — inherits STATE
ZIP-level market 76258
- Home prices YoY
- -7.9%
- Active inventory
- 491
- Price-to-rent
- 11.3×
Monthly cashflow live
- Estimated rent
- $2,403 high interval (Pro) →
- Mortgage (P&I)
- −$1,704
- Tax est. 1.5%
- −$406 /mo · $4,875/yr
- Insurance
- −$135
- HOA
- −$0
- Vacancy / Maint / Mgmt
- −$505
- Net cashflow
- $-348
Break-even live
Sensitivity live
| Price | -10% $-123 | -5% $-236 | +0% $-348 | +5% $-460 | +10% $-572 |
|---|---|---|---|---|---|
| Rent | -10% $-538 | -5% $-443 | +0% $-348 | +5% $-253 | +10% $-158 |
| Rate | -1.0pp $-184 | -0.5pp $-265 | base $-348 | +0.5pp $-432 | +1.0pp $-518 |
UW: 25.0% down · 7.5% · 30yr · 1.5% tax · 5.0% vac · 8.0% maint · 8.0% mgmt
Financing live
Cash to close
- Down payment
- $81,250
- Closing costs
- $9,750
- Reserves months
- —
- Total cash needed
- —
Loan-product check · same deal, 3 products live
Conventional
25% down · 7.5% · 30yr
- Down + closing
- —
- Monthly P&I
- —
- Monthly cashflow
- —
- DSCR
- —
- Eligible?
- —
Personal DTI + credit; lowest rate.
DSCR
20% down · 8.5% · 30yr
- Down + closing
- —
- Monthly P&I
- —
- Monthly cashflow
- —
- DSCR
- —
- Eligible?
- —
No personal income docs; deal must DSCR.
Hard money
10% down · 12.0% · 12mo
- Down + closing
- —
- Monthly P&I
- —
- Monthly cashflow
- —
- DSCR
- —
- Eligible?
- —
Short-term bridge; refi at stabilization.
Rent comps 29 comps
| Address | Beds | Baths | Sqft | Rent | $/sqft | DOM | Units | Dist |
|---|---|---|---|---|---|---|---|---|
| 5928 Mustang Creek Ln Celina, TX | 3.0 | 2.5 | 1900 | $2,395 | $1.26 | 14d | 1 | 1.09mi |
| 16309 Garden Dr Celina, TX | 3.0 | 2.0 | 1803 | $2,450 | $1.36 | 45d | 1 | 1.14mi |
| 6108 Shasta Creek Rd Celina, TX | 4.0 | 2.5 | 2123 | $2,700 | $1.27 | 14d | 1 | 1.18mi |
| 6108 Shasta Creek Rd Celina, TX | 4.0 | 2.5 | 2123 | $2,650 | $1.25 | 7d | 1 | 1.18mi |
| 6124 Shasta Creek Rd Celina, TX | 4.0 | 3.0 | 2183 | $2,595 | $1.19 | 5d | 1 | 1.19mi |
| 14220 Aberavon Dr Pilot Point, TX | 3.0 | 2.0 | 1654 | $2,099 | $1.27 | 5d | 1 | 1.20mi |
| 16629 Freshwater Dr Celina, TX | 4.0 | 3.0 | 2211 | $2,600 | $1.18 | 26d | 1 | 1.20mi |
| 14221 Donahue St Pilot Point, TX | 5.0 | 3.0 | 2609 | $2,499 | $0.96 | 20d | 1 | 1.20mi |
| 6109 White Creek Dr Celina, TX | 4.0 | 3.0 | 2168 | $2,899 | $1.34 | 4d | 1 | 1.20mi |
| 14216 Aberavon Dr Pilot Point, TX | 3.0 | 2.0 | 1801 | $2,195 | $1.22 | 45d | 1 | 1.20mi |
| 14216 Aberavon Dr Pilot Point, TX | 3.0 | 2.0 | 1801 | $2,135 | $1.19 | 14d | 1 | 1.20mi |
| 16625 Hidden Cove Dr Celina, TX | 4.0 | 2.0 | 1962 | $2,495 | $1.27 | 26d | 1 | 1.23mi |
| 6246 Shasta Creek Rd Celina, TX | 4.0 | 3.0 | 2182 | $2,695 | $1.24 | 0d | 1 | 1.26mi |
| 14184 Hammersmith St Pilot Point, TX | 4.0 | 2.0 | 2062 | $2,400 | $1.16 | 0d | 1 | 1.28mi |
| 6249 White Creek Dr Celina, TX | 4.0 | 3.0 | 2168 | $2,495 | $1.15 | 13d | 1 | 1.30mi |
| 14122 Emeric St Pilot Point, TX | 4.0 | 3.0 | 2247 | $2,500 | $1.11 | 26d | 1 | 1.30mi |
| 14115 Harden St Pilot Point, TX | 5.0 | 3.5 | 2534 | $2,790 | $1.10 | 45d | 1 | 1.31mi |
| 6113 Tahoe Winds Dr Celina, TX | 4.0 | 3.5 | 2174 | $2,800 | $1.29 | 26d | 1 | 1.31mi |
| 14153 Golden Bridge Dr Pilot Point, TX | 3.0 | 2.0 | 1516 | $1,895 | $1.25 | 18d | 1 | 1.31mi |
| 14114 Donahue St Pilot Point, TX | 3.0 | 2.0 | 1499 | $2,200 | $1.47 | 19d | 1 | 1.34mi |
| 14174 Inglebert St Pilot Point, TX | 3.0 | 2.0 | 1455 | $1,850 | $1.27 | 45d | 1 | 1.34mi |
| 14112 Hammersmith St Pilot Point, TX | 3.0 | 2.0 | 1520 | $1,795 | $1.18 | 9d | 1 | 1.38mi |
| 14112 Hammersmith St Pilot Point, TX | 3.0 | 2.0 | 1520 | $1,895 | $1.25 | 20d | 1 | 1.38mi |
| 14149 Danesdale Dr Pilot Point, TX | 4.0 | 2.5 | 2423 | $2,395 | $0.99 | 9d | 1 | 1.38mi |
| 14133 Calderwood St Pilot Point, TX | 3.0 | 2.0 | 1760 | $2,280 | $1.30 | 45d | 1 | 1.39mi |
| 3304 Lake Palestine Rd Celina, TX | 4.0 | 3.0 | 2179 | $2,650 | $1.22 | 14d | 1 | 1.42mi |
| 14121 Danesdale Dr Pilot Point, TX | 4.0 | 2.0 | 1664 | $2,000 | $1.20 | 45d | 1 | 1.43mi |
| 7108 Calshot Rd Pilot Point, TX | 4.0 | 2.0 | 1756 | $1,995 | $1.14 | 45d | 1 | 1.46mi |
| 5513 Deer Run Dr Celina, TX | 4.0 | 2.0 | 2009 | $3,000 | $1.49 | 45d | 1 | 1.46mi |
Listing history 15 events
-
2026-06-21days on market $324,999 Active 51 DOM
-
2026-06-18days on market $324,999 Active 48 DOM
-
2026-06-17days on market $324,999 Active 47 DOM
-
2026-06-16days on market $324,999 Active 46 DOM
-
2026-06-15days on market $324,999 Active 45 DOM
-
2026-06-13days on market $324,999 Active 43 DOM
-
2026-06-09days on market $324,999 Active 39 DOM
-
2026-06-08days on market $324,999 Active 38 DOM
-
2026-06-07days on market $324,999 Active 37 DOM
-
2026-06-04days on market $324,999 Active 34 DOM
-
2026-06-03days on market $324,999 Active 33 DOM
-
2026-06-02days on market $324,999 Active 32 DOM
-
2026-06-01days on market $324,999 Active 31 DOM
-
2026-05-31days on market $324,999 Active 30 DOM
-
2026-05-01$324,999 Active 407-char remark
ⓘ Source: listings_history table (triggers on properties + properties_extension) + one-shot
backfill from property_details.listing_events for pre-trigger history.
Nearby sold comps map
Loading sold comps map…
Walkable amenities ~0.75 mi
Loading nearby amenities…
Taxation est. · year 1
- Rental income
- $28,833
- − Mortgage interest
- −$18,205
- − Property taxes
- −$4,875
- − Insurance
- −$1,625
- − Repairs & maintenance
- −$2,307
- − Management
- −$2,307
- − Depreciation
- −$9,455
- Taxable loss
- −$9,940
- Est. tax savings @ 24.0%
- +$2,386
- After-tax cash flow
- $-1,788/yr
For passive investors: Depreciation is non-cash, so a rental often shows a tax loss while cash-flowing — sheltering income. Rental losses are passive: they offset passive income freely, and up to $25,000/yr can offset ordinary (W-2) income if you actively participate and your MAGI is under $100k (phasing out to $0 by $150k); unused losses carry forward. On sale, claimed depreciation is recaptured at up to 25%, and gains may owe capital-gains tax (a 1031 exchange can defer both). Figures are a year-1 estimate at your 24.0% rate — not tax advice; consult a CPA.
Schools (NCES district)
- District
- Celina ISD
- NCES district ID
- 4813290
- Math proficiency
- 50% ▼ -15.00%
- Reading proficiency
- 61% ▼ -5.00%
- Median HH income
- $83,282
- Composite
- 50.49/100
- National rank
- #1853
- State rank
- #71 of 826 in TX
Livability — Pilot Point
- Score
- 66/100
- State rank
- #613
- US rank
- #11604
Category grades
Schools grade is shown separately in the Schools card above.
Census & demographics
- Census place
- Pilot Point, TX
- Population (ZIP)
- 8,042
Population outlook (Denton County) Hauer SSP2
- Today (2025)
- 1,053,010 people
- By 2030
- 1,192,269 · +13.2%
- By 2040
- 1,472,920 · +39.9%
- By 2050
- 1,746,506 · +65.9%
- By 2075
- 2,358,497 · +124.0%
- By 2100
- 2,779,183 · +163.9%
Race, ethnicity, and origin ACS 2023
- Neighborhood character
- Majority White (64%)
- Race & ethnicity
- White 64% Hispanic / Latino 28% Two or more races 19% Black 3% Pacific Islander 1%
- Hispanic origin (detail)
- Mexican 26%
- Common ancestry
- Serbian 4% Lithuanian 1% Scottish 1%
- Foreign-born
- 11% · Canada
- Languages at home
- 73% English-only · Spanish 25% Arabic 1% Other Asian/Pacific 1%
Political lean MEDSL · Denton
- 2024 margin
- R (+13.2) · D 42.7% · R 55.8% · Other 1.5%
- 2008→2024 swing
- +11.0pp toward D · 2008: -24.2pp · 2024: -13.2pp
- All cycles
- 2024: R+13.2 2020: R+8.1 2016: R+20.2 2012: R+31.7 2008: R+24.2
Not yet ingested
- Civics
- —
Market trends
- HPI YoY
- ▼ -26.12%
- Current HPI
- 303.4015
- Rent YoY
- —
- Metro
- —
- State GDP YoY
- ▲ 3.95%
- F500 in state
- 110
Industry mix (Fortune 500 HQ in TX)
| Industry | F500 HQs | Revenue |
|---|---|---|
| Energy | 16 | $1,198B |
|
||
| Technology | 5 | $198B |
|
||
| Engineering / Construction | 4 | $72B |
|
||
| Energy Services | 3 | $60B |
|
||
| Utilities | 3 | $41B |
|
||
| Healthcare | 2 | $330B |
|
||
Cash-flow waterfall
monthlySold comps — $/sqft
last 12 mo · ≤1 miLoading sold comps…