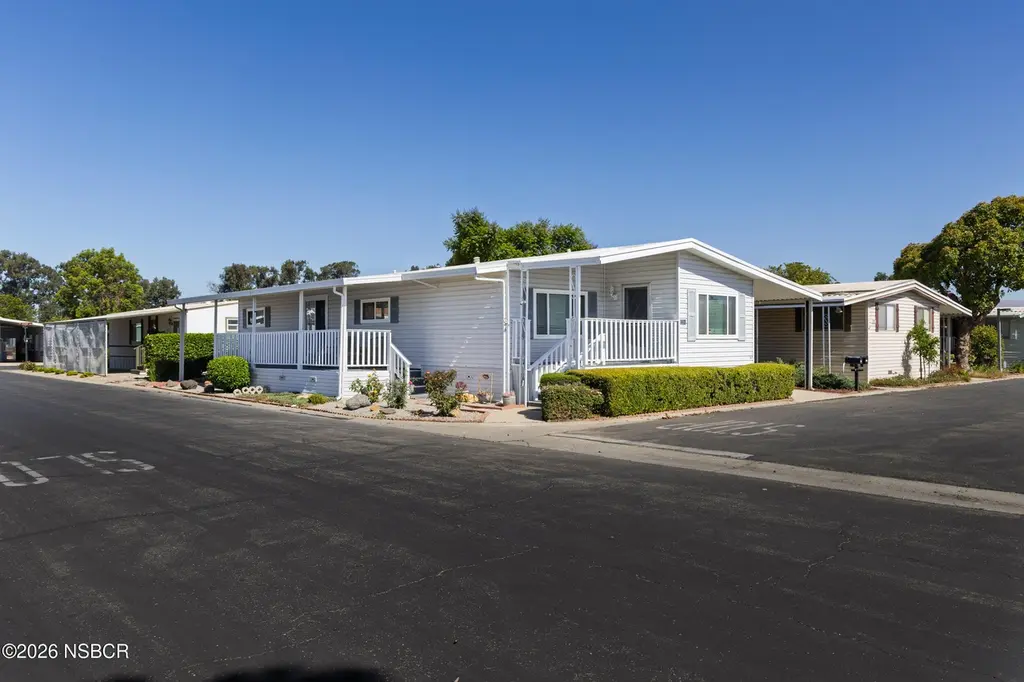
1201 Via Felice · Santa Maria, CA
Flood risk 6/10 · Moderate
- FEMA flood zone
- X (unshaded)
- Chance of flooding over 30 yrs
- 0.48%
- Est. flood insurance / yr
- $507 – $1,088
Fire risk 4/10 · Minor
- Est. fire insurance / yr
- $659 – $1,223
Heat risk 4/10 · Minor
- Hot days now (above 84°F)
- 7 days/yr
- Hot days in 30 yrs
- 17 days/yr
Wind risk 1/10 · Minimal
- Chance of severe wind over 30 yrs
- —
Air-quality risk 6/10 · Moderate
- Unhealthy air days now
- 11 days/yr
- Unhealthy air days in 30 yrs
- 12 days/yr
Risk factors via First Street. Map © Google.
Why this score? — see what drove the B+ grade
The composite is a weighted blend of 9 inputs, each scored 0–100. Each bar is that input's sub-score; the figure is the points it added to the 100-point composite (weight × sub-score).
- Cash flow +30.0/30.0
- ARV discount +15.0/15.0
- DSCR +10.0/10.0
- 1% rule +9.9/10.0
- Livability +3.6/5.0
- Rent growth +3.3/5.0
- Schools +2.9/10.0
- Condition / age +2.5/5.0
- Appreciation +0.0/10.0
$135,000
🖨 Deal sheet (PDF) 📄 Offer letter ✓ Due diligence
Listing remarks MLS
Welcome to easy Central Coast living in this beautifully maintained 2-bedroom, 2-bath manufactured home located in a desirable 55+ community on the northeast side of the Santa Maria Valley. This peaceful and well-kept park offers residents a relaxing lifestyle with wonderful amenities, including a clubhouse and community pool. Inside, you'll find an inviting open-concept floor plan where the living room, dining area, and kitchen flow seamlessly together, creating an ideal space for both everyday living and entertaining. The spacious kitchen features Corian countertops, abundant cabinetry, generous counter space, a center island with seating, and a charming breakfast nook perfect for morning coffee or casual dining. Large, upgraded windows and sliding glass doors fill the home with natural light, creating a bright and welcoming atmosphere throughout. The spacious primary suite offers a private retreat complete with an ensuite bathroom featuring a soaking tub and upgraded vanity. The guest bathroom has also been tastefully updated with newer tile, sink, and toilet. Additional features include a dedicated indoor laundry room, ample storage, and thoughtful updates throughout the home. Step outside and enjoy the beautiful covered porch on the south side of the home, complete with newly installed railings and carpeting, providing the perfect setting to relax and enjoy the mild Central Coast climate year-round. The property also offers a covered carport and drought-tolerant landscaping for easy maintenance. Whether you're looking to downsize, retire, or simply enjoy a more relaxed pace of life, this charming home offers comfort, convenience, and an exceptional community you'll be proud to call home.
Key facts
- Breakfast nook
- Corian countertops
- Spacious kitchen
Tags
Property features AI
Finance
- Financial info: Land lease: $1,163
- HOA & community: Senior community; Street lighting; Manager approval required
Exterior
- Parking: Located in Casa Del Rio mobile home park
- Utilities: Public sewer; District/Public water
- Home design: Single-story mobile home; Mobile home remains on site; Entry at main level
- Construction: Mobile home (24 ft by 60 ft); Public records used for year built
- Exterior features: Covered porch; Patio; Association pool
Interior
- Bedrooms: All bedrooms located on the ground/main level
- Bathrooms: 2 full bathrooms
- Interior features: All bedrooms on one level; Main entry; One-level home
- Laundry & utility: Dedicated laundry room
Neighborhood map
What this means for you Summary
Snapshot
- This is a 2-bed/2.0-bath manufactured listed at $135k.
Deal economics
- At list price, monthly cash flow is $660 ($8k/yr) — positive.
- The deal already cash-flows at list — no discount required.
- Meets the 1% rule at list price ($2k rent vs $135k).
- Cap rate 12.2% vs local median 3.5% in Santa Maria — top-decile yield for the area; either an underpriced asset or a hidden risk that comps aren't pricing in. Stress-test before assuming the spread holds.
Location & tenants
- Location reads 71/100 on livability (#202 in CA) — a middle-class / working-renter tenant base. Strengths: amenities A+, commute A+, health & safety A; Watch: crime F, cost of living F.
- Santa Maria-Bonita (urban): math 26% / reading 34% proficiency, ranked #1,023 of 1,400 in CA (top 73%) — families likely to look elsewhere, expect single-tenant / working-renter base with shorter leases; 72% free/reduced lunch — lower-income household profile, screen leases tightly.
- Zoned schools: Tunnell (Martin Luther) Elementary (803 students, 78% FRL); Kunst (Tommie) Junior High (1,030 students, 61% FRL); Pioneer Valley High (3,220 students, 74% FRL) — zoned schools at 71% FRL track the district average.
- Market conditions: Rents rising (+3.3%/yr); 83 active listings in the ZIP; 3 comparable units currently listed for rent nearby; rentals at typical pace (median 16d on market — plan ~3-4 weeks tenant-placement turnaround); solid renter incomes; 719 units permitted in Santa Barbara County in 2024 (217 in 5+ unit buildings).
Forward outlook
- Local home prices are declining (-3.0%/yr); year-one equity from $933 of loan paydown is wiped out by about $4k of value loss. Plan a longer hold.
- Santa Barbara County population projected at +20% by 2050 — long-run rental-demand tailwind backs the buy-and-hold thesis.
- At projected returns (-3.0% appreciation + 3.3% rent growth), your $38k cash investment doubles in ~6 years — after that, you're playing with house money.
Negotiation context
- Only 10 days on market — expect competitive offers; lowballing is unlikely to land.
- 4 sale attempts since 27y ago; this cycle's ask has dropped $15k (10%) from the opening price — seller is motivated, your offer sets the floor, not the list.
- Current owner paid $63k; list at $135k implies a 114% gain — meaningful room to come down on a strong offer.
Risks & watch-outs
- Climate carrying-cost: major flood risk — expect insurance premiums to compound above CPI over the hold.
Questions for the listing agent
- Built in 1975 — when were the roof, HVAC, electrical panel, plumbing, and water heater last replaced?
- Is there a deadline driving the sale (1031 exchange, divorce, estate, relocation)? That informs how much negotiation room exists.
- Schools are F-rated, which usually means shorter tenancies and higher turnover. Who's the typical renter profile here, and what's been the actual vacancy rate?
- Crime grade is F in this area — have there been break-ins, vandalism, or insurance claims at this property in the last 3 years? What carrier currently insures it and at what premium?
- What's the average days-on-market for RENTAL listings here right now (not sales)? A rising rental-DOM trend means longer vacancies and softer asking-rent achievability than the comps imply.
- What's the recent tenant-quality profile in this submarket — average credit score on applications, eviction rate, late-payment / NSF rate, and stable-employment percentage? A property-management company in the area should have these aggregated.
- How much new for-sale + rental construction is in the pipeline within 1–3 miles? Heavy new supply typically softens prices + rents 12–24 months out; constrained supply supports both.
Investment metrics
- 1% rule
- 1.49% ✓
- Cap rate
- 12.16%
- Cash-on-cash
- 20.96%
- DSCR
- 1.93
- GRM
- 5.6
CMA / ARV
- ARV (on-the-fly)
- $165,168
- Comps found
- 12
Show comp detail 12 sales within ~0.75 mi
| Address | Dist | Beds/Ba | Sqft | Sold | Price | $/sf | Match |
|---|---|---|---|---|---|---|---|
| 1127 Via Estio | 0.04mi | 2/2.0 | 1,536 (+3%) | 7mo | $152,000 | $99 | 87 |
| 1620 Via Ynez | 0.14mi | 3/2.0 (+1) | 1,488 (0%) | 1mo | $165,000 | $111 | 87 |
| 1602 Via Tropico | 0.12mi | 3/2.0 (+1) | 1,512 (+2%) | 0mo | $320,000 | $212 | 86 |
| 1403 Via Asueto | 0.14mi | 2/2.0 | 1,440 (-3%) | 2mo | $210,000 | $146 | 86 |
| 1651 Via Quantico | 0.06mi | 3/2.0 (+1) | 1,521 (+2%) | 4mo | $200,000 | $131 | 85 |
| 1627 Via Sabroso | 0.06mi | 2/2.0 | 1,440 (-3%) | 13mo | $60,000 | $42 | 82 |
| 1201 Via Gusto | 0.03mi | 3/2.0 (+1) | 1,536 (+3%) | 10mo | $165,000 | $107 | 80 |
| 1608 Via Quantico | 0.16mi | 3/2.0 (+1) | 1,536 (+3%) | 4mo | $115,000 | $75 | 79 |
| 1127 Via Contento | 0.10mi | 2/2.0 | 1,392 (-6%) | 6mo | $115,000 | $83 | 79 |
| 1617 Via Rico | 0.05mi | 3/2.0 (+1) | 1,568 (+5%) | 11mo | $174,000 | $111 | 75 |
| 1632 Via Undoso | 0.12mi | 2/2.0 | 1,320 (-11%) | 8mo | $149,000 | $113 | 69 |
| 1608 Via Undoso | 0.11mi | 2/2.0 | 1,284 (-14%) | 17mo | $134,000 | $104 | 58 |
Match score weights: distance 35% · size 25% · config 20% · recency 20%. Top-matched comps best support the ARV.
Projected returns pro-forma
-3.0% appreciation · 3.26% rent growth · sell at horizon
- IRR
- 13.7%
- Equity multiple
- 1.55×
- Total profit
- $20,726
- Equity at exit
- $20,129
- IRR
- 22.7%
- Equity multiple
- 2.97×
- Total profit
- $74,491
- Equity at exit
- $11,672
Cash invested: $37,800 (down + closing). Projections, not guarantees.
Landlord ↔ Tenant lean methodology
- Overall (STATE)
- 18 Strongly Tenant-Friendly
- State California
- 18 Strongly Tenant-Friendly · D+13
- County
- — inherits STATE
- City
- — inherits STATE
ZIP-level market 93454
- Rents YoY
- 3.3%
- Active inventory
- 83
- Price-to-rent
- 5.6×
Monthly cashflow live
- Estimated rent
- $2,017 medium interval (Pro) →
- Mortgage (P&I)
- −$708
- Tax est. 1.5%
- −$169 /mo · $2,025/yr
- Insurance
- −$56
- HOA
- −$0
- Lot rent leased land?
- −$0
- Vacancy / Maint / Mgmt
- −$423
- Net cashflow
- $660
Break-even live
Sensitivity live
| Price | -10% $753 | -5% $707 | +0% $660 | +5% $613 | +10% $567 |
|---|---|---|---|---|---|
| Rent | -10% $501 | -5% $580 | +0% $660 | +5% $740 | +10% $819 |
| Rate | -1.0pp $728 | -0.5pp $694 | base $660 | +0.5pp $625 | +1.0pp $590 |
UW: 25.0% down · 7.5% · 30yr · 1.5% tax · 5.0% vac · 8.0% maint · 8.0% mgmt
Financing live
Cash to close
- Down payment
- $33,750
- Closing costs
- $4,050
- Reserves months
- —
- Total cash needed
- —
Loan-product check · same deal, 3 products live
Conventional
25% down · 7.5% · 30yr
- Down + closing
- —
- Monthly P&I
- —
- Monthly cashflow
- —
- DSCR
- —
- Eligible?
- —
Personal DTI + credit; lowest rate.
DSCR
20% down · 8.5% · 30yr
- Down + closing
- —
- Monthly P&I
- —
- Monthly cashflow
- —
- DSCR
- —
- Eligible?
- —
No personal income docs; deal must DSCR.
Hard money
10% down · 12.0% · 12mo
- Down + closing
- —
- Monthly P&I
- —
- Monthly cashflow
- —
- DSCR
- —
- Eligible?
- —
Short-term bridge; refi at stabilization.
Rent comps 3 comps
| Address | Beds | Baths | Sqft | Rent | $/sqft | DOM | Units | Dist |
|---|---|---|---|---|---|---|---|---|
| 1124 N Suey Rd Santa Maria, CA | 2.0 | 2.0 | 1296 | $2,500 | $1.93 | 16d | 1 | 0.22mi |
| 914 E El Camino St Santa Maria, CA | 3.0 | 2.0 | 1441 | $3,400 | $2.36 | 23d | 1 | 1.03mi |
| Lynne Dr Santa Maria, CA | 3.0 | 2.5 | 1264 | $3,000 | $2.37 | 16d | 1 | 1.30mi |
Listing history 8 events
-
2026-06-23pricedays on market $135,000 Active 10 DOM
-
2026-06-21days on market $150,000 Active 9 DOM
-
2026-06-18days on market $150,000 Active 6 DOM
-
2026-06-17days on market $150,000 Active 5 DOM
-
2026-06-16days on market $150,000 Active 4 DOM
-
2026-06-15days on market $150,000 Active 3 DOM
-
2026-06-13remarks 699-char remark
-
2026-06-13$150,000 Active 1 DOM
ⓘ Source: listings_history table (triggers on properties + properties_extension) + one-shot
backfill from property_details.listing_events for pre-trigger history.
Climate risk First Street
- Flood 6/10 Major FEMA zone X (unshaded) · 48% chance over 30 yrs
- Wildfire 4/10 Moderate
- Heat 4/10 Moderate 7 d/yr ≥84°F today · 17 d/yr by 30 yrs out
- Wind 1/10 Low
- Air quality 6/10 Major 11 unhealthy d/yr today · 12 by 30 yrs out
Nearby sold comps map
Loading sold comps map…
Walkable amenities ~0.75 mi
Loading nearby amenities…
Taxation est. · year 1
- Rental income
- $24,198
- − Mortgage interest
- −$7,562
- − Property taxes
- −$2,025
- − Insurance
- −$675
- − Repairs & maintenance
- −$1,936
- − Management
- −$1,936
- − Depreciation
- −$3,927
- Taxable income
- $6,137
- Est. tax owed @ 24.0%
- −$1,473
- After-tax cash flow
- $6,448/yr
For passive investors: Depreciation is non-cash, so a rental often shows a tax loss while cash-flowing — sheltering income. Rental losses are passive: they offset passive income freely, and up to $25,000/yr can offset ordinary (W-2) income if you actively participate and your MAGI is under $100k (phasing out to $0 by $150k); unused losses carry forward. On sale, claimed depreciation is recaptured at up to 25%, and gains may owe capital-gains tax (a 1031 exchange can defer both). Figures are a year-1 estimate at your 24.0% rate — not tax advice; consult a CPA.
Schools (NCES district)
- District
- Santa Maria-Bonita
- NCES district ID
- 0605580
- Math proficiency
- 26% ▲ 3.00%
- Reading proficiency
- 34% ▲ 3.00%
- Median HH income
- $50,959
- Composite
- 29.11/100
- National rank
- #11891
- State rank
- #1023 of 1400 in CA
Livability — Santa Maria
- Score
- 71/100
- State rank
- #202
- US rank
- #6519
Category grades
Schools grade is shown separately in the Schools card above.
Census & demographics
- Census place
- Santa Maria, CA
- County
- Santa Barbara County · 410,380 people
- City population
- 145,655
- Metro
- Santa Maria-Santa Barbara, CA
- Population (ZIP)
- 41,896
- Household income
- $81,522
- Rent vs Own
- Severe rent burden
- 1893.0
Population outlook (Santa Barbara County) Hauer SSP2
- Today (2025)
- 484,679 people
- By 2030
- 505,323 · +4.3%
- By 2040
- 545,783 · +12.6%
- By 2050
- 584,263 · +20.5%
- By 2075
- 682,586 · +40.8%
- By 2100
- 723,188 · +49.2%
Race, ethnicity, and origin ACS 2023
- Neighborhood character
- Predominantly Hispanic (73%)
- Race & ethnicity
- Hispanic / Latino 73% Two or more races 37% White 20% Native American 3% Asian 3%
- Hispanic origin (detail)
- Mexican 69%
- Common ancestry
- Russian 1% Italian 1% Lithuanian 1%
- Foreign-born
- 26% · Canada, Vietnam
- Languages at home
- 43% English-only · Spanish 52% Tagalog/Filipino 1%
Political lean MEDSL · Santa Barbara
- 2024 margin
- Strong D (+26.7) · D 61.8% · R 35.1% · Other 3.1%
- 2008→2024 swing
- +3.8pp toward D · 2008: 22.9pp · 2024: 26.7pp
- All cycles
- 2024: D+26.7 2020: D+32.1 2016: D+28.2 2012: D+17.1 2008: D+22.9
Not yet ingested
- Civics
- —
Market trends
- HPI YoY
- ▼ -543.97%
- Current HPI
- 313.0849
- Rent YoY
- ▲ 3.26%
- Metro
- Santa Maria-Santa Barbara, CA
- State GDP YoY
- ▲ 3.21%
- F500 in state
- 116
Industry mix (Fortune 500 HQ in CA)
| Industry | F500 HQs | Revenue |
|---|---|---|
| Technology | 27 | $1,492B |
|
||
| Financial Services | 3 | $174B |
|
||
| Retail | 3 | $44B |
|
||
| Insurance | 3 | $26B |
|
||
| Media / Entertainment | 2 | $115B |
|
||
| Pharmaceuticals / Biotech | 2 | $62B |
|
||
Price history
+435.7% since first listed6 events — show timeline
- 2026-06-12 Listed $150,000 NSBCRMLS
- 2026-06-12 Listed $150,000 CRMLS
- 2016-06-17 Sold (MLS) $63,100 NSBCRMLS
- 2016-02-16 Listed $63,000 NSBCRMLS
- 2000-01-20 Sold (MLS) $26,000 NSBCRMLS
- 1999-08-17 Listed $28,000 NSBCRMLS
Property tax history
-6.9%/yrLatest (2025): $159 · +5.5% YoY. Source: county tax records.
Cash-flow waterfall
monthlySold comps — $/sqft
last 12 mo · ≤1 miLoading sold comps…