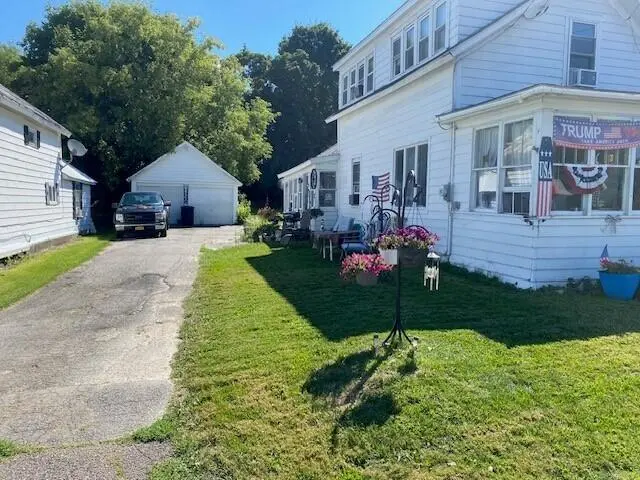
278 West Main Street St · Malone, NY
Flood risk 4/10 · Minor
- FEMA flood zone
- X
- Chance of flooding over 30 yrs
- 0.2%
- Est. flood insurance / yr
- $473 – $860
Fire risk 3/10 · Minor
- Est. fire insurance / yr
- $691 – $1,283
Heat risk 2/10 · Minimal
- Hot days now (above 90°F)
- 7 days/yr
- Hot days in 30 yrs
- 17 days/yr
Wind risk 1/10 · Minimal
- Chance of severe wind over 30 yrs
- —
Air-quality risk 1/10 · Minimal
- Unhealthy air days now
- 0 days/yr
- Unhealthy air days in 30 yrs
- 0 days/yr
Risk factors via First Street. Map © Google.
Why this score? — see what drove the B+ grade
The composite is a weighted blend of 9 inputs, each scored 0–100. Each bar is that input's sub-score; the figure is the points it added to the 100-point composite (weight × sub-score).
- Cash flow +30.0/30.0
- 1% rule +10.0/10.0
- DSCR +10.0/10.0
- Appreciation +10.0/10.0
- ARV discount +7.5/15.0
- Livability +3.5/5.0
- Rent growth +2.5/5.0
- Condition / age +2.5/5.0
- Schools +2.4/10.0
$59,900
🖨 Deal sheet (PDF) 📄 Offer letter ✓ Due diligence
Listing remarks MLS
This 2-Bedroom Home is in Good shape has a Den on the main floor with french doors off the Dinning Room that can be and is being used as the 3rd Bedroom-has a large Pantry/Laundry Room off the Kitchen-2-Bedrooms and a full Bath on the second floor-front and side enclosed porches-2-Car detached Garage with a nice size back yard. 278-280-and 274 West Main can be drastically reduced if purchased as a Package deal
Key facts
- Enclosed porches
- Laundry room
- French doors
Tags
Neighborhood map
What this means for you Summary
Snapshot
- This is a 2-bed/1.0-bath single-family listed at $60k.
Deal economics
- At list price, monthly cash flow is $243 ($3k/yr) — positive.
- The deal already cash-flows at list — no discount required.
- Meets the 1% rule at list price ($994 rent vs $60k).
- Recommended offer: $53k (12.0% below list) — sets the bar for market timing.
- Cap rate 11.2% vs local median 5.2% in Malone — top-decile yield for the area; either an underpriced asset or a hidden risk that comps aren't pricing in. Stress-test before assuming the spread holds.
Location & tenants
- Location reads 70/100 on livability (#437 in NY) — a middle-class / working-renter tenant base. Strengths: cost of living A+, housing A+, health & safety A+; Watch: employment D+, crime D-, amenities F.
- Malone Central School District (town): math 27% / reading 29% proficiency, ranked #581 of 590 in NY (top 98%) — low school quality limits family demand, transient renter base, plan for 1-2y turnover.
- Zoned schools: Davis Elementary School (math 8% / reading 27%, grade F, #2,004 of 2,108 statewide, top 95%, 563 students, 50% FRL); Malone Middle School (math 8% / reading 32%, grade F, #678 of 729 statewide, top 94%, 500 students, 52% FRL); Franklin Academy High School (math 82% / reading 70%, grade A-, #623 of 1,100 statewide, top 57%, 719 students, 47% FRL).
- Market conditions: 115 active listings in the ZIP; 124 units permitted in Franklin County in 2024 (0 in 5+ unit buildings).
Forward outlook
- In year one you build about $6k of equity ($414 loan paydown + $6k appreciation (10.0% local appreciation)).
- Franklin County population projected at -14% by 2050 — secular population decline; favor cash flow + early exit over multi-decade hold.
- At projected returns (10.0% appreciation + 3.0% rent growth), your $17k cash investment doubles in ~2 years — after that, you're playing with house money.
- By year 6, paydown + projected appreciation supports a ~$38k cash-out refi (75% LTV) — recoverable capital for the next deal without selling this one.
Negotiation context
- It's been on market 296 days — a 12% lower offer ($53k) is reasonable based on typical stale-listing flexibility.
- Current owner paid $45k; 33% above their basis — modest negotiation headroom, anchor on the comps not their cost.
Risks & watch-outs
- Watch-outs: property tax is 4.1% of price; built in 1880 — expect roof / HVAC / electrical / plumbing capex.
Questions for the listing agent
- It's been on market 296 days. Have you received any prior offers? Is the seller open to a 12% concession, seller financing, or rate buy-down credit?
- Built in 1880 — when were the roof, HVAC, electrical panel, plumbing, and water heater last replaced?
- Property tax is high relative to price — has the assessment been appealed recently, and will the sale trigger a re-assessment?
- Why hasn't it sold? Are there any deal-killer items the seller is aware of (foundation, flood, title, zoning, code violations)?
- Is there a deadline driving the sale (1031 exchange, divorce, estate, relocation)? That informs how much negotiation room exists.
- Schools are D-rated, which usually means shorter tenancies and higher turnover. Who's the typical renter profile here, and what's been the actual vacancy rate?
- Crime grade is D in this area — have there been break-ins, vandalism, or insurance claims at this property in the last 3 years? What carrier currently insures it and at what premium?
- What's the average days-on-market for RENTAL listings here right now (not sales)? A rising rental-DOM trend means longer vacancies and softer asking-rent achievability than the comps imply.
- What's the recent tenant-quality profile in this submarket — average credit score on applications, eviction rate, late-payment / NSF rate, and stable-employment percentage? A property-management company in the area should have these aggregated.
- How much new for-sale + rental construction is in the pipeline within 1–3 miles? Heavy new supply typically softens prices + rents 12–24 months out; constrained supply supports both.
Investment metrics
- 1% rule
- 1.66% ✓
- Cap rate
- 11.16%
- Cash-on-cash
- 17.38%
- DSCR
- 1.77
- GRM
- 5.0
CMA / ARV
- ARV (median comp)
- $128,244
- List price
- $59,900
- Delta
- -53.29%
- Verdict
- UNDERPRICED
- Comps
- 20 within 1.0 mi
Show comp detail 12 sales within ~0.75 mi
| Address | Dist | Beds/Ba | Sqft | Sold | Price | $/sf | Match |
|---|---|---|---|---|---|---|---|
| 48 Frankln St | 0.27mi | 2/1.0 | 1,200 (-4%) | 2mo | $97,850 | $82 | 79 |
| 72 Wellington St | 0.23mi | 3/1.0 (+1) | 1,188 (-5%) | 15mo | $118,453 | $100 | 64 |
| 27 Front st St | 0.37mi | 3/2.0 (+1) | 1,208 (-3%) | 12mo | $38,000 | $31 | 58 |
| 139 Franklin St | 0.44mi | 3/1.5 (+1) | 1,284 (+3%) | 18mo | $160,000 | $125 | 53 |
| 11 Grove St. St | 0.26mi | 3/1.5 (+1) | 1,350 (+8%) | 19mo | $125,500 | $93 | 52 |
| 15 Jones St | 0.31mi | 3/1.0 (+1) | 1,063 (-15%) | 8mo | $165,000 | $155 | 48 |
| 117 Duane Street St | 0.54mi | 3/1.0 (+1) | 1,158 (-7%) | 12mo | $82,000 | $71 | 48 |
| 47 Amsden St | 0.44mi | 3/1.0 (+1) | 1,068 (-15%) | 4mo | $75,000 | $70 | 48 |
| 6 Woodward St St | 0.72mi | 3/1.5 (+1) | 1,160 (-7%) | 3mo | $130,000 | $112 | 45 |
| 31 Factory Street St | 0.45mi | 3/1.0 (+1) | 1,156 (-8%) | 22mo | $14,000 | $12 | 43 |
| 14 South St | 0.71mi | 3/1.0 (+1) | 1,133 (-9%) | 6mo | $91,000 | $80 | 41 |
| 57 West Street St | 0.56mi | 3/1.0 (+1) | 1,400 (+12%) | 16mo | $73,500 | $53 | 35 |
Match score weights: distance 35% · size 25% · config 20% · recency 20%. Top-matched comps best support the ARV.
Projected returns pro-forma
10.0% appreciation · 3.0% rent growth · sell at horizon
- IRR
- 37.2%
- Equity multiple
- 3.87×
- Total profit
- $48,192
- Equity at exit
- $53,963
- IRR
- 32.1%
- Equity multiple
- 8.75×
- Total profit
- $129,934
- Equity at exit
- $116,373
Cash invested: $16,772 (down + closing). Projections, not guarantees.
Landlord ↔ Tenant lean methodology
- Overall (STATE)
- 15 Strongly Tenant-Friendly
- State New York
- 15 Strongly Tenant-Friendly · D+10
- County
- — inherits STATE
- City
- — inherits STATE
ZIP-level market 12953
- Home prices YoY
- 7.2%
- Active inventory
- 115
- Price-to-rent
- 5.0×
Monthly cashflow live
- Estimated rent
- $994 medium interval (Pro) →
- Mortgage (P&I)
- −$314
- Tax from tax record
- −$203 /mo · $2,434/yr
- Insurance
- −$25
- HOA
- −$0
- Vacancy / Maint / Mgmt
- −$209
- Net cashflow
- $243
Break-even live
Sensitivity live
| Price | -10% $277 | -5% $260 | +0% $243 | +5% $226 | +10% $209 |
|---|---|---|---|---|---|
| Rent | -10% $164 | -5% $204 | +0% $243 | +5% $282 | +10% $321 |
| Rate | -1.0pp $273 | -0.5pp $258 | base $243 | +0.5pp $227 | +1.0pp $212 |
UW: 25.0% down · 7.5% · 30yr · 1.5% tax · 5.0% vac · 8.0% maint · 8.0% mgmt
Financing live
Cash to close
- Down payment
- $14,975
- Closing costs
- $1,797
- Reserves months
- —
- Total cash needed
- —
Loan-product check · same deal, 3 products live
Conventional
25% down · 7.5% · 30yr
- Down + closing
- —
- Monthly P&I
- —
- Monthly cashflow
- —
- DSCR
- —
- Eligible?
- —
Personal DTI + credit; lowest rate.
DSCR
20% down · 8.5% · 30yr
- Down + closing
- —
- Monthly P&I
- —
- Monthly cashflow
- —
- DSCR
- —
- Eligible?
- —
No personal income docs; deal must DSCR.
Hard money
10% down · 12.0% · 12mo
- Down + closing
- —
- Monthly P&I
- —
- Monthly cashflow
- —
- DSCR
- —
- Eligible?
- —
Short-term bridge; refi at stabilization.
Listing history 19 events
-
2026-06-21statusdays on market $59,900 Pending 296 DOM
-
2026-06-18days on market $59,900 Active 294 DOM
-
2026-06-17days on market $59,900 Active 293 DOM
-
2026-06-16days on market $59,900 Active 292 DOM
-
2026-06-15days on market $59,900 Active 291 DOM
-
2026-06-13days on market $59,900 Active 289 DOM
-
2026-06-12days on market $59,900 Active 288 DOM
-
2026-06-09days on market $59,900 Active 285 DOM
-
2026-06-08days on market $59,900 Active 284 DOM
-
2026-06-07days on market $59,900 Active 283 DOM
-
2026-06-07days on market $59,900 Active 282 DOM
-
2026-06-04days on market $59,900 Active 279 DOM
-
2026-06-02days on market $59,900 Active 278 DOM
-
2026-06-01days on market $59,900 Active 277 DOM
-
2026-05-31days on market $59,900 Active 276 DOM
-
2026-05-13price $59,900 413-char remark
Show marketing remark (413 chars)
This 2-Bedroom Home is in Good shape has a Den on the main floor with french doors off the Dinning Room that can be and is being used as the 3rd Bedroom-has a large Pantry/Laundry Room off the Kitchen-2-Bedrooms and a full Bath on the second floor-front and side enclosed porches-2-Car detached Garage with a nice size back yard. 278-280-and 274 West Main can be drastically reduced if purchased as a Package deal
-
2026-01-19price $69,900 413-char remark
Show marketing remark (413 chars)
This 2-Bedroom Home is in Good shape has a Den on the main floor with french doors off the Dinning Room that can be and is being used as the 3rd Bedroom-has a large Pantry/Laundry Room off the Kitchen-2-Bedrooms and a full Bath on the second floor-front and side enclosed porches-2-Car detached Garage with a nice size back yard. 278-280-and 274 West Main can be drastically reduced if purchased as a Package deal
-
2025-08-28$79,900 Active 413-char remark
Show marketing remark (413 chars)
This 2-Bedroom Home is in Good shape has a Den on the main floor with french doors off the Dinning Room that can be and is being used as the 3rd Bedroom-has a large Pantry/Laundry Room off the Kitchen-2-Bedrooms and a full Bath on the second floor-front and side enclosed porches-2-Car detached Garage with a nice size back yard. 278-280-and 274 West Main can be drastically reduced if purchased as a Package deal
-
1999-02-03soldstatus $45,000
ⓘ Source: listings_history table (triggers on properties + properties_extension) + one-shot
backfill from property_details.listing_events for pre-trigger history.
Tax reassessment forecast NY · Partial reset (capped growth)
- Current annual tax
- $2,434 · $203/mo
- Projected year-2 tax
- $2,434 · $203/mo
- Expected delta
- $0/yr ($0/mo · 0.0%)
ⓘ Screening estimate from a state-policy table — verify with the county assessor before closing.
Climate risk First Street
- Flood 4/10 Moderate FEMA zone X · 20% chance over 30 yrs
- Wildfire 3/10 Moderate
- Heat 2/10 Low 7 d/yr ≥90°F today · 17 d/yr by 30 yrs out
- Wind 1/10 Low
- Air quality 1/10 Low 0 unhealthy d/yr today · 0 by 30 yrs out
Nearby sold comps map
Loading sold comps map…
Walkable amenities ~0.75 mi
Loading nearby amenities…
Taxation est. · year 1
- Rental income
- $11,923
- − Mortgage interest
- −$3,355
- − Property taxes
- −$2,434
- − Insurance
- −$300
- − Repairs & maintenance
- −$954
- − Management
- −$954
- − Depreciation
- −$1,743
- Taxable income
- $2,183
- Est. tax owed @ 24.0%
- −$524
- After-tax cash flow
- $2,392/yr
For passive investors: Depreciation is non-cash, so a rental often shows a tax loss while cash-flowing — sheltering income. Rental losses are passive: they offset passive income freely, and up to $25,000/yr can offset ordinary (W-2) income if you actively participate and your MAGI is under $100k (phasing out to $0 by $150k); unused losses carry forward. On sale, claimed depreciation is recaptured at up to 25%, and gains may owe capital-gains tax (a 1031 exchange can defer both). Figures are a year-1 estimate at your 24.0% rate — not tax advice; consult a CPA.
Schools (NCES district)
- District
- Malone Central School District
- NCES district ID
- 3618180
- Math proficiency
- 27% ▼ -16.00%
- Reading proficiency
- 29% ▼ -11.00%
- Median HH income
- $46,681
- Composite
- 24.23/100
- National rank
- #7725
- State rank
- #581 of 590 in NY
Livability — Malone
- Score
- 70/100
- State rank
- #437
- US rank
- #7656
Category grades
Schools grade is shown separately in the Schools card above.
Census & demographics
- Census place
- Malone, NY
- Population (ZIP)
- 12,842
Population outlook (Franklin County) Hauer SSP2
- Today (2025)
- 48,098 people
- By 2030
- 46,790 · -2.7%
- By 2040
- 44,400 · -7.7%
- By 2050
- 41,256 · -14.2%
- By 2075
- 32,190 · -33.1%
- By 2100
- 23,407 · -51.3%
Race, ethnicity, and origin ACS 2023
- Neighborhood character
- Predominantly White (83%)
- Race & ethnicity
- White 83% Black 9% Hispanic / Latino 6%
- Hispanic origin (detail)
- Puerto Rican 2%
- Common ancestry
- Lithuanian 16% Slovak 5% Italian 2%
- Foreign-born
- 3% · Canada
- Languages at home
- 94% English-only · Spanish 4% Other Indo-European 1% French/Haitian/Cajun 1%
Political lean MEDSL · Franklin
- 2024 margin
- Lean R (+9.0) · D 45.5% · R 54.5%
- 2008→2024 swing
- -31.2pp toward R · 2008: 22.2pp · 2024: -9.0pp
- All cycles
- 2024: R+9.0 2020: R+2.2 2016: R+7.4 2012: D+26.3 2008: D+22.2
Not yet ingested
- Civics
- —
Market trends
- HPI YoY
- ▲ 17.73%
- Current HPI
- 263.2406
- Rent YoY
- —
- Metro
- —
- State GDP YoY
- ▲ 2.60%
- F500 in state
- 92
Industry mix (Fortune 500 HQ in NY)
| Industry | F500 HQs | Revenue |
|---|---|---|
| Financial Services | 10 | $950B |
|
||
| Consumer Goods | 9 | $162B |
|
||
| Insurance | 4 | $225B |
|
||
| Telecommunications | 2 | $144B |
|
||
| Pharmaceuticals | 2 | $112B |
|
||
| Media / Entertainment | 2 | $69B |
|
||
Price history
+33.1% since first listed4 events — show timeline
- 2026-05-13 Price Changed $59,900 ACVMLS
- 2026-01-19 Price Changed $69,900 ACVMLS
- 2025-08-28 Listed $79,900 ACVMLS
- 1999-02-03 Sold (Public Records) $45,000 Public Records
Property tax history
+0.7%/yrLatest (2025): $2,434 · -0.7% YoY. Source: county tax records.
Cash-flow waterfall
monthlySold comps — $/sqft
last 12 mo · ≤1 miLoading sold comps…