121 Stewart St #1304 · Seattle, WA
Flood risk 1/10 · Minimal
- FEMA flood zone
- X (unshaded)
- Chance of flooding over 30 yrs
- 0.0%
- Est. flood insurance / yr
- $507 – $1,088
Fire risk 1/10 · Minimal
- Est. fire insurance / yr
- $604 – $1,122
Heat risk 3/10 · Minor
- Hot days now (above 86°F)
- 7 days/yr
- Hot days in 30 yrs
- 14 days/yr
Wind risk 1/10 · Minimal
- Chance of severe wind over 30 yrs
- —
Air-quality risk 7/10 · Major
- Unhealthy air days now
- 11 days/yr
- Unhealthy air days in 30 yrs
- 11 days/yr
Risk factors via First Street. Map © Google.
Why this score? — see what drove the D- grade
The composite is a weighted blend of 9 inputs, each scored 0–100. Each bar is that input's sub-score; the figure is the points it added to the 100-point composite (weight × sub-score).
- ARV discount +15.0/15.0
- Schools +6.1/10.0
- Appreciation +4.7/10.0
- Livability +3.8/5.0
- Cash flow +3.0/30.0
- Condition / age +2.5/5.0
- Rent growth +2.4/5.0
- 1% rule +1.5/10.0
- DSCR +0.0/10.0
$599,000
🖨 Deal sheet (PDF) 📄 Offer letter ✓ Due diligence
Listing remarks
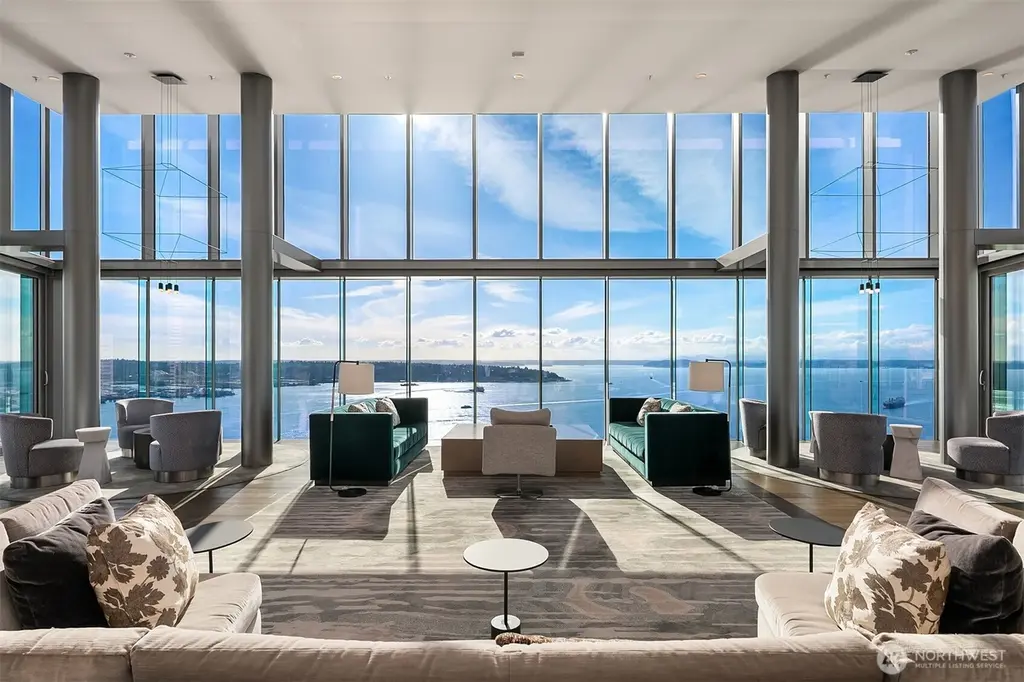
Sophisticated City Living with Private Terrace at The Emerald. Perched above the city with dynamic views of downtown this stunning home at offers a rare blend of indoor-outdoor living and sophisticated design. Featuring two enclosed bedrooms, floor-to-ceiling windows, custom wood cabinetry, hardwood floors, full-size washer/dryer, and Latch keyless entry, this residence delivers elevated urban living at its finest. Just blocks from Pike Place Market & Seattle’s waterfront. Enjoy resort-style amenities, including a state-of-the-art fitness center, yoga studio, pet run and spa, guest suite, and a full-floor rooftop lounge with indoor and outdoor gathering spaces—offering pro
Key facts
- Private terrace
- Latch keyless entry
- Dynamic views
Tags
Neighborhood map
What this means for you Summary
Snapshot
- This is a 2-bed/1.0-bath condo listed at $599k.
Deal economics
- At list price, monthly cash flow is $-2k ($-23k/yr) — negative.
- To cash-flow at today's rent, offer at most $257k (57.1% below list).
- To meet the 1% rule (rent ≥ 1% of price), the offer needs to be $389k (35.0% below list).
- Recommended offer: $257k (57.1% below list) — sets the bar for cash-flow.
- Cap rate 2.4% vs local median 1.6% in Seattle — top-decile yield for the area; either an underpriced asset or a hidden risk that comps aren't pricing in. Stress-test before assuming the spread holds.
Location & tenants
- Location reads 75/100 on livability (#166 in WA, #4,033 nationally) — a middle-class / working-renter tenant base. Strengths: amenities A+, commute A+, employment A+; Watch: crime F, cost of living F.
- Seattle Public Schools (urban): math 64% / reading 72% proficiency, ranked #19 of 291 in WA (top 6%) — acceptable for families but not a draw, mixed tenant base, ~2y average lease.
- Zoned schools: Hazel Wolf K-8 (720 students, 22% FRL); Mcclure Middle School (429 students, 19% FRL); Garfield High School (1,642 students, 40% FRL) — zoned schools at 27% FRL track the district average.
- Market conditions: Rents soft (-0.3%/yr); 155 active listings in the ZIP; 40 comparable units currently listed for rent nearby; rentals leasing fast (median 0d on market — plan ~1-2 weeks tenant-placement turnaround); high-income renter base; 10,555 units permitted in King County in 2024 (7,119 in 5+ unit buildings).
- This rent runs 36% of the median local income ($129k/yr) — at the standard rent-burdened threshold; future hikes will face affordability resistance.
Forward outlook
- In year one you build about $1k of equity ($4k loan paydown + $-3k appreciation (-0.5% local appreciation)).
- King County population projected at +44% by 2050 — long-run rental-demand tailwind backs the buy-and-hold thesis.
- By year 10, paydown + projected appreciation supports a ~$36k cash-out refi (75% LTV) — recoverable capital for the next deal without selling this one.
Negotiation context
- It's been on market 97 days — a 9% lower offer ($545k) is reasonable based on typical stale-listing flexibility.
- 2 sale attempts since 3y ago with the ask held roughly flat each time — persistent listings suggest the price (not the market) is what's stuck; bring a comps-based counter.
Risks & watch-outs
- Watch-outs: HOA is 30% of rent.
Questions for the listing agent
- What do current leases actually rent for vs. the listed asking? Can we see a recent rent roll and the last 12 months of T-12 income?
- It's been on market 97 days. Have you received any prior offers? Is the seller open to a 57% concession, seller financing, or rate buy-down credit?
- What does the HOA fee cover, when was the last increase, and are there any pending special assessments or reserve-fund shortfalls?
- Any open or pending special assessments — roof, HVAC, plumbing, elevator, façade? What's the per-unit balance and payoff schedule, and is the seller paying it off at close or rolling it to the buyer?
- Why hasn't it sold? Are there any deal-killer items the seller is aware of (foundation, flood, title, zoning, code violations)?
- Is there a deadline driving the sale (1031 exchange, divorce, estate, relocation)? That informs how much negotiation room exists.
- Schools are A-rated — typically a magnet for longer-tenancy family renters. What's the average tenant stay here, and is there a school-zone premium baked into asking?
- Crime grade is F in this area — have there been break-ins, vandalism, or insurance claims at this property in the last 3 years? What carrier currently insures it and at what premium?
- The area grade is low — what's the realistic commute time and amenity access for the typical tenant pool here? Any planned neighborhood developments (good or bad) we should know about?
- What's the average days-on-market for RENTAL listings here right now (not sales)? A rising rental-DOM trend means longer vacancies and softer asking-rent achievability than the comps imply.
- What's the recent tenant-quality profile in this submarket — average credit score on applications, eviction rate, late-payment / NSF rate, and stable-employment percentage? A property-management company in the area should have these aggregated.
- How much new apartment / multifamily construction is in the pipeline within 1–3 miles? Heavy new supply (>2% of stock underway) typically softens rents 12–24 months out; light construction supports rent growth.
Investment metrics
- 1% rule
- 0.65% ✗
- Cap rate
- 2.42%
- Cash-on-cash
- -13.84%
- DSCR
- 0.38
- GRM
- 12.8
CMA / ARV
- ARV (median comp)
- $931,253
- List price
- $599,000
- Delta
- -35.68%
- Verdict
- UNDERPRICED
- Comps
- 20 within 1.0 mi
Projected returns pro-forma
-0.52% appreciation · 0.0% rent growth · sell at horizon
- IRR
- -23.0%
- Equity multiple
- 0.01×
- Total profit
- $-166,107
- Equity at exit
- $158,468
- IRR
- -19.1%
- Equity multiple
- -0.68×
- Total profit
- $-282,465
- Equity at exit
- $178,547
Cash invested: $167,720 (down + closing). Projections, not guarantees.
Landlord ↔ Tenant lean methodology
- Overall (CITY)
- 0 Strongly Tenant-Friendly
- State Washington
- 28 Tenant-Leaning · D+8
- County
- — inherits STATE
- City Seattle
- 0 Strongly Tenant-Friendly · D+52
ZIP-level market 98101
- Home prices YoY
- -0.3%
- Rents YoY
- -0.3%
- Active inventory
- 155
- Price-to-rent
- 12.8×
Monthly cashflow live
- Estimated rent
- $3,894 high interval (Pro) →
- Mortgage (P&I)
- −$3,141
- Tax from tax record
- −$451 /mo · $5,414/yr
- Insurance
- −$250
- HOA
- −$1,169
- Vacancy / Maint / Mgmt
- −$818
- Net cashflow
- $-1,935
Break-even live
Sensitivity live
| Price | -10% $-1,596 | -5% $-1,765 | +0% $-1,935 | +5% $-2,104 | +10% $-2,274 |
|---|---|---|---|---|---|
| Rent | -10% $-2,242 | -5% $-2,089 | +0% $-1,935 | +5% $-1,781 | +10% $-1,627 |
| Rate | -1.0pp $-1,633 | -0.5pp $-1,783 | base $-1,935 | +0.5pp $-2,090 | +1.0pp $-2,248 |
UW: 25.0% down · 7.5% · 30yr · 1.5% tax · 5.0% vac · 8.0% maint · 8.0% mgmt
Financing live
Cash to close
- Down payment
- $149,750
- Closing costs
- $17,970
- Reserves months
- —
- Total cash needed
- —
Loan-product check · same deal, 3 products live
Conventional
25% down · 7.5% · 30yr
- Down + closing
- —
- Monthly P&I
- —
- Monthly cashflow
- —
- DSCR
- —
- Eligible?
- —
Personal DTI + credit; lowest rate.
DSCR
20% down · 8.5% · 30yr
- Down + closing
- —
- Monthly P&I
- —
- Monthly cashflow
- —
- DSCR
- —
- Eligible?
- —
No personal income docs; deal must DSCR.
Hard money
10% down · 12.0% · 12mo
- Down + closing
- —
- Monthly P&I
- —
- Monthly cashflow
- —
- DSCR
- —
- Eligible?
- —
Short-term bridge; refi at stabilization.
Rent comps 40 comps
| Address | Beds | Baths | Sqft | Rent | $/sqft | DOM | Units | Dist |
|---|---|---|---|---|---|---|---|---|
| 1915 2nd Ave Seattle, WA | 2.0 | 1.0–2.0 | 765 | $3,950 | $5.16 | 0d | 10 | 0.01mi |
| 121 Stewart St #807 Seattle, WA | 1.0 | 1.0 | 758 | $3,100 | $4.09 | 0d | 1 | 0.03mi |
| 121 Stewart St #1508 Seattle, WA | 1.0 | 1.0 | 590 | $2,400 | $4.07 | 9d | 1 | 0.03mi |
| 1900 1st Ave Seattle, WA | 1.0–2.0 | 1.0–2.0 | 658 | $3,565 | $5.41 | 0d | 17 | 0.04mi |
| 1900 1st Ave Seattle, WA | 1.0 | 1.0–1.5 | 703 | $3,142 | $4.47 | 26d | 11 | 0.04mi |
| 1600 2nd Ave Seattle, WA | 2.0 | 1.0–2.0 | 859 | $5,165 | $6.01 | 0d | 28 | 0.06mi |
| 2015 2nd Ave Seattle, WA | 2.0 | 1.0–2.0 | 879 | $4,648 | $5.29 | 0d | 29 | 0.08mi |
| 2033 2nd Ave Seattle, WA | 1.0 | 1.0 | 764 | $3,375 | $4.42 | 12d | 2 | 0.11mi |
| 2033 2nd Ave #1900 Seattle, WA | 1.0 | 1.0 | 928 | $4,000 | $4.31 | 4d | 1 | 0.12mi |
| 300 Virginia St Seattle, WA | 1.0 | 1.0 | 548 | $3,250 | $5.93 | 0d | 1 | 0.13mi |
| 300 Virginia St Seattle, WA | 2.0 | 2.0 | 940 | $5,100 | $5.43 | 3d | 1 | 0.13mi |
| 300 Virginia St Seattle, WA | 2.0 | 2.0 | 811 | $4,500 | $5.55 | 45d | 1 | 0.13mi |
| 300 Virginia St #3012 Seattle, WA | 1.0 | 1.0 | 548 | $3,250 | $5.93 | 4d | 1 | 0.13mi |
| 300 Virginia St #2602 Seattle, WA | 1.0 | 1.0 | 669 | $3,400 | $5.08 | 0d | 1 | 0.13mi |
| 1920 4th Ave Seattle, WA | 1.0 | 1.5 | 952 | $3,300 | $3.47 | 6d | 1 | 0.16mi |
| 1920 4th Ave Seattle, WA | 1.0–2.0 | 1.0–2.0 | 1432 | $7,950 | $5.55 | 26d | 3 | 0.16mi |
| 1920 4th Ave Seattle, WA | 1.0–2.0 | 1.0–2.0 | 1432 | $7,950 | $5.55 | 12d | 2 | 0.16mi |
| 1507 Western Ave #602 Seattle, WA | 1.0 | 1.0 | 872 | $3,950 | $4.53 | 0d | 1 | 0.17mi |
| 1430 2nd Ave Seattle, WA | 1.0–2.0 | 1.0–2.5 | 1286 | $10,944 | $8.51 | 0d | 22 | 0.17mi |
| 2014 4th Ave Seattle, WA | 1.0 | 1.0 | 629 | $1,495 | $2.38 | 0d | 1 | 0.18mi |
| 1415 2nd Ave Unit 979 Seattle, WA | 2.0 | 2.0 | 1006 | $4,080 | $4.06 | 0d | 1 | 0.19mi |
| 98 Union St #610 Seattle, WA | 1.0 | 1.0 | 577 | $1,695 | $2.94 | 0d | 1 | 0.21mi |
| 2125 1st Ave #1702 Seattle, WA | 2.0 | 1.5 | 1035 | $3,695 | $3.57 | 45d | 1 | 0.21mi |
| 2134 Western Ave Seattle, WA | 2.0 | 1.0–2.0 | 720 | $3,665 | $5.09 | 5d | 14 | 0.22mi |
| 2116 4th Ave Seattle, WA | 2.0 | 1.0–2.0 | 1164 | $4,495 | $3.86 | 16d | 19 | 0.24mi |
| 2116 4th Ave Seattle, WA | 1.0–2.0 | 1.0–2.0 | 922 | $4,850 | $5.26 | 0d | 21 | 0.24mi |
| 2105 5th Ave Seattle, WA | 2.0 | 1.0–2.0 | 837 | $4,433 | $5.30 | 0d | 6 | 0.24mi |
| 2201 3rd Ave Seattle, WA | 1.0 | 1.0 | 572 | $1,998 | $3.49 | 0d | 2 | 0.25mi |
| 2201 3rd Ave Seattle, WA | 1.0 | 1.0 | 537 | $2,000 | $3.72 | 16d | 2 | 0.25mi |
| 2217 3rd Ave Seattle, WA | 1.0 | 1.0 | 694 | $1,895 | $2.73 | 0d | 8 | 0.26mi |
| 2201 4th Ave Seattle, WA | 1.0–2.0 | 1.0–2.0 | 849 | $3,399 | $4.00 | 0d | 4 | 0.27mi |
| 2101 6th Ave Unit 1506175P Seattle, WA | 1.0 | 1.0 | 635 | $6,174 | $9.72 | 0d | 1 | 0.29mi |
| 2208 4th Ave Seattle, WA | 3.0 | 1.0–2.0 | 951 | $5,596 | $5.88 | 0d | 82 | 0.29mi |
| 2233 1st Ave Seattle, WA | 1.0 | 1.0 | 716 | $2,628 | $3.67 | 0d | 2 | 0.30mi |
| 1340 4th Ave Seattle, WA | 1.0–3.0 | 1.0–3.5 | 1773 | $14,145 | $7.98 | 0d | 24 | 0.30mi |
| 2132 5th Ave #9 Seattle, WA | 1.0 | 1.0 | 680 | $2,050 | $3.01 | 0d | 1 | 0.30mi |
| 1942 Westlake Ave Seattle, WA | 2.0 | 1.0–2.0 | 872 | $4,745 | $5.44 | 0d | 13 | 0.31mi |
| 206 Bell St Seattle, WA | 2.0 | 1.0 | 629 | $2,675 | $4.25 | 0d | 14 | 0.31mi |
| 50 University St Seattle, WA | 1.0–2.0 | 1.0–2.0 | 765 | $4,490 | $5.87 | 0d | 5 | 0.32mi |
| 304 Bell St Unit 1 Seattle, WA | 1.0 | 1.0 | 800 | $1,595 | $1.99 | 18d | 1 | 0.32mi |
HOA detail condo
- Monthly dues
- $1,169 · $14,028/yr
- Likely covers
- watergym
- Assessments
- None detected in remarks — confirm with the listing agent.
Listing history 27 events
-
2026-06-22days on market $599,000 Active 97 DOM
-
2026-06-21days on market $599,000 Active 96 DOM
-
2026-06-21days on market $599,000 Active 95 DOM
-
2026-06-19days on market $599,000 Active 94 DOM
-
2026-06-18days on market $599,000 Active 93 DOM
-
2026-06-17days on market $599,000 Active 92 DOM
-
2026-06-16days on market $599,000 Active 91 DOM
-
2026-06-15days on market $599,000 Active 90 DOM
-
2026-06-15days on market $599,000 Active 89 DOM
-
2026-06-13days on market $599,000 Active 88 DOM
-
2026-06-12days on market $599,000 Active 87 DOM
-
2026-06-10days on market $599,000 Active 85 DOM
-
2026-06-09days on market $599,000 Active 84 DOM
-
2026-06-08days on market $599,000 Active 83 DOM
-
2026-06-07days on market $599,000 Active 82 DOM
-
2026-06-07days on market $599,000 Active 81 DOM
-
2026-06-04days on market $599,000 Active 79 DOM
-
2026-06-03days on market $599,000 Active 78 DOM
-
2026-06-02days on market $599,000 Active 77 DOM
-
2026-06-01days on market $599,000 Active 76 DOM
-
2026-05-31days on market $599,000 Active 75 DOM
-
2026-05-19price $599,000
-
2026-03-17$614,900 Active
-
2023-06-08soldstatus $699,000 Closed
-
2023-06-08soldstatus $722,772
-
2023-05-10historical
-
2023-05-08$699,000
ⓘ Source: listings_history table (triggers on properties + properties_extension) + one-shot
backfill from property_details.listing_events for pre-trigger history.
Tax reassessment forecast WA · Resets to sale price
- Current annual tax
- $5,414 · $451/mo
- Projected year-2 tax
- $5,870 · $489/mo
- Expected delta
- +$456/yr (+$38/mo · 8.4%)
ⓘ Screening estimate from a state-policy table — verify with the county assessor before closing.
Climate risk First Street
- Flood 1/10 Low FEMA zone X (unshaded) · 0% chance over 30 yrs
- Wildfire 1/10 Low
- Heat 3/10 Moderate 7 d/yr ≥86°F today · 14 d/yr by 30 yrs out
- Wind 1/10 Low
- Air quality 7/10 Severe 11 unhealthy d/yr today · 11 by 30 yrs out
Nearby sold comps map
Loading sold comps map…
Walkable amenities ~0.75 mi
Loading nearby amenities…
Taxation est. · year 1
- Rental income
- $46,725
- − Mortgage interest
- −$33,553
- − Property taxes
- −$5,414
- − Insurance
- −$2,995
- − Repairs & maintenance
- −$3,738
- − Management
- −$3,738
- − HOA
- −$14,028
- − Depreciation
- −$17,425
- Taxable loss
- −$34,166
- Est. tax savings @ 24.0%
- +$8,200
- After-tax cash flow
- $-15,018/yr
For passive investors: Depreciation is non-cash, so a rental often shows a tax loss while cash-flowing — sheltering income. Rental losses are passive: they offset passive income freely, and up to $25,000/yr can offset ordinary (W-2) income if you actively participate and your MAGI is under $100k (phasing out to $0 by $150k); unused losses carry forward. On sale, claimed depreciation is recaptured at up to 25%, and gains may owe capital-gains tax (a 1031 exchange can defer both). Figures are a year-1 estimate at your 24.0% rate — not tax advice; consult a CPA.
Schools (NCES district)
- District
- Seattle Public Schools
- NCES district ID
- 5307710
- Math proficiency
- 64% ▼ -1.00%
- Reading proficiency
- 72% ▬ 0.00%
- Median HH income
- $68,695
- Composite
- 60.76/100
- National rank
- #1649
- State rank
- #19 of 291 in WA
Livability — Seattle
- Score
- 75/100
- State rank
- #166
- US rank
- #4033
Category grades
Schools grade is shown separately in the Schools card above.
Census & demographics
- Census place
- Seattle, WA
- County
- King County · 2,251,916 people
- City population
- 706,262
- Metro
- Seattle-Tacoma-Bellevue, WA
- Population (ZIP)
- 17,153
- Household income
- $128,882
- Rent vs Own
- Severe rent burden
- 1840.0
Population outlook (King County) Hauer SSP2
- Today (2025)
- 2,576,485 people
- By 2030
- 2,803,316 · +8.8%
- By 2040
- 3,255,921 · +26.4%
- By 2050
- 3,706,444 · +43.9%
- By 2075
- 4,746,063 · +84.2%
- By 2100
- 5,407,730 · +109.9%
Race, ethnicity, and origin ACS 2023
- Neighborhood character
- Diverse neighborhood (Simpson 0.64)
- Race & ethnicity
- White 48% Asian 35% Two or more races 7% Black 6% Hispanic / Latino 5%
- Hispanic origin (detail)
- Mexican 4%
- Common ancestry
- Italian 2% Slovak 2% Lithuanian 1%
- Foreign-born
- 38% · China, Canada, South Korea
- Languages at home
- 67% English-only · Other Indo-European 10% Chinese 8% Spanish 4%
Political lean MEDSL · King
- 2024 margin
- Solid D (+51.7) · D 74.2% · R 22.5% · Other 3.4%
- 2008→2024 swing
- +9.6pp toward D · 2008: 42.1pp · 2024: 51.7pp
- All cycles
- 2024: D+51.7 2020: D+52.7 2016: D+50.4 2012: D+39.9 2008: D+42.1
Not yet ingested
- Civics
- —
Market trends
- HPI YoY
- ▼ -0.52%
- Current HPI
- 193.0062
- Rent YoY
- ▼ -0.28%
- Metro
- Seattle-Tacoma-Bellevue, WA
- State GDP YoY
- ▲ 4.65%
- F500 in state
- 22
Industry mix (Fortune 500 HQ in WA)
| Industry | F500 HQs | Revenue |
|---|---|---|
| Retail | 2 | $269B |
|
||
| Technology / Retail | 1 | $638B |
|
||
| Technology | 1 | $245B |
|
||
| Telecommunications | 1 | $38B |
|
||
| Food / Beverage | 1 | $36B |
|
||
| Automotive / Trucks | 1 | $34B |
|
||
Price history
-14.3% since first listed6 events — show timeline
- 2026-05-19 Price Changed $599,000 NWMLS as Distributed by MLS Grid
- 2026-03-17 Listed $614,900 NWMLS as Distributed by MLS Grid
- 2023-06-08 Sold (Public Records) $722,772 Public Records
- 2023-06-08 Sold (MLS) $699,000 NWMLS as Distributed by MLS Grid
- 2023-05-10 Delisted — NWMLS as Distributed by MLS Grid
- 2023-05-08 Listed $699,000 NWMLS as Distributed by MLS Grid
Property tax history
-4.1%/yrLatest (2025): $5,414 · -17.0% YoY. Source: county tax records.
Cash-flow waterfall
monthlySold comps — $/sqft
last 12 mo · ≤1 miLoading sold comps…