4473 B St SE #103 · Washington, DC
Flood risk 6/10 · Moderate
- FEMA flood zone
- X (unshaded)
- Chance of flooding over 30 yrs
- 0.71%
- Est. flood insurance / yr
- $507 – $1,088
Fire risk 1/10 · Minimal
- Est. fire insurance / yr
- $631 – $1,173
Heat risk 8/10 · Major
- Hot days now (above 104°F)
- 7 days/yr
- Hot days in 30 yrs
- 15 days/yr
Wind risk 4/10 · Minor
- Chance of severe wind over 30 yrs
- 20.0%
Air-quality risk 4/10 · Minor
- Unhealthy air days now
- 4 days/yr
- Unhealthy air days in 30 yrs
- 5 days/yr
Risk factors via First Street. Map © Google.
Why this score? — see what drove the B grade
The composite is a weighted blend of 9 inputs, each scored 0–100. Each bar is that input's sub-score; the figure is the points it added to the 100-point composite (weight × sub-score).
- Cash flow +30.0/30.0
- 1% rule +10.0/10.0
- DSCR +10.0/10.0
- ARV discount +7.5/15.0
- Rent growth +4.0/5.0
- Livability +3.7/5.0
- Schools +3.6/10.0
- Condition / age +2.5/5.0
- Appreciation +0.0/10.0
$55,000
🖨 Deal sheet (PDF) 📄 Offer letter ✓ Due diligence
Listing remarks
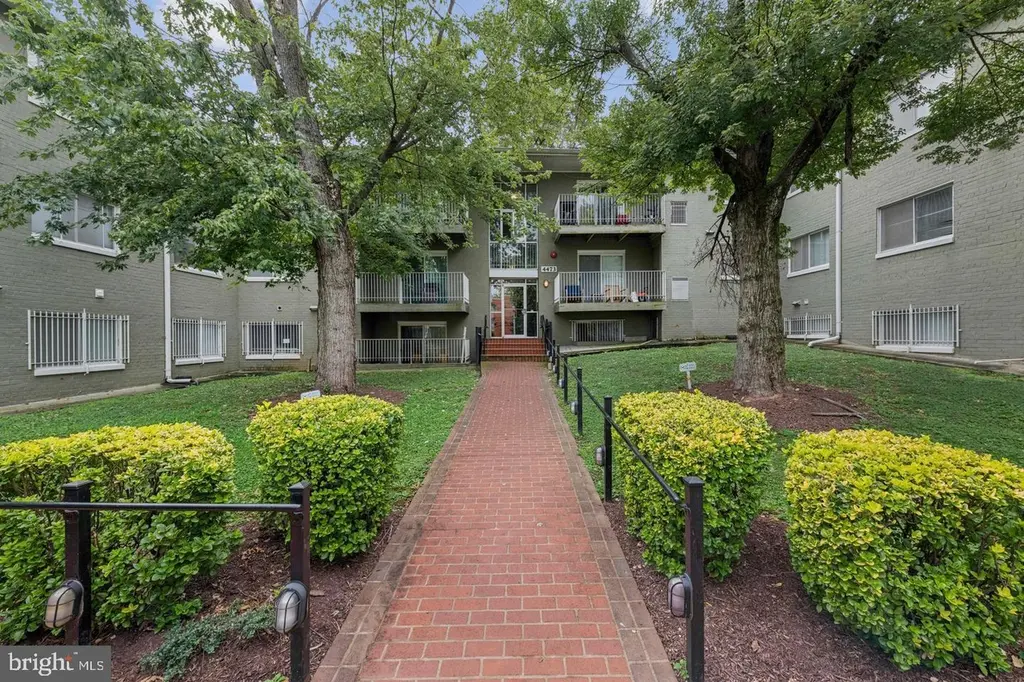
Perfect opportunity to own this unit in the Blackstone Flats Condominium. This unit offers a beautiful patio overlooking the peaceful treelined, an excellent open layout to work with and great usage of space. Nestled on a quiet street, this condo provides an exciting sense of tranquility in the District. The short commutes to Downtown DC and the beltway alike, residents have the benefit of comfortable living space and seamless access to all of the excitement Washington, DC has to offer. Local attractions consist of Fort Dupont Park, which is ideal for those who enjoy outdoor activities like hiking, picnicking, and attending summer concerts in this expansive park. Fort Circle Parks are a ser
Key facts
- Beautiful patio
- Quiet street
- Open layout
Tags
Property features AI
Finance
- Other: Property managed by a property manager
- HOA & community: Condo fee $380 monthly (includes other items/amenities)
Exterior
- Parking: Other parking
- Utilities: Public water; Public septic
- Home design: Condominium unit/flat; Entry on level 1
- Construction: Brick construction; Above-grade and below-grade structures
- Exterior features: Garden-style building (1–4 floors); Tidal water: No; Pets allowed on a case-by-case basis
Interior
- Bedrooms: 3 bedrooms on main level
- Bathrooms: 1 full bathroom on main level
- Heating & cooling: Central heating (electric); Central air conditioning (electric); Electric hot water
- Interior features: No basement; Living area per assessor
- Laundry & utility: No washer/dryer hookups in unit
Neighborhood map
What this means for you Summary
Snapshot
- This is a 3-bed/1.0-bath condo listed at $55k.
Deal economics
- At list price, monthly cash flow is $803 ($10k/yr) — positive.
- The deal already cash-flows at list — no discount required.
- Meets the 1% rule at list price ($2k rent vs $55k).
- Recommended offer: $52k (6.0% below list) — sets the bar for market timing.
- Cap rate 23.8% vs local median 2.5% in Washington — top-decile yield for the area; either an underpriced asset or a hidden risk that comps aren't pricing in. Stress-test before assuming the spread holds.
Location & tenants
- Location reads 73/100 on livability (#1 in DC) — a middle-class / working-renter tenant base. Strengths: amenities A+, commute A+, employment A+; Watch: crime F, cost of living F.
- District Of Columbia Public Schools (urban): math 33% / reading 40% proficiency, ranked #8 of 32 in DC (top 25%) — families likely to look elsewhere, expect single-tenant / working-renter base with shorter leases; 65% free/reduced lunch — lower-income household profile, screen leases tightly.
- Market conditions: Rents rising fast (+6.1%/yr); 281 active listings in the ZIP; 40 comparable units currently listed for rent nearby; rentals at typical pace (median 26d on market — plan ~3-4 weeks tenant-placement turnaround); 1,737 units permitted in District of Columbia in 2024 (1,506 in 5+ unit buildings).
- This rent runs 44% of the median local income ($58k/yr) — at the standard rent-burdened threshold; future hikes will face affordability resistance.
Forward outlook
- Local home prices are declining (-3.0%/yr); year-one equity from $380 of loan paydown is wiped out by about $2k of value loss. Plan a longer hold.
- District of Columbia County population projected at +50% by 2050 — long-run rental-demand tailwind backs the buy-and-hold thesis.
- At projected returns (-3.0% appreciation + 6.1% rent growth), your $15k cash investment doubles in ~2 years — after that, you're playing with house money.
Negotiation context
- It's been on market 73 days — a 6% lower offer ($52k) is reasonable based on typical stale-listing flexibility.
- 3 sale attempts; this cycle's ask has dropped $10k (15%) from the opening price — seller is motivated, your offer sets the floor, not the list.
Risks & watch-outs
- Watch-outs: property tax is 3.9% of price.
- Climate carrying-cost: major flood risk; extreme-heat days projected 7→15/yr by 2055 (HVAC capex compounding) — expect insurance premiums to compound above CPI over the hold.
Questions for the listing agent
- It's been on market 73 days. Have you received any prior offers? Is the seller open to a 6% concession, seller financing, or rate buy-down credit?
- Built in 1968 — when were the roof, HVAC, electrical panel, plumbing, and water heater last replaced?
- Property tax is high relative to price — has the assessment been appealed recently, and will the sale trigger a re-assessment?
- What does the HOA fee cover, when was the last increase, and are there any pending special assessments or reserve-fund shortfalls?
- Any open or pending special assessments — roof, HVAC, plumbing, elevator, façade? What's the per-unit balance and payoff schedule, and is the seller paying it off at close or rolling it to the buyer?
- Why hasn't it sold? Are there any deal-killer items the seller is aware of (foundation, flood, title, zoning, code violations)?
- Is there a deadline driving the sale (1031 exchange, divorce, estate, relocation)? That informs how much negotiation room exists.
- Crime grade is F in this area — have there been break-ins, vandalism, or insurance claims at this property in the last 3 years? What carrier currently insures it and at what premium?
- What's the average days-on-market for RENTAL listings here right now (not sales)? A rising rental-DOM trend means longer vacancies and softer asking-rent achievability than the comps imply.
- What's the recent tenant-quality profile in this submarket — average credit score on applications, eviction rate, late-payment / NSF rate, and stable-employment percentage? A property-management company in the area should have these aggregated.
- How much new apartment / multifamily construction is in the pipeline within 1–3 miles? Heavy new supply (>2% of stock underway) typically softens rents 12–24 months out; light construction supports rent growth.
Investment metrics
- 1% rule
- 3.86% ✓
- Cap rate
- 23.82%
- Cash-on-cash
- 62.59%
- DSCR
- 3.78
- GRM
- 2.2
CMA / ARV
No comps found within radius.
Projected returns pro-forma
-3.0% appreciation · 6.06% rent growth · sell at horizon
- IRR
- 66.6%
- Equity multiple
- 4.20×
- Total profit
- $49,310
- Equity at exit
- $8,201
- IRR
- 72.2%
- Equity multiple
- 10.06×
- Total profit
- $139,580
- Equity at exit
- $4,755
Cash invested: $15,400 (down + closing). Projections, not guarantees.
Landlord ↔ Tenant lean methodology
- Overall (CITY)
- 0 Strongly Tenant-Friendly
- State District of Columbia
- 12 Strongly Tenant-Friendly · D+43
- County
- — inherits STATE
- City Washington
- 0 Strongly Tenant-Friendly · D+43
ZIP-level market 20019
- Rents YoY
- 6.1%
- Active inventory
- 281
- Price-to-rent
- 2.2×
Monthly cashflow live
- Estimated rent
- $2,121 high interval (Pro) →
- Mortgage (P&I)
- −$288
- Tax from tax record
- −$181 /mo · $2,172/yr
- Insurance
- −$23
- HOA
- −$380
- Vacancy / Maint / Mgmt
- −$445
- Net cashflow
- $803
Break-even live
Sensitivity live
| Price | -10% $834 | -5% $819 | +0% $803 | +5% $788 | +10% $772 |
|---|---|---|---|---|---|
| Rent | -10% $636 | -5% $719 | +0% $803 | +5% $887 | +10% $971 |
| Rate | -1.0pp $831 | -0.5pp $817 | base $803 | +0.5pp $789 | +1.0pp $774 |
UW: 25.0% down · 7.5% · 30yr · 1.5% tax · 5.0% vac · 8.0% maint · 8.0% mgmt
Financing live
Cash to close
- Down payment
- $13,750
- Closing costs
- $1,650
- Reserves months
- —
- Total cash needed
- —
Loan-product check · same deal, 3 products live
Conventional
25% down · 7.5% · 30yr
- Down + closing
- —
- Monthly P&I
- —
- Monthly cashflow
- —
- DSCR
- —
- Eligible?
- —
Personal DTI + credit; lowest rate.
DSCR
20% down · 8.5% · 30yr
- Down + closing
- —
- Monthly P&I
- —
- Monthly cashflow
- —
- DSCR
- —
- Eligible?
- —
No personal income docs; deal must DSCR.
Hard money
10% down · 12.0% · 12mo
- Down + closing
- —
- Monthly P&I
- —
- Monthly cashflow
- —
- DSCR
- —
- Eligible?
- —
Short-term bridge; refi at stabilization.
Rent comps 40 comps
| Address | Beds | Baths | Sqft | Rent | $/sqft | DOM | Units | Dist |
|---|---|---|---|---|---|---|---|---|
| 4473 B St SE #304 Washington, DC | 2.0 | 1.0 | 775 | $1,999 | $2.58 | 23d | 1 | 0.03mi |
| 4427 A St SE Unit 1 Washington, DC | 2.0 | 1.0 | 920 | $1,900 | $2.07 | 25d | 1 | 0.08mi |
| 4511 B St SE Washington, DC | 1.0–2.0 | 1.0 | 675 | $1,650 | $2.44 | 25d | 2 | 0.13mi |
| 4805 Texas Ave SE Washington, DC | 1.0–2.0 | 1.0 | 775 | $1,400 | $1.81 | 25d | 1 | 0.13mi |
| 4615 Central Ave NE Unit B Washington, DC | 2.0 | 1.0 | 875 | $1,450 | $1.66 | 25d | 1 | 0.24mi |
| 4820 C St SE #304 Washington, DC | 2.0 | 1.0 | 635 | $1,600 | $2.52 | 25d | 1 | 0.27mi |
| 324 Saint Louis St SE Washington, DC | 2.0 | 1.0 | 640 | $1,750 | $2.73 | 8d | 1 | 0.33mi |
| 4601 Blaine St NE Unit 1 Washington, DC | 2.0 | 1.0 | 750 | $1,500 | $2.00 | 25d | 1 | 0.33mi |
| 44 49th St SE Unit A1 Washington, DC | 3.0 | 1.0 | 793 | $2,499 | $3.15 | 25d | 1 | 0.34mi |
| 4919 A St SE Unit 202 Washington, DC | 2.0 | 1.0 | 625 | $1,900 | $3.04 | 25d | 1 | 0.38mi |
| 4930 A St SE Unit 203 Washington, DC | 3.0 | 1.0 | 750 | $2,815 | $3.75 | 25d | 1 | 0.39mi |
| 608 Chaplin St SE Washington, DC | 3.0 | 2.0 | 832 | $2,200 | $2.64 | 19d | 1 | 0.40mi |
| 4932 A St SE #302 Washington, DC | 2.0 | 2.0 | 1007 | $2,495 | $2.48 | 5d | 1 | 0.41mi |
| 225 43rd Rd NE Unit 203 Washington, DC | 3.0 | 1.5 | 900 | $2,200 | $2.44 | 25d | 1 | 0.41mi |
| 4110 Ames St NE #14 Washington, DC | 2.0 | 1.0 | 1098 | $1,850 | $1.68 | 25d | 1 | 0.42mi |
| 229 43rd Rd NE Washington, DC | 2.0 | 1.0 | 800 | $1,500 | $1.88 | 19d | 1 | 0.43mi |
| 4040 E Capitol St NE Washington, DC | 1.0–2.0 | 1.0–1.5 | 716 | $1,608 | $2.24 | 8d | 1 | 0.43mi |
| 4332 Gorman Ter SE Washington, DC | 2.0 | 1.0 | 832 | $2,350 | $2.82 | 23d | 1 | 0.44mi |
| 5005 D St SE #104 Washington, DC | 2.0 | 1.0 | 772 | $1,700 | $2.20 | 6d | 1 | 0.46mi |
| 3738 D St SE Washington, DC | 1.0–2.0 | 1.0 | 542 | $1,549 | $2.86 | 0d | 11 | 0.59mi |
| 4255 Eads St NE Unit 3 Washington, DC | 2.0 | 1.0 | 610 | $1,750 | $2.87 | 23d | 1 | 0.59mi |
| 5124 Astor Pl SE Washington, DC | 2.0 | 1.0 | 700 | $1,100 | $1.57 | 25d | 1 | 0.60mi |
| 5119 E St SE Washington, DC | 3.0 | 1.0 | 941 | $4,000 | $4.25 | 20d | 1 | 0.63mi |
| 4213 Hildreth St SE Washington, DC | 2.0 | 1.5 | 832 | $2,500 | $3.00 | 25d | 1 | 0.67mi |
| 1193 46th Pl SE Washington, DC | 3.0 | 1.0 | 1056 | $3,200 | $3.03 | 25d | 1 | 0.69mi |
| 4930 Eads Pl NE Washington, DC | 3.0 | 1.5 | 1054 | $2,400 | $2.28 | 25d | 1 | 0.70mi |
| 4241 Foote St NE Unit 102 Washington, DC | 2.0 | 1.0 | 811 | $2,200 | $2.71 | 5d | 1 | 0.73mi |
| 4241 Foote St NE Apt 301 Washington, DC | 3.0 | 1.0 | 909 | $2,925 | $3.22 | 5d | 1 | 0.73mi |
| 5344 C St SE Unit 102 Washington, DC | 3.0 | 2.0 | 1000 | $2,499 | $2.50 | 25d | 1 | 0.74mi |
| 5344 C St SE Unit 302 Washington, DC | 3.0 | 2.0 | 1000 | $2,100 | $2.10 | 25d | 1 | 0.74mi |
| 556 49th Pl NE Washington, DC | 3.0 | 3.0 | 894 | $3,475 | $3.89 | 25d | 1 | 0.75mi |
| 300 37th St SE Unit 101 Washington, DC | 2.0 | 1.0 | 850 | $1,550 | $1.82 | 25d | 1 | 0.80mi |
| 5401 Call Pl SE Washington, DC | 2.0–3.0 | 1.0 | 1094 | $2,626 | $2.40 | 3d | 2 | 0.80mi |
| 4651 Nannie Helen Burroughs Ave NE Washington, DC | 1.0–2.0 | 1.0 | 663 | $1,749 | $2.64 | 6d | 3 | 0.82mi |
| 599 50th St NE Washington, DC | 1.0–2.0 | 1.0–2.0 | 775 | $2,081 | $2.69 | 25d | 1 | 0.83mi |
| 305 37th St SE Washington, DC | 1.0–2.0 | 1.0–1.5 | 787 | $1,550 | $1.97 | 25d | 1 | 0.83mi |
| 405 Division Ave NE Unit 201 Washington, DC | 2.0 | 1.0 | 656 | $1,197 | $1.82 | 18d | 1 | 0.85mi |
| 212 36th St NE #1 Washington, DC | 2.0 | 1.0 | 750 | $2,550 | $3.40 | 25d | 1 | 0.86mi |
| 212 36th St NE #3 Washington, DC | 3.0 | 1.0 | 750 | $3,450 | $4.60 | 25d | 1 | 0.86mi |
| 5225 Dix St NE Washington, DC | 2.0 | 1.0 | 800 | $1,500 | $1.88 | 23d | 1 | 0.87mi |
HOA detail condo
- Monthly dues
- $380 · $4,560/yr
- Assessments
- None detected in remarks — confirm with the listing agent.
Listing history 22 events
-
2026-06-21days on market $55,000 Active 73 DOM
-
2026-06-18days on market $55,000 Active 70 DOM
-
2026-06-17days on market $55,000 Active 69 DOM
-
2026-06-16days on market $55,000 Active 68 DOM
-
2026-06-15days on market $55,000 Active 67 DOM
-
2026-06-13days on market $55,000 Active 65 DOM
-
2026-06-10price $55,000 Active 61 DOM
-
2026-06-09days on market $60,000 Active 61 DOM
-
2026-06-08days on market $60,000 Active 60 DOM
-
2026-06-07days on market $60,000 Active 59 DOM
-
2026-06-04days on market $60,000 Active 56 DOM
-
2026-06-03days on market $60,000 Active 55 DOM
-
2026-06-02days on market $60,000 Active 54 DOM
-
2026-06-01days on market $60,000 Active 53 DOM
-
2026-05-31days on market $60,000 Active 52 DOM
-
2026-05-08price $60,000
-
2026-04-09$65,000 Active
-
2025-05-23historical
-
2025-05-16price $58,000
-
2025-05-16status Active
-
2025-02-01historical
-
2025-01-28$88,000 Active
ⓘ Source: listings_history table (triggers on properties + properties_extension) + one-shot
backfill from property_details.listing_events for pre-trigger history.
Tax reassessment forecast DC · Partial reset (capped growth)
- Current annual tax
- $2,172 · $181/mo
- Projected year-2 tax
- $2,172 · $181/mo
- Expected delta
- $0/yr ($0/mo · 0.0%)
ⓘ Screening estimate from a state-policy table — verify with the county assessor before closing.
Climate risk First Street
- Flood 6/10 Major FEMA zone X (unshaded) · 71% chance over 30 yrs
- Wildfire 1/10 Low
- Heat 8/10 Severe 7 d/yr ≥104°F today · 15 d/yr by 30 yrs out
- Wind 4/10 Moderate 20% chance of damaging wind over 30 yrs
- Air quality 4/10 Moderate 4 unhealthy d/yr today · 5 by 30 yrs out
Nearby sold comps map
Loading sold comps map…
Walkable amenities ~0.75 mi
Loading nearby amenities…
Taxation est. · year 1
- Rental income
- $25,451
- − Mortgage interest
- −$3,081
- − Property taxes
- −$2,172
- − Insurance
- −$275
- − Repairs & maintenance
- −$2,036
- − Management
- −$2,036
- − HOA
- −$4,560
- − Depreciation
- −$1,600
- Taxable income
- $9,692
- Est. tax owed @ 24.0%
- −$2,326
- After-tax cash flow
- $7,313/yr
For passive investors: Depreciation is non-cash, so a rental often shows a tax loss while cash-flowing — sheltering income. Rental losses are passive: they offset passive income freely, and up to $25,000/yr can offset ordinary (W-2) income if you actively participate and your MAGI is under $100k (phasing out to $0 by $150k); unused losses carry forward. On sale, claimed depreciation is recaptured at up to 25%, and gains may owe capital-gains tax (a 1031 exchange can defer both). Figures are a year-1 estimate at your 24.0% rate — not tax advice; consult a CPA.
Schools (NCES district)
- District
- District Of Columbia Public Schools
- NCES district ID
- 1100030
- Math proficiency
- 33% ▲ 3.00%
- Reading proficiency
- 40% ▲ 5.00%
- Median HH income
- $67,671
- Composite
- 35.84/100
- National rank
- #9606
- State rank
- #8 of 32 in DC
Livability — Washington
- Score
- 73/100
- State rank
- #1
- US rank
- #5327
Category grades
Schools grade is shown separately in the Schools card above.
Census & demographics
- Census place
- Washington, DC
- County
- District of Columbia · 671,873 people
- City population
- 671,873
- Metro
- Washington-Arlington-Alexandria, DC-VA-MD-WV
- Population (ZIP)
- 63,380
- Household income
- $58,296
- Rent vs Own
- Severe rent burden
- 5115.0
Population outlook (District of Columbia County) Hauer SSP2
- Today (2025)
- 821,926 people
- By 2030
- 899,517 · +9.4%
- By 2040
- 1,061,162 · +29.1%
- By 2050
- 1,231,493 · +49.8%
- By 2075
- 1,603,312 · +95.1%
- By 2100
- 1,847,141 · +124.7%
Race, ethnicity, and origin ACS 2023
- Neighborhood character
- Predominantly Black (87%)
- Race & ethnicity
- Black 87% Hispanic / Latino 7% Two or more races 4% White 2%
- Hispanic origin (detail)
- Mexican 1% Dominican 1%
- Foreign-born
- 6% · Canada
- Languages at home
- 91% English-only · Spanish 6% French/Haitian/Cajun 1%
Political lean MEDSL · District of Columbia
- 2024 margin
- Solid D (+86.1) · D 91.2% · R 5.1% · Other 3.8%
- 2008→2024 swing
- +0.1pp no change · 2008: 85.9pp · 2024: 86.1pp
- All cycles
- 2024: D+86.1 2020: D+86.8 2016: D+88.7 2012: D+84.2 2008: D+85.9
Not yet ingested
- Civics
- —
Market trends
- HPI YoY
- ▼ -416.91%
- Current HPI
- 326.4481
- Rent YoY
- ▲ 6.06%
- Metro
- Washington-Arlington-Alexandria, DC-VA-MD-WV
- State GDP YoY
- ▲ 1.33%
- F500 in state
- 6
Industry mix (Fortune 500 HQ in DC)
| Industry | F500 HQs | Revenue |
|---|---|---|
| Financial Services | 1 | $153B |
|
||
| Life Sciences / Industrials | 1 | $25B |
|
||
| Industrial Machinery | 1 | $8B |
|
||
Price history
-31.8% since first listed7 events — show timeline
- 2026-05-08 Price Changed $60,000 BRIGHT MLS
- 2026-04-09 Listed $65,000 BRIGHT MLS
- 2025-05-23 Listing Removed — BRIGHT MLS
- 2025-05-16 Price Changed $58,000 BRIGHT MLS
- 2025-05-16 Relisted — BRIGHT MLS
- 2025-02-01 Listing Removed — BRIGHT MLS
- 2025-01-28 Listed $88,000 BRIGHT MLS
Property tax history
+3.7%/yrLatest (2025): $2,172 · -0.6% YoY. Source: county tax records.
Cash-flow waterfall
monthlySold comps — $/sqft
last 12 mo · ≤1 miLoading sold comps…