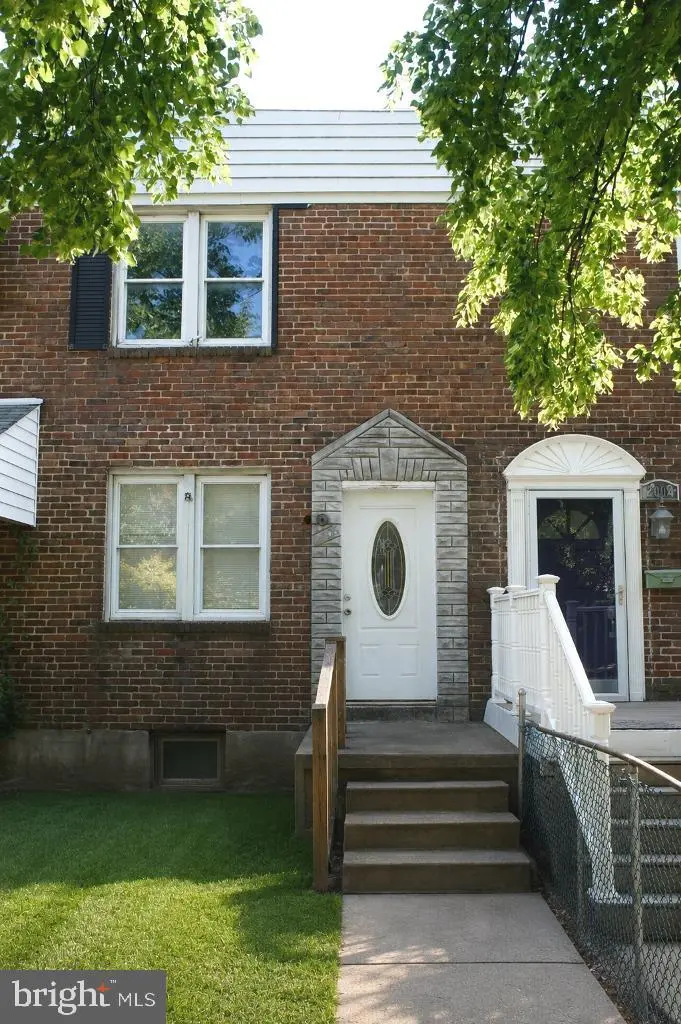
2006 Whistler Ave · Baltimore, MD
Flood risk 1/10 · Minimal
- FEMA flood zone
- X (unshaded)
- Chance of flooding over 30 yrs
- 0.0%
- Est. flood insurance / yr
- $473 – $860
Fire risk 1/10 · Minimal
- Est. fire insurance / yr
- $755 – $1,403
Heat risk 7/10 · Major
- Hot days now (above 103°F)
- 7 days/yr
- Hot days in 30 yrs
- 15 days/yr
Wind risk 6/10 · Moderate
- Chance of severe wind over 30 yrs
- 27.0%
Air-quality risk 3/10 · Minor
- Unhealthy air days now
- 3 days/yr
- Unhealthy air days in 30 yrs
- 4 days/yr
Risk factors via First Street. Map © Google.
Why this score? — see what drove the B grade
The composite is a weighted blend of 9 inputs, each scored 0–100. Each bar is that input's sub-score; the figure is the points it added to the 100-point composite (weight × sub-score).
- Cash flow +30.0/30.0
- ARV discount +15.0/15.0
- 1% rule +10.0/10.0
- DSCR +10.0/10.0
- Livability +3.8/5.0
- Condition / age +2.5/5.0
- Rent growth +2.2/5.0
- Schools +1.0/10.0
- Appreciation +0.0/10.0
$84,500
🖨 Deal sheet 📄 Offer letter ✓ Due diligence
Listing remarks
Brick Front Morrell Park Colonial Style Townhouse with lot's of potential for your new place. Traditional floor plan ready for your investment ideas to make it awesome. Located in one of the better spots in the community that backs to open area with parking availability and a fenced lot too. Replacement windows and mostly ready to go for quick updates to make a great new home for you or a smart investment opportunity. Seller selling as is at this price. Come see it today and make a great deal on your new home.
Key facts
- Brick front
- Colonial style
- Fenced lot
Tags
Property features AI
Finance
- Other: Total below-grade area includes finished and unfinished space; Finished above-grade area and below-grade finished area reported by assessor
- Financial info: Owner has fee simple interest
- HOA & community: Ground rent paid annually
Exterior
- Parking: Public on-street parking
- Utilities: Public water; Public sewer; Natural gas hot water; Natural gas heating fuel; Electric cooling
- Home design: Interior townhouse/rowhouse; Fee simple ownership; Not in a federal flood zone
- Construction: Brick construction; Rubber roof; Concrete perimeter foundation; Vinyl-clad windows; Above-grade and below-grade structures; Basement present
- Exterior features: Sidewalks; Backs to trees
Interior
- Kitchen: Refrigerator; Stove
- Bedrooms: Two bedrooms on the upper level
- Flooring: Wood floors
- Bathrooms: One full bathroom (upper level)
- Heating & cooling: Radiator heat (natural gas); Central air conditioning (electric)
- Interior features: Tub with shower; Dining area; Traditional floor plan; Drywall walls and ceilings
- Laundry & utility: Washer; Dryer; Connecting stairway to basement
Neighborhood map
What this means for you Summary
Snapshot
- This is a 2-bed/1.0-bath townhouse listed at $84k.
Deal economics
- At list price, monthly cash flow is $686 ($8k/yr) — positive.
- The deal already cash-flows at list — no discount required.
- Meets the 1% rule at list price ($2k rent vs $84k).
- Recommended offer: $83k (1.5% below list) — sets the bar for market timing.
- Cap rate 16.0% vs local median 6.0% in Baltimore — top-decile yield for the area; either an underpriced asset or a hidden risk that comps aren't pricing in. Stress-test before assuming the spread holds.
Location & tenants
- Location reads 76/100 on livability (#90 in MD, #3,396 nationally) — a middle-class / working-renter tenant base. Strengths: amenities A+, commute A+, housing A+; Watch: schools D, crime F.
- Baltimore City Public Schools (urban): math 7% / reading 16% proficiency, ranked #24 of 24 in MD (top 100%) — low school quality limits family demand, transient renter base, plan for 1-2y turnover; 79% free/reduced lunch — lower-income household profile, screen leases tightly.
- Market conditions: Rents soft (-1.0%/yr); 362 active listings in the ZIP; 29 comparable units currently listed for rent nearby; rentals at typical pace (median 24d on market — plan ~3-4 weeks tenant-placement turnaround); solid renter incomes; 1,273 units permitted in Baltimore city in 2024 (1,104 in 5+ unit buildings).
Forward outlook
- Local home prices are declining (-3.0%/yr); year-one equity from $584 of loan paydown is wiped out by about $3k of value loss. Plan a longer hold.
- Baltimore County population projected to shrink 4% by 2050 — rents likely to lag national; underwrite the cash flow, not the appreciation.
- At projected returns (-3.0% appreciation + 0.0% rent growth), your $24k cash investment doubles in ~4 years — after that, you're playing with house money.
Negotiation context
- It's been on market 21 days — a 2% lower offer ($83k) is reasonable based on typical stale-listing flexibility.
- 2 sale attempts since 25y ago; this cycle's ask has dropped $15k (15%) from the opening price — seller is motivated, your offer sets the floor, not the list.
- Current owner paid $20k; list at $84k implies a 322% gain — meaningful room to come down on a strong offer.
Risks & watch-outs
- Watch-outs: built in 1951 — expect roof / HVAC / electrical / plumbing capex.
- Climate carrying-cost: major wind risk, 27% chance of damaging wind over 30y; extreme-heat days projected 7→15/yr by 2055 (HVAC capex compounding) — expect insurance premiums to compound above CPI over the hold.
Questions for the listing agent
- Built in 1951 — when were the roof, HVAC, electrical panel, plumbing, and water heater last replaced?
- Is there a deadline driving the sale (1031 exchange, divorce, estate, relocation)? That informs how much negotiation room exists.
- Schools are D-rated, which usually means shorter tenancies and higher turnover. Who's the typical renter profile here, and what's been the actual vacancy rate?
- Crime grade is F in this area — have there been break-ins, vandalism, or insurance claims at this property in the last 3 years? What carrier currently insures it and at what premium?
- What's the average days-on-market for RENTAL listings here right now (not sales)? A rising rental-DOM trend means longer vacancies and softer asking-rent achievability than the comps imply.
- What's the recent tenant-quality profile in this submarket — average credit score on applications, eviction rate, late-payment / NSF rate, and stable-employment percentage? A property-management company in the area should have these aggregated.
- How much new for-sale + rental construction is in the pipeline within 1–3 miles? Heavy new supply typically softens prices + rents 12–24 months out; constrained supply supports both.
Investment metrics
- 1% rule
- 1.94% ✓
- Cap rate
- 16.03%
- Cash-on-cash
- 34.79%
- DSCR
- 2.55
- GRM
- 4.3
CMA / ARV
- ARV (on-the-fly)
- $133,980
- Comps found
- 12
Show comp detail 12 sales within ~0.75 mi
| Address | Dist | Beds/Ba | Sqft | Sold | Price | $/sf | Match |
|---|---|---|---|---|---|---|---|
| 2149 Harman Ave | 0.17mi | 2/1.0 | 1,050 (+3%) | 2mo | $115,000 | $110 | 84 |
| 1931 Griffis Ave | 0.18mi | 2/1.0 | 912 (-10%) | 0mo | $120,000 | $132 | 75 |
| 1935 Grinnalds Ave | 0.12mi | 3/2.0 (+1) | 1,080 (+6%) | 1mo | $119,000 | $110 | 74 |
| 1710 Wickes Ave | 0.30mi | 3/2.0 (+1) | 1,024 (+1%) | 3mo | $150,000 | $146 | 73 |
| 2809 Washington Blvd | 0.27mi | 3/1.0 (+1) | 1,110 (+9%) | 3mo | $80,000 | $72 | 64 |
| 2036 Deering Ave | 0.23mi | 3/1.5 (+1) | 1,112 (+10%) | 3mo | $129,900 | $117 | 64 |
| 3034 Lorena Ave | 0.69mi | 3/1.0 (+1) | 1,024 (+1%) | 1mo | $153,000 | $149 | 60 |
| 2619 Northshire Dr | 0.70mi | 3/1.0 (+1) | 1,024 (+1%) | 2mo | $145,000 | $142 | 59 |
| 2628 Northshire Dr | 0.74mi | 3/1.0 (+1) | 1,024 (+1%) | 4mo | $175,000 | $171 | 56 |
| 2839 Hinsdale Dr | 0.74mi | 3/1.0 (+1) | 1,024 (+1%) | 4mo | $152,000 | $148 | 55 |
| 2521 S Paca St | 0.37mi | 3/1.5 (+1) | 1,152 (+14%) | 1mo | $30,000 | $26 | 52 |
| 2639 Northshire Dr | 0.73mi | 3/2.0 (+1) | 1,024 (+1%) | 5mo | $120,000 | $117 | 51 |
Match score weights: distance 35% · size 25% · config 20% · recency 20%. Top-matched comps best support the ARV.
Projected returns pro-forma
-3.0% appreciation · 0.0% rent growth · sell at horizon
- IRR
- 26.8%
- Equity multiple
- 2.07×
- Total profit
- $25,218
- Equity at exit
- $12,599
- IRR
- 32.5%
- Equity multiple
- 3.53×
- Total profit
- $59,770
- Equity at exit
- $7,306
Cash invested: $23,660 (down + closing). Projections, not guarantees.
Landlord ↔ Tenant lean methodology
- Overall (CITY)
- 12 Strongly Tenant-Friendly
- State Maryland
- 27 Tenant-Leaning · D+14
- County
- — inherits STATE
- City Baltimore
- 12 Strongly Tenant-Friendly · D+58
ZIP-level market 21230
- Rents YoY
- -1.0%
- Active inventory
- 362
- Price-to-rent
- 4.3×
Monthly cashflow live
- Estimated rent
- $1,643 high interval (Pro) →
- Mortgage (P&I)
- −$443
- Tax from tax record
- −$134 /mo · $1,607/yr
- Insurance
- −$35
- HOA
- −$0
- Vacancy / Maint / Mgmt
- −$345
- Net cashflow
- $686
Break-even live
UW: 25.0% down · 7.5% · 30yr · 1.5% tax · 5.0% vac · 8.0% maint · 8.0% mgmt
Financing live
Cash to close
- Down payment
- $21,125
- Closing costs
- $2,535
- Reserves months
- —
- Total cash needed
- —
Loan-product check · same deal, 3 products live
Conventional
25% down · 7.5% · 30yr
- Down + closing
- —
- Monthly P&I
- —
- Monthly cashflow
- —
- DSCR
- —
- Eligible?
- —
Personal DTI + credit; lowest rate.
DSCR
20% down · 8.5% · 30yr
- Down + closing
- —
- Monthly P&I
- —
- Monthly cashflow
- —
- DSCR
- —
- Eligible?
- —
No personal income docs; deal must DSCR.
Hard money
10% down · 12.0% · 12mo
- Down + closing
- —
- Monthly P&I
- —
- Monthly cashflow
- —
- DSCR
- —
- Eligible?
- —
Short-term bridge; refi at stabilization.
Rent comps 29 comps
| Address | Beds | Baths | Sqft | Rent | $/sqft | DOM | Units | Dist |
|---|---|---|---|---|---|---|---|---|
| 2429 Washington Blvd Baltimore, MD | 1.0 | 1.0 | 940 | $600 | $0.64 | 24d | 1 | 0.18mi |
| 2056 Griffis Ave Baltimore, MD | 3.0 | 1.5 | 1230 | $1,495 | $1.22 | 22d | 1 | 0.19mi |
| 1931 Griffis Ave Baltimore, MD | 2.0 | 1.0 | 912 | $1,349 | $1.48 | 4d | 1 | 0.20mi |
| 3004 Elizabeth Ave Unit 1 Baltimore, MD | 3.0 | 1.0 | 1024 | $1,395 | $1.36 | 4d | 1 | 0.66mi |
| 3017 Janice Ave Baltimore, MD | 3.0 | 1.0 | 1024 | $1,995 | $1.95 | 24d | 1 | 0.67mi |
| 2600 W Patapsco Ave Baltimore, MD | 1.0–2.0 | 1.0 | 856 | $1,309 | $1.53 | 2d | 24 | 0.80mi |
| 2737 Wilkens Ave Baltimore, MD | 3.0 | 1.5 | 1232 | $1,650 | $1.34 | 4d | 1 | 0.95mi |
| 2200 W Patapsco Ave Baltimore, MD | 3.0 | 1.0 | 890 | $1,569 | $1.76 | 44d | 1 | 0.97mi |
| 2738 Wilkens Ave Baltimore, MD | 3.0 | 1.0 | 1183 | $1,500 | $1.27 | 44d | 1 | 0.98mi |
| 1708 Hall Ave Unit 2 Halethorpe, MD | 2.0 | 1.0 | 845 | $1,625 | $1.92 | 11d | 1 | 1.00mi |
| 2671 Saint Benedict St Baltimore, MD | 2.0 | 1.0 | 1144 | $1,325 | $1.16 | 44d | 1 | 1.00mi |
| 2657 Lehman St Unit 1 Baltimore, MD | 2.0 | 1.0 | 1056 | $1,000 | $0.95 | 44d | 1 | 1.10mi |
| 514 S Payson St Unit 2 Baltimore, MD | 3.0 | 2.0 | 1264 | $1,750 | $1.38 | 44d | 1 | 1.13mi |
| 1432 Carroll St Baltimore, MD | 2.0 | 1.5 | 912 | $1,900 | $2.08 | 44d | 1 | 1.24mi |
| 2540 Frederick Ave Baltimore, MD | 3.0 | 1.0 | 1075 | $1,400 | $1.30 | 24d | 1 | 1.27mi |
| 332 S Franklintown Rd Unit 2 Baltimore, MD | 2.0 | 1.0 | 776 | $795 | $1.02 | 24d | 1 | 1.28mi |
| 307 S Smallwood St Baltimore, MD | 2.0 | 2.5 | 1400 | $1,350 | $0.96 | 44d | 1 | 1.31mi |
| 3392 Saint Benedict St Baltimore, MD | 2.0 | 1.0 | 864 | $1,450 | $1.68 | 24d | 1 | 1.35mi |
| 3130 Stafford St Baltimore, MD | 3.0 | 1.0 | 1200 | $1,500 | $1.25 | 20d | 1 | 1.36mi |
| 1303 James St Baltimore, MD | 2.0 | 1.5 | 1160 | $1,350 | $1.16 | 24d | 1 | 1.38mi |
| 1127 S Carey St Baltimore, MD | 3.0 | 2.5 | 1340 | $1,900 | $1.42 | 4d | 1 | 1.41mi |
| 110 S Catherine St Unit 1 Baltimore, MD | 2.0 | 1.0 | 1330 | $1,500 | $1.13 | 44d | 1 | 1.41mi |
| 1101 S Carey St Baltimore, MD | 2.0 | 2.0 | 1400 | $1,200 | $0.86 | 22d | 1 | 1.42mi |
| 1259 Washington Blvd Baltimore, MD | 3.0 | 3.0 | 1232 | $2,999 | $2.43 | 4d | 1 | 1.42mi |
| 1262 Glyndon Ave Baltimore, MD | 2.0 | 3.0 | 1258 | $1,850 | $1.47 | 24d | 1 | 1.44mi |
| 1243 Washington Blvd Baltimore, MD | 3.0 | 2.0 | 1148 | $1,950 | $1.70 | 44d | 1 | 1.44mi |
| 1253 Sargeant St Baltimore, MD | 2.0 | 1.5 | 1200 | $1,695 | $1.41 | 24d | 1 | 1.45mi |
| 1205 Cleveland St Baltimore, MD | 2.0 | 2.0 | 1232 | $1,900 | $1.54 | 44d | 1 | 1.47mi |
| 1215 James St Baltimore, MD | 2.0 | 1.0 | 960 | $1,500 | $1.56 | 44d | 1 | 1.49mi |
Listing history 15 events
-
2026-06-18days on market $84,500 Active 21 DOM
-
2026-06-18status $84,500 Active 20 DOM
-
2026-06-17status $84,500 Pending 20 DOM
-
2026-06-17days on market $84,500 Active 20 DOM
-
2026-06-16days on market $84,500 Active 19 DOM
-
2026-06-15days on market $84,500 Active 18 DOM
-
2026-06-13days on market $84,500 Active 16 DOM
-
2026-06-09days on market $84,500 Active 12 DOM
-
2026-06-08pricedays on market $84,500 Active 11 DOM
-
2026-06-07days on market $99,500 Active 10 DOM
-
2026-06-04statusdays on market $99,500 Active 7 DOM
-
2026-05-19$99,500 Active
-
2001-12-31soldstatus $20,000
-
2001-11-27$25,000
-
2001-11-27historical
ⓘ Source: listings_history table (triggers on properties + properties_extension) + one-shot
backfill from property_details.listing_events for pre-trigger history.
Tax reassessment forecast MD · Partial reset (capped growth)
- Current annual tax
- $1,607 · $134/mo
- Projected year-2 tax
- $1,607 · $134/mo
- Expected delta
- $0/yr ($0/mo · 0.0%)
ⓘ Screening estimate from a state-policy table — verify with the county assessor before closing.
Climate risk First Street
- Flood 1/10 Low FEMA zone X (unshaded) · 0% chance over 30 yrs
- Wildfire 1/10 Low
- Heat 7/10 Severe 7 d/yr ≥103°F today · 15 d/yr by 30 yrs out
- Wind 6/10 Major 27% chance of damaging wind over 30 yrs
- Air quality 3/10 Moderate 3 unhealthy d/yr today · 4 by 30 yrs out
Nearby sold comps map
Loading sold comps map…
Walkable amenities ~0.75 mi
Loading nearby amenities…
Taxation est. · year 1
- Rental income
- $19,718
- − Mortgage interest
- −$4,733
- − Property taxes
- −$1,607
- − Insurance
- −$422
- − Repairs & maintenance
- −$1,577
- − Management
- −$1,577
- − Depreciation
- −$2,458
- Taxable income
- $7,342
- Est. tax owed @ 24.0%
- −$1,762
- After-tax cash flow
- $6,468/yr
For passive investors: Depreciation is non-cash, so a rental often shows a tax loss while cash-flowing — sheltering income. Rental losses are passive: they offset passive income freely, and up to $25,000/yr can offset ordinary (W-2) income if you actively participate and your MAGI is under $100k (phasing out to $0 by $150k); unused losses carry forward. On sale, claimed depreciation is recaptured at up to 25%, and gains may owe capital-gains tax (a 1031 exchange can defer both). Figures are a year-1 estimate at your 24.0% rate — not tax advice; consult a CPA.
Schools (NCES district)
- District
- Baltimore City Public Schools
- NCES district ID
- 2400090
- Math proficiency
- 7% ▼ -9.00%
- Reading proficiency
- 16% ▼ -5.00%
- Median HH income
- $42,108
- Composite
- 10.08/100
- National rank
- #9805
- State rank
- #24 of 24 in MD
Livability — Baltimore
- Score
- 76/100
- State rank
- #90
- US rank
- #3396
Category grades
Schools grade is shown separately in the Schools card above.
Census & demographics
- Census place
- Baltimore, MD
- County
- Baltimore City · 558,601 people
- City population
- 588,727
- Metro
- Baltimore-Columbia-Towson, MD
- Population (ZIP)
- 32,977
- Household income
- $91,842
- Rent vs Own
- Severe rent burden
- 1463.0
Population outlook (Baltimore County) Hauer SSP2
- Today (2025)
- 624,249 people
- By 2030
- 621,541 · -0.4%
- By 2040
- 609,756 · -2.3%
- By 2050
- 597,249 · -4.3%
- By 2075
- 552,236 · -11.5%
- By 2100
- 513,934 · -17.7%
Race, ethnicity, and origin ACS 2023
- Neighborhood character
- Diverse neighborhood (Simpson 0.63)
- Race & ethnicity
- White 55% Black 23% Hispanic / Latino 13% Two or more races 6% Asian 4%
- Hispanic origin (detail)
- Mexican 1% Puerto Rican 1%
- Common ancestry
- Romanian 5% Lithuanian 2% Italian 2%
- Foreign-born
- 10% · Canada, China
- Languages at home
- 85% English-only · Spanish 9% Other Indo-European 1% Other Asian/Pacific 1%
Political lean MEDSL · Baltimore
- 2024 margin
- Solid D (+73.0) · D 85.2% · R 12.2% · Other 2.6%
- 2008→2024 swing
- -2.5pp toward R · 2008: 75.5pp · 2024: 73.0pp
- All cycles
- 2024: D+73.0 2020: D+76.6 2016: D+74.6 2012: D+76.4 2008: D+75.5
Not yet ingested
- Civics
- —
Market trends
- HPI YoY
- ▼ -311.43%
- Current HPI
- 284.338
- Rent YoY
- ▼ -1.00%
- Metro
- Baltimore-Columbia-Towson, MD
- State GDP YoY
- ▲ 2.97%
- F500 in state
- 12
Industry mix (Fortune 500 HQ in MD)
| Industry | F500 HQs | Revenue |
|---|---|---|
| Aerospace / Defense | 1 | $71B |
|
||
| Utilities | 1 | $25B |
|
||
| Hotels | 1 | $24B |
|
||
| Consumer Goods | 1 | $7B |
|
||
| Real Estate | 1 | $6B |
|
||
| Chemicals | 1 | $2B |
|
||
Price history
+298.0% since first listed4 events — show timeline
- 2026-05-19 Listed $99,500 BRIGHT MLS
- 2001-12-31 Sold (MLS) $20,000 MRIS
- 2001-11-27 Listed $25,000 MRIS
- 2001-11-27 Delisted — MRIS
Property tax history
-1.7%/yrLatest (2025): $1,607 · +10.7% YoY. Source: county tax records.
Cash-flow waterfall
monthlySold comps — $/sqft
last 12 mo · ≤1 miLoading sold comps…