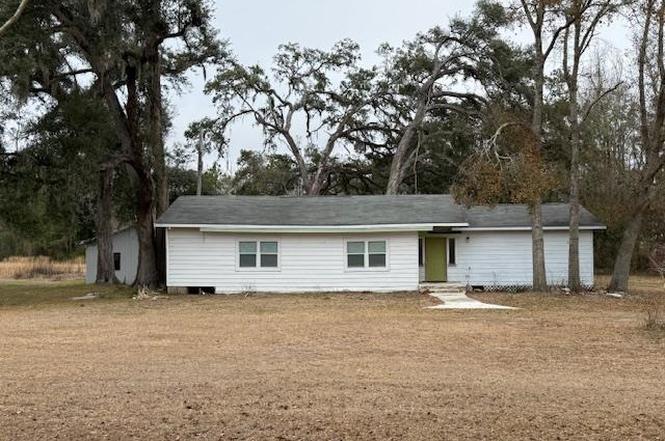
3017 W W Kelley Rd · Tallahassee, FL
Flood risk 1/10 · Minimal
- FEMA flood zone
- X (unshaded)
- Chance of flooding over 30 yrs
- 0.0%
- Est. flood insurance / yr
- $507 – $1,088
Fire risk 4/10 · Minor
- Est. fire insurance / yr
- $947 – $1,759
Heat risk 8/10 · Major
- Hot days now (above 108°F)
- 7 days/yr
- Hot days in 30 yrs
- 20 days/yr
Wind risk 9/10 · Severe
- Chance of severe wind over 30 yrs
- 99.0%
Air-quality risk 4/10 · Minor
- Unhealthy air days now
- 4 days/yr
- Unhealthy air days in 30 yrs
- 4 days/yr
Risk factors via First Street. Map © Google.
Why this score? — see what drove the C- grade
The composite is a weighted blend of 9 inputs, each scored 0–100. Each bar is that input's sub-score; the figure is the points it added to the 100-point composite (weight × sub-score).
- ARV discount +15.0/15.0
- Cash flow +14.6/30.0
- DSCR +4.4/10.0
- Schools +4.3/10.0
- Livability +4.3/5.0
- Rent growth +3.9/5.0
- 1% rule +3.8/10.0
- Condition / age +2.5/5.0
- Appreciation +0.0/10.0
$225,000
🖨 Deal sheet (PDF) 📄 Offer letter ✓ Due diligence
Listing remarks
Find value in the land and build your forever home here! Residential structure is in fair condition being sold as is. New 80' x 24' Pole Barn with finished 24' x 24' shop and concrete pad! Plan your future here! Peaceful country living and room for your horses, chickens, garden, children and family pets! New flooring, new cabinets, new appliances and new fixtures! This 3/2 is situated on just over 4 flat acres and surrounded by beautiful hardwoods and even some blueberry bushes. Septic and Electrical Panel are original but in working condition - A new septic tank installed will cost approximately $13,000 / Electrical Panel $10,000 and are not included at this price (but can be added to the
Key facts
- Room for horses
- Concrete pad
- Room for chickens
Tags
Property features AI
Finance
- Other: Lot approximately 4.39 acres
- Financial info: Offered for sale
Exterior
- Parking: Driveway
- Utilities: Electric heating and cooling
- Home design: Single-story; Vinyl siding
- Construction: Vinyl siding construction
- Exterior features: Deck; Publicly maintained road access
Interior
- Kitchen: Oven; Refrigerator; Stove
- Bedrooms: Bedroom (11x14); Bedroom (11x10)
- Flooring: Hardwood; Plank; Vinyl
- Bathrooms: 2 full bathrooms
- Heating & cooling: Central heating (electric); Central air conditioning; Ceiling fan(s)
- Interior features: Hardwood, plank and vinyl flooring; Ceiling fans
Neighborhood map
What this means for you Summary
Snapshot
- This is a 3-bed/1.0-bath single-family listed at $225k.
Deal economics
- At list price, monthly cash flow is $52 ($624/yr) — positive.
- The deal already cash-flows at list — no discount required.
- To meet the 1% rule (rent ≥ 1% of price), the offer needs to be $199k (11.7% below list).
- Recommended offer: $198k (12.0% below list) — sets the bar for market timing.
- Cap rate 6.6% vs local median 4.2% in Tallahassee — top-decile yield for the area; either an underpriced asset or a hidden risk that comps aren't pricing in. Stress-test before assuming the spread holds.
Location & tenants
- Location reads 86/100 on livability (#19 in FL, #429 nationally) — a professional / high-income tenant draw. Strengths: amenities A+, commute A+, health & safety A+; Watch: employment D.
- Leon (urban): math 48% / reading 53% proficiency, ranked #33 of 73 in FL (top 45%) — acceptable for families but not a draw, mixed tenant base, ~2y average lease.
- Zoned schools: J Michael Conley Elementary School At Southwood (math 44% / reading 52%, grade D, #1,171 of 2,144 statewide, top 55%, 657 students, 47% FRL); Fairview Middle School (math 44% / reading 46%, grade D, #310 of 571 statewide, top 56%, 747 students, 58% FRL); James Rickards High School (math 23% / reading 37%, grade F, #441 of 667 statewide, top 67%, 1,581 students, 57% FRL).
- Market conditions: Rents rising fast (+5.5%/yr); 118 active listings in the ZIP; solid renter incomes; 1,765 units permitted in Leon County in 2024 (975 in 5+ unit buildings).
Forward outlook
- Local home prices are declining (-3.0%/yr); year-one equity from $2k of loan paydown is wiped out by about $7k of value loss. Plan a longer hold.
- Leon County population projected at +23% by 2050 — long-run rental-demand tailwind backs the buy-and-hold thesis.
Negotiation context
- It's been on market 131 days — a 12% lower offer ($198k) is reasonable based on typical stale-listing flexibility.
- 9 sale attempts since 8y ago; this cycle's ask has dropped $25k (10%) from the opening price — seller is motivated, your offer sets the floor, not the list.
- Current owner paid $125k; list at $225k implies a 80% gain — meaningful room to come down on a strong offer.
Risks & watch-outs
- Climate carrying-cost: severe wind risk, 99% chance of damaging wind over 30y; extreme-heat days projected 7→20/yr by 2055 (HVAC capex compounding) — expect insurance premiums to compound above CPI over the hold.
Questions for the listing agent
- It's been on market 131 days. Have you received any prior offers? Is the seller open to a 12% concession, seller financing, or rate buy-down credit?
- Built in 1960 — when were the roof, HVAC, electrical panel, plumbing, and water heater last replaced?
- Why hasn't it sold? Are there any deal-killer items the seller is aware of (foundation, flood, title, zoning, code violations)?
- Is there a deadline driving the sale (1031 exchange, divorce, estate, relocation)? That informs how much negotiation room exists.
- Schools are B-rated — typically a magnet for longer-tenancy family renters. What's the average tenant stay here, and is there a school-zone premium baked into asking?
- What's the average days-on-market for RENTAL listings here right now (not sales)? A rising rental-DOM trend means longer vacancies and softer asking-rent achievability than the comps imply.
- What's the recent tenant-quality profile in this submarket — average credit score on applications, eviction rate, late-payment / NSF rate, and stable-employment percentage? A property-management company in the area should have these aggregated.
- How much new for-sale + rental construction is in the pipeline within 1–3 miles? Heavy new supply typically softens prices + rents 12–24 months out; constrained supply supports both.
Investment metrics
- 1% rule
- 0.88% ✗
- Cap rate
- 6.57%
- Cash-on-cash
- 0.99%
- DSCR
- 1.04
- GRM
- 9.4
CMA / ARV
- ARV (on-the-fly)
- $328,015
- Comps found
- 1
Show comp detail 1 sale within ~0.75 mi
| Address | Dist | Beds/Ba | Sqft | Sold | Price | $/sf | Match |
|---|---|---|---|---|---|---|---|
| 4001 W W Kelley Rd | 0.55mi | 3/2.0 | 1,500 (+4%) | 2mo | $340,000 | $227 | 63 |
Match score weights: distance 35% · size 25% · config 20% · recency 20%. Top-matched comps best support the ARV.
Projected returns pro-forma
-3.0% appreciation · 5.55% rent growth · sell at horizon
- IRR
- -12.0%
- Equity multiple
- 0.56×
- Total profit
- $-27,912
- Equity at exit
- $33,548
- IRR
- 0.5%
- Equity multiple
- 1.04×
- Total profit
- $2,596
- Equity at exit
- $19,454
Cash invested: $63,000 (down + closing). Projections, not guarantees.
Landlord ↔ Tenant lean methodology
- Overall (STATE)
- 87 Strongly Landlord-Friendly
- State Florida
- 87 Strongly Landlord-Friendly · R+3
- County
- — inherits STATE
- City
- — inherits STATE
ZIP-level market 32311
- Home prices YoY
- -27.5%
- Rents YoY
- 5.5%
- Active inventory
- 118
- Price-to-rent
- 9.4×
Monthly cashflow live
- Estimated rent
- $1,987 medium interval (Pro) →
- Mortgage (P&I)
- −$1,180
- Tax from tax record
- −$244 /mo · $2,932/yr
- Insurance
- −$94
- HOA
- −$0
- Vacancy / Maint / Mgmt
- −$417
- Net cashflow
- $52
Break-even live
Sensitivity live
| Price | -10% $179 | -5% $116 | +0% $52 | +5% $-12 | +10% $-75 |
|---|---|---|---|---|---|
| Rent | -10% $-105 | -5% $-27 | +0% $52 | +5% $130 | +10% $209 |
| Rate | -1.0pp $165 | -0.5pp $109 | base $52 | +0.5pp $-6 | +1.0pp $-66 |
UW: 25.0% down · 7.5% · 30yr · 1.5% tax · 5.0% vac · 8.0% maint · 8.0% mgmt
Financing live
Cash to close
- Down payment
- $56,250
- Closing costs
- $6,750
- Reserves months
- —
- Total cash needed
- —
Loan-product check · same deal, 3 products live
Conventional
25% down · 7.5% · 30yr
- Down + closing
- —
- Monthly P&I
- —
- Monthly cashflow
- —
- DSCR
- —
- Eligible?
- —
Personal DTI + credit; lowest rate.
DSCR
20% down · 8.5% · 30yr
- Down + closing
- —
- Monthly P&I
- —
- Monthly cashflow
- —
- DSCR
- —
- Eligible?
- —
No personal income docs; deal must DSCR.
Hard money
10% down · 12.0% · 12mo
- Down + closing
- —
- Monthly P&I
- —
- Monthly cashflow
- —
- DSCR
- —
- Eligible?
- —
Short-term bridge; refi at stabilization.
Listing history 45 events
-
2026-06-22days on market $225,000 Active 131 DOM
-
2026-06-18days on market $225,000 Active 128 DOM
-
2026-06-17days on market $225,000 Active 127 DOM
-
2026-06-16days on market $225,000 Active 126 DOM
-
2026-06-15days on market $225,000 Active 125 DOM
-
2026-06-14days on market $225,000 Active 123 DOM
-
2026-06-10days on market $225,000 Active 120 DOM
-
2026-06-09days on market $225,000 Active 119 DOM
-
2026-06-08days on market $225,000 Active 118 DOM
-
2026-06-07days on market $225,000 Active 117 DOM
-
2026-06-05days on market $225,000 Active 114 DOM
-
2026-06-03days on market $225,000 Active 113 DOM
-
2026-06-02days on market $225,000 Active 112 DOM
-
2026-06-01days on market $225,000 Active 111 DOM
-
2026-05-31days on market $225,000 Active 110 DOM
-
2026-05-30days on market $225,000 Active 109 DOM
-
2026-05-18price $229,900
-
2026-04-29price $239,000
-
2026-03-22price $249,000
-
2026-03-05price $249,500
-
2026-02-10$249,900 Active
-
2025-06-16historical
-
2025-06-16historical
-
2025-05-23price $249,500
-
2025-05-23price $249,500
-
2025-05-14status Active
-
2025-05-14price $249,900
-
2025-05-06price $249,900
-
2025-05-06historical
-
2025-04-16price $224,900
-
2025-04-16price $224,900
-
2025-03-29$225,000
-
2025-03-29historical
-
2025-03-29$225,000 Active
-
2025-03-29historical
-
2025-03-28$225,000 Active
-
2025-03-27$225,000 Active
-
2023-10-24soldstatus $125,000
-
2023-10-19soldstatus $125,000 Closed
-
2023-10-06historical Active Under Contract
-
2023-09-29status Active
-
2023-09-27historical Active Under Contract
-
2023-09-20$149,900 Active
-
2018-09-19historical
-
2018-05-03$120,000
ⓘ Source: listings_history table (triggers on properties + properties_extension) + one-shot
backfill from property_details.listing_events for pre-trigger history.
Tax reassessment forecast FL · Resets to sale price
- Current annual tax
- $2,932 · $244/mo
- Projected year-2 tax
- $2,932 · $244/mo
- Expected delta
- $0/yr ($0/mo · 0.0%)
ⓘ Screening estimate from a state-policy table — verify with the county assessor before closing.
Climate risk First Street
- Flood 1/10 Low FEMA zone X (unshaded) · 0% chance over 30 yrs
- Wildfire 4/10 Moderate
- Heat 8/10 Severe 7 d/yr ≥108°F today · 20 d/yr by 30 yrs out
- Wind 9/10 Extreme 99% chance of damaging wind over 30 yrs
- Air quality 4/10 Moderate 4 unhealthy d/yr today · 4 by 30 yrs out
Nearby sold comps map
Loading sold comps map…
Walkable amenities ~0.75 mi
Loading nearby amenities…
Taxation est. · year 1
- Rental income
- $23,848
- − Mortgage interest
- −$12,603
- − Property taxes
- −$2,932
- − Insurance
- −$1,125
- − Repairs & maintenance
- −$1,908
- − Management
- −$1,908
- − Depreciation
- −$6,545
- Taxable loss
- −$3,174
- Est. tax savings @ 24.0%
- +$762
- After-tax cash flow
- $1,386/yr
For passive investors: Depreciation is non-cash, so a rental often shows a tax loss while cash-flowing — sheltering income. Rental losses are passive: they offset passive income freely, and up to $25,000/yr can offset ordinary (W-2) income if you actively participate and your MAGI is under $100k (phasing out to $0 by $150k); unused losses carry forward. On sale, claimed depreciation is recaptured at up to 25%, and gains may owe capital-gains tax (a 1031 exchange can defer both). Figures are a year-1 estimate at your 24.0% rate — not tax advice; consult a CPA.
Schools (NCES district)
- District
- Leon
- NCES district ID
- 1201110
- Math proficiency
- 48% ▼ -13.00%
- Reading proficiency
- 53% ▼ -5.00%
- Median HH income
- $46,339
- Composite
- 42.84/100
- National rank
- #3131
- State rank
- #33 of 73 in FL
Livability — Tallahassee
- Score
- 86/100
- State rank
- #19
- US rank
- #429
Category grades
Schools grade is shown separately in the Schools card above.
Census & demographics
- County
- Leon County · 294,472 people
- City population
- 294,472
- Metro
- Tallahassee, FL
- Population (ZIP)
- 21,905
- Household income
- $81,243
- Rent vs Own
- Severe rent burden
- 795.0
Population outlook (Leon County) Hauer SSP2
- Today (2025)
- 315,507 people
- By 2030
- 330,677 · +4.8%
- By 2040
- 358,465 · +13.6%
- By 2050
- 386,804 · +22.6%
- By 2075
- 465,480 · +47.5%
- By 2100
- 519,959 · +64.8%
Race, ethnicity, and origin ACS 2023
- Neighborhood character
- Diverse neighborhood (Simpson 0.64)
- Race & ethnicity
- White 52% Black 27% Two or more races 10% Hispanic / Latino 9% Asian 6%
- Hispanic origin (detail)
- Mexican 2% Puerto Rican 1% Cuban 1%
- Common ancestry
- Romanian 2% Serbian 2% Slovak 2%
- Foreign-born
- 11% · Canada, Jamaica
- Languages at home
- 86% English-only · Spanish 6% Other Indo-European 3% Other Asian/Pacific 2%
Political lean MEDSL · Leon
- 2024 margin
- Strong D (+21.8) · D 60.3% · R 38.5% · Other 1.2%
- 2008→2024 swing
- -2.5pp toward R · 2008: 24.3pp · 2024: 21.8pp
- All cycles
- 2024: D+21.8 2020: D+28.3 2016: D+25.1 2012: D+23.6 2008: D+24.3
Not yet ingested
- Civics
- —
Market trends
- HPI YoY
- ▼ -90.68%
- Current HPI
- 238.8804
- Rent YoY
- ▲ 5.55%
- Metro
- Tallahassee, FL
- State GDP YoY
- ▲ 3.28%
- F500 in state
- 36
Industry mix (Fortune 500 HQ in FL)
| Industry | F500 HQs | Revenue |
|---|---|---|
| Industrial Technology | 2 | $29B |
|
||
| Insurance | 2 | $17B |
|
||
| Retail | 1 | $60B |
|
||
| Technology Distribution | 1 | $58B |
|
||
| Homebuilding | 1 | $35B |
|
||
| Technology Manufacturing | 1 | $35B |
|
||
Price history
+91.6% since first listed29 events — show timeline
- 2026-05-18 Price Changed $229,900 CATRS
- 2026-04-29 Price Changed $239,000 CATRS
- 2026-03-22 Price Changed $249,000 CATRS
- 2026-03-05 Price Changed $249,500 CATRS
- 2026-02-10 Listed $249,900 CATRS
- 2025-06-16 Listing Removed — CATRS
- 2025-06-16 Listing Removed — CATRS
- 2025-05-23 Price Changed $249,500 CATRS
- 2025-05-23 Price Changed $249,500 CATRS
- 2025-05-14 Relisted — CATRS
- 2025-05-14 Price Changed $249,900 CATRS
- 2025-05-06 Price Changed $249,900 CATRS
- 2025-05-06 Listing Removed — CATRS
- 2025-04-16 Price Changed $224,900 CATRS
- 2025-04-16 Price Changed $224,900 CATRS
- 2025-03-29 Listing Removed — CATRS
- 2025-03-29 Listed $225,000 CATRS
- 2025-03-29 Listing Removed — CATRS
- 2025-03-29 Listed $225,000 CATRS
- 2025-03-28 Listed $225,000 CATRS
- 2025-03-27 Listed $225,000 CATRS
- 2023-10-24 Sold (Public Records) $125,000 Public Records
- 2023-10-19 Sold (MLS) $125,000 CATRS
- 2023-10-06 Contingent — CATRS
- 2023-09-29 Relisted — CATRS
- 2023-09-27 Contingent — CATRS
- 2023-09-20 Listed $149,900 CATRS
- 2018-09-19 Listing Removed — CATRS
- 2018-05-03 Listed $120,000 CATRS
Property tax history
+11.7%/yrLatest (2025): $2,932 · +7.6% YoY. Source: county tax records.
Cash-flow waterfall
monthlySold comps — $/sqft
last 12 mo · ≤1 miLoading sold comps…