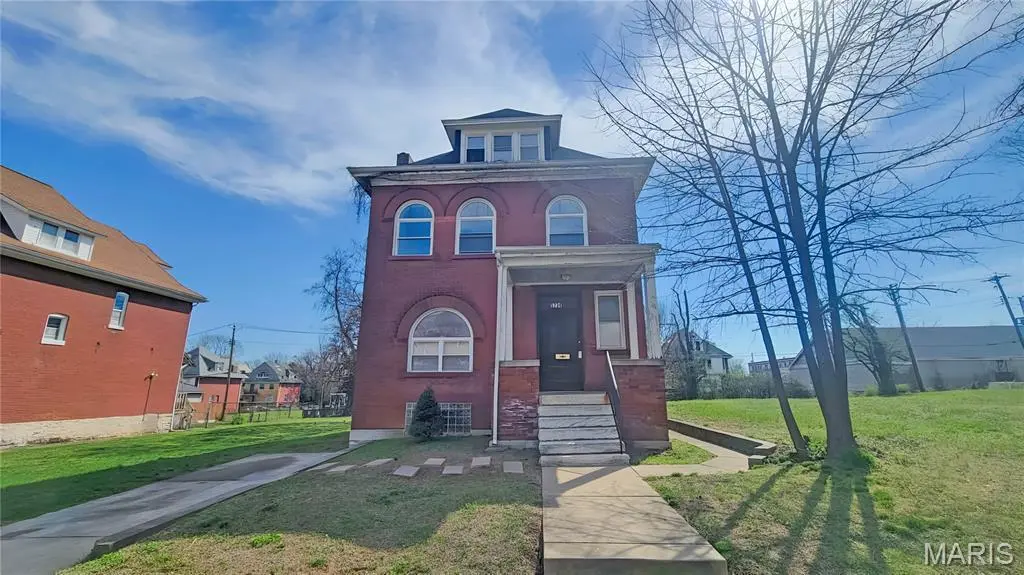
5734 Maple Ave · St. Louis, MO
Flood risk 1/10 · Minimal
- FEMA flood zone
- X (unshaded)
- Chance of flooding over 30 yrs
- 0.0%
- Est. flood insurance / yr
- $473 – $860
Fire risk 1/10 · Minimal
- Est. fire insurance / yr
- $1,054 – $1,958
Heat risk 5/10 · Moderate
- Hot days now (above 107°F)
- 7 days/yr
- Hot days in 30 yrs
- 21 days/yr
Wind risk 2/10 · Minimal
- Chance of severe wind over 30 yrs
- 1.0%
Air-quality risk 4/10 · Minor
- Unhealthy air days now
- 4 days/yr
- Unhealthy air days in 30 yrs
- 5 days/yr
Risk factors via First Street. Map © Google.
Why this score? — see what drove the B grade
The composite is a weighted blend of 9 inputs, each scored 0–100. Each bar is that input's sub-score; the figure is the points it added to the 100-point composite (weight × sub-score).
- Cash flow +30.0/30.0
- ARV discount +15.0/15.0
- 1% rule +10.0/10.0
- DSCR +10.0/10.0
- Rent growth +3.1/5.0
- Livability +2.5/5.0
- Condition / age +2.5/5.0
- Schools +1.2/10.0
- Appreciation +0.0/10.0
$149,900
🖨 Deal sheet 📄 Offer letter ✓ Due diligence
Listing remarks MLS
OUTSTANDING OPPORUNITY!!! Bring your finishing touches to this MASSIVE mid-town monster! Three stories of space for you and yours! Completely renovated not many years ago with both old-world charm and modern amenities! Wood floors, molding, oak cabinets, open floor plan, and MORE! Newer electric, plumbing, hvac, rear deck, patio and fenced yard make this one a WINNER! Schedule a showing today! Property is to be sold in its current as-is condition with no warranties or representations by the Seller. Seller will not make repairs nor provide any inspections. Seller's addendum is required after terms of sale are agreed upon. Special Sale Contract (Form #2043) required. Proof of funds or pre-approval letter required with offer.
Key facts
- Newer electric
- Three stories
- Open floor plan
Tags
Neighborhood map
What this means for you Summary
Snapshot
- This is a 5-bed/3.5-bath single-family listed at $150k.
Deal economics
- At list price, monthly cash flow is $1k ($13k/yr) — positive.
- The deal already cash-flows at list — no discount required.
- Meets the 1% rule at list price ($3k rent vs $150k).
- Recommended offer: $145k (3.0% below list) — sets the bar for market timing.
- Cap rate 14.8% vs local median 5.0% in St. Louis — top-decile yield for the area; either an underpriced asset or a hidden risk that comps aren't pricing in. Stress-test before assuming the spread holds.
Location & tenants
- Location reads: area grade B — affects rentability + tenant quality, not the cash-flow math above.
- St. Louis City (urban): math 10% / reading 18% proficiency, ranked #312 of 324 in MO (top 96%) — low school quality limits family demand, transient renter base, plan for 1-2y turnover; 80% free/reduced lunch — lower-income household profile, screen leases tightly.
- Market conditions: Rents rising (+2.4%/yr); 118 active listings in the ZIP; 5 comparable units currently listed for rent nearby; rentals at typical pace (median 24d on market — plan ~3-4 weeks tenant-placement turnaround); 294 units permitted in St. Louis city in 2024 (227 in 5+ unit buildings).
- At $2,521/mo this rent would consume 66% of the median local household income ($46k/yr) (locally 1457% of renters already pay >50% of income on rent) — very limited rent-growth headroom before tenants either downsize or default.
Forward outlook
- Local home prices are declining (-3.0%/yr); year-one equity from $1k of loan paydown is wiped out by about $4k of value loss. Plan a longer hold.
- St. Louis County population projected to shrink 6% by 2050 — rents likely to lag national; underwrite the cash flow, not the appreciation.
- At projected returns (-3.0% appreciation + 2.4% rent growth), your $42k cash investment doubles in ~5 years — after that, you're playing with house money.
Negotiation context
- It's been on market 49 days — a 3% lower offer ($145k) is reasonable based on typical stale-listing flexibility.
- 5 sale attempts since 14y ago with the ask held roughly flat each time — persistent listings suggest the price (not the market) is what's stuck; bring a comps-based counter.
Risks & watch-outs
- Watch-outs: built in 1893 — expect roof / HVAC / electrical / plumbing capex.
- Climate carrying-cost: extreme-heat days projected 7→21/yr by 2055 (HVAC capex compounding) — expect insurance premiums to compound above CPI over the hold.
Questions for the listing agent
- It's been on market 49 days. Have you received any prior offers? Is the seller open to a 3% concession, seller financing, or rate buy-down credit?
- Built in 1893 — when were the roof, HVAC, electrical panel, plumbing, and water heater last replaced?
- Is there a deadline driving the sale (1031 exchange, divorce, estate, relocation)? That informs how much negotiation room exists.
- What's the average days-on-market for RENTAL listings here right now (not sales)? A rising rental-DOM trend means longer vacancies and softer asking-rent achievability than the comps imply.
- What's the recent tenant-quality profile in this submarket — average credit score on applications, eviction rate, late-payment / NSF rate, and stable-employment percentage? A property-management company in the area should have these aggregated.
- How much new for-sale + rental construction is in the pipeline within 1–3 miles? Heavy new supply typically softens prices + rents 12–24 months out; constrained supply supports both.
Investment metrics
- 1% rule
- 1.68% ✓
- Cap rate
- 14.76%
- Cash-on-cash
- 30.23%
- DSCR
- 2.34
- GRM
- 5.0
CMA / ARV
- ARV (median comp)
- $268,633
- List price
- $149,900
- Delta
- -44.20%
- Verdict
- UNDERPRICED
- Comps
- 20 within 1.0 mi
Show comp detail 12 sales within ~0.75 mi
| Address | Dist | Beds/Ba | Sqft | Sold | Price | $/sf | Match |
|---|---|---|---|---|---|---|---|
| 5911 Enright Ave | 0.46mi | 5/3.5 | 2,106 (+3%) | 14mo | $399,900 | $190 | 63 |
| 6018 Horton Pl | 0.44mi | 5/1.5 | 2,105 (+3%) | 9mo | $210,000 | $100 | 60 |
| 5929 Cates Ave | 0.37mi | 5/1.5 | 1,980 (-3%) | 11mo | $100,000 | $51 | 60 |
| 5715 Enright Ave | 0.36mi | 5/3.5 | 2,352 (+15%) | 6mo | $350,000 | $149 | 54 |
| 6027 Etzel Ave | 0.48mi | 6/2.0 (+1) | 2,202 (+7%) | 5mo | $83,000 | $38 | 50 |
| 1441 Temple Pl | 0.70mi | 5/2.0 | 1,980 (-3%) | 11mo | $7,000 | $4 | 47 |
| 938 Catalpa St | 0.45mi | 4/2.0 (-1) | 1,820 (-11%) | 4mo | $199,900 | $110 | 46 |
| 6012 Clemens Ave | 0.53mi | 5/3.5 | 2,296 (+12%) | 14mo | $300,000 | $131 | 43 |
| 5732 Mcpherson Ave | 0.68mi | 4/3.5 (-1) | 2,187 (+7%) | 16mo | $465,000 | $213 | 39 |
| 5715 Clemens Ave | 0.28mi | 4/2.0 (-1) | 2,350 (+15%) | 18mo | $289,900 | $123 | 37 |
| 5941 Romaine Pl | 0.73mi | 4/2.0 (-1) | 2,160 (+5%) | 17mo | $39,900 | $18 | 32 |
| 6033 Clemens Ave | 0.54mi | 4/2.5 (-1) | 2,323 (+13%) | 14mo | $375,000 | $161 | 32 |
Match score weights: distance 35% · size 25% · config 20% · recency 20%. Top-matched comps best support the ARV.
Projected returns pro-forma
-3.0% appreciation · 2.39% rent growth · sell at horizon
- IRR
- 24.2%
- Equity multiple
- 1.99×
- Total profit
- $41,485
- Equity at exit
- $22,351
- IRR
- 31.6%
- Equity multiple
- 3.78×
- Total profit
- $116,500
- Equity at exit
- $12,961
Cash invested: $41,972 (down + closing). Projections, not guarantees.
Landlord ↔ Tenant lean methodology
- Overall (STATE)
- 81 Strongly Landlord-Friendly
- State Missouri
- 81 Strongly Landlord-Friendly · R+10
- County
- — inherits STATE
- City
- — inherits STATE
ZIP-level market 63112
- Rents YoY
- 2.4%
- Active inventory
- 118
- Price-to-rent
- 5.0×
Monthly cashflow live
- Estimated rent
- $2,521 medium interval (Pro) →
- Mortgage (P&I)
- −$786
- Tax from tax record
- −$86 /mo · $1,033/yr
- Insurance
- −$62
- HOA
- −$0
- Vacancy / Maint / Mgmt
- −$530
- Net cashflow
- $1,057
Break-even live
UW: 25.0% down · 7.5% · 30yr · 1.5% tax · 5.0% vac · 8.0% maint · 8.0% mgmt
Financing live
Cash to close
- Down payment
- $37,475
- Closing costs
- $4,497
- Reserves months
- —
- Total cash needed
- —
Loan-product check · same deal, 3 products live
Conventional
25% down · 7.5% · 30yr
- Down + closing
- —
- Monthly P&I
- —
- Monthly cashflow
- —
- DSCR
- —
- Eligible?
- —
Personal DTI + credit; lowest rate.
DSCR
20% down · 8.5% · 30yr
- Down + closing
- —
- Monthly P&I
- —
- Monthly cashflow
- —
- DSCR
- —
- Eligible?
- —
No personal income docs; deal must DSCR.
Hard money
10% down · 12.0% · 12mo
- Down + closing
- —
- Monthly P&I
- —
- Monthly cashflow
- —
- DSCR
- —
- Eligible?
- —
Short-term bridge; refi at stabilization.
Rent comps 5 comps
| Address | Beds | Baths | Sqft | Rent | $/sqft | DOM | Units | Dist |
|---|---|---|---|---|---|---|---|---|
| 14 Parkland Pl Unit 1 St. Louis, MO | 5.0 | 3.0 | 2830 | $2,700 | $0.95 | 23d | 1 | 0.19mi |
| 14 Parkland Pl Saint Louis, MO | 5.0 | 3.0 | 2830 | $2,500 | $0.88 | 23d | 1 | 0.19mi |
| 14 Parkland Pl Unit NA St. Louis, MO | 5.0 | 3.0 | 2830 | $2,700 | $0.95 | 43d | 1 | 0.19mi |
| 14 Parkland Pl Saint Louis, MO | 5.0 | 3.0 | 2830 | $2,500 | $0.88 | 7d | 1 | 0.19mi |
| 6017 Kingsbury Ave Unit 2f St. Louis, MO | 4.0 | 1.0 | 1500 | $3,250 | $2.17 | 17d | 1 | 0.79mi |
Listing history 17 events
-
2026-06-02status $149,900 Pending 49 DOM
-
2026-06-01days on market $149,900 Active 49 DOM
-
2026-05-31days on market $149,900 Active 48 DOM
-
2026-04-29status Active 736-char remark
Show marketing remark (736 chars)
OUTSTANDING OPPORUNITY!!! Bring your finishing touches to this MASSIVE mid-town monster! Three stories of space for you and yours! Completely renovated not many years ago with both old-world charm and modern amenities! Wood floors, molding, oak cabinets, open floor plan, and MORE! Newer electric, plumbing, hvac, rear deck, patio and fenced yard make this one a WINNER! Schedule a showing today! Property is to be sold in its current as-is condition with no warranties or representations by the Seller. Seller will not make repairs nor provide any inspections. Seller's addendum is required after terms of sale are agreed upon. Special Sale Contract (Form #2043) required. Proof of funds or pre-approval letter required with offer.
-
2026-04-20status Pending 736-char remark
Show marketing remark (736 chars)
OUTSTANDING OPPORUNITY!!! Bring your finishing touches to this MASSIVE mid-town monster! Three stories of space for you and yours! Completely renovated not many years ago with both old-world charm and modern amenities! Wood floors, molding, oak cabinets, open floor plan, and MORE! Newer electric, plumbing, hvac, rear deck, patio and fenced yard make this one a WINNER! Schedule a showing today! Property is to be sold in its current as-is condition with no warranties or representations by the Seller. Seller will not make repairs nor provide any inspections. Seller's addendum is required after terms of sale are agreed upon. Special Sale Contract (Form #2043) required. Proof of funds or pre-approval letter required with offer.
-
2026-04-04$149,900 Active 736-char remark
Show marketing remark (736 chars)
OUTSTANDING OPPORUNITY!!! Bring your finishing touches to this MASSIVE mid-town monster! Three stories of space for you and yours! Completely renovated not many years ago with both old-world charm and modern amenities! Wood floors, molding, oak cabinets, open floor plan, and MORE! Newer electric, plumbing, hvac, rear deck, patio and fenced yard make this one a WINNER! Schedule a showing today! Property is to be sold in its current as-is condition with no warranties or representations by the Seller. Seller will not make repairs nor provide any inspections. Seller's addendum is required after terms of sale are agreed upon. Special Sale Contract (Form #2043) required. Proof of funds or pre-approval letter required with offer.
-
2025-03-07historical
-
2024-10-03$295,000 Active
-
2024-09-27historical
-
2023-07-21historical
-
2023-06-23$295,000 Active
-
2023-06-16historical
-
2019-07-08soldstatus $180,000
-
2012-04-11soldstatus
-
2012-02-13$20,790
-
2010-09-15soldstatus
-
2004-12-16soldstatus
ⓘ Source: listings_history table (triggers on properties + properties_extension) + one-shot
backfill from property_details.listing_events for pre-trigger history.
Tax reassessment forecast MO · Resets to sale price
- Current annual tax
- $1,033 · $86/mo
- Projected year-2 tax
- $1,454 · $121/mo
- Expected delta
- +$421/yr (+$35/mo · 40.7%)
ⓘ Screening estimate from a state-policy table — verify with the county assessor before closing.
Climate risk First Street
- Flood 1/10 Low FEMA zone X (unshaded) · 0% chance over 30 yrs
- Wildfire 1/10 Low
- Heat 5/10 Major 7 d/yr ≥107°F today · 21 d/yr by 30 yrs out
- Wind 2/10 Low 100% chance of damaging wind over 30 yrs
- Air quality 4/10 Moderate 4 unhealthy d/yr today · 5 by 30 yrs out
Nearby sold comps map
Loading sold comps map…
Walkable amenities ~0.75 mi
Loading nearby amenities…
Taxation est. · year 1
- Rental income
- $30,257
- − Mortgage interest
- −$8,397
- − Property taxes
- −$1,033
- − Insurance
- −$750
- − Repairs & maintenance
- −$2,421
- − Management
- −$2,421
- − Depreciation
- −$4,361
- Taxable income
- $10,876
- Est. tax owed @ 24.0%
- −$2,610
- After-tax cash flow
- $10,077/yr
For passive investors: Depreciation is non-cash, so a rental often shows a tax loss while cash-flowing — sheltering income. Rental losses are passive: they offset passive income freely, and up to $25,000/yr can offset ordinary (W-2) income if you actively participate and your MAGI is under $100k (phasing out to $0 by $150k); unused losses carry forward. On sale, claimed depreciation is recaptured at up to 25%, and gains may owe capital-gains tax (a 1031 exchange can defer both). Figures are a year-1 estimate at your 24.0% rate — not tax advice; consult a CPA.
Schools (NCES district)
- District
- St. Louis City
- NCES district ID
- 2929280
- Math proficiency
- 10% ▼ -6.00%
- Reading proficiency
- 18% ▼ -3.00%
- Median HH income
- $35,685
- Composite
- 11.54/100
- National rank
- #9699
- State rank
- #312 of 324 in MO
Livability — St. Louis
No livability data for this city. (Only ~50 U.S. cities are tracked.)
Census & demographics
- Census place
- St. Louis, MO
- County
- Saint Louis City · 254,015 people
- City population
- 283,259
- Metro
- St. Louis, MO-IL
- Population (ZIP)
- 17,985
- Household income
- $45,542
- Rent vs Own
- Severe rent burden
- 1457.0
Population outlook (St. Louis County) Hauer SSP2
- Today (2025)
- 315,737 people
- By 2030
- 313,865 · -0.6%
- By 2040
- 305,439 · -3.3%
- By 2050
- 296,529 · -6.1%
- By 2075
- 271,028 · -14.2%
- By 2100
- 255,359 · -19.1%
Race, ethnicity, and origin ACS 2023
- Neighborhood character
- Majority Black (63%)
- Race & ethnicity
- Black 63% White 24% Asian 6% Two or more races 5% Hispanic / Latino 4%
- Common ancestry
- Lithuanian 1% Scotch-Irish 1% Romanian 1%
- Foreign-born
- 9% · China, South Korea, Canada
- Languages at home
- 88% English-only · Spanish 3% Chinese 2% Korean 2%
Political lean MEDSL · St. Louis
- 2024 margin
- Solid D (+64.7) · D 81.4% · R 16.7% · Other 2.0%
- 2008→2024 swing
- -3.5pp toward R · 2008: 68.2pp · 2024: 64.7pp
- All cycles
- 2024: D+64.7 2020: D+66.2 2016: D+63.7 2012: D+66.6 2008: D+68.2
Not yet ingested
- Civics
- —
Market trends
- HPI YoY
- ▼ -158.94%
- Current HPI
- 115.1863
- Rent YoY
- ▲ 2.39%
- Metro
- St. Louis, MO-IL
- State GDP YoY
- ▲ 1.84%
- F500 in state
- 20
Industry mix (Fortune 500 HQ in MO)
| Industry | F500 HQs | Revenue |
|---|---|---|
| Healthcare | 1 | $163B |
|
||
| Insurance | 1 | $21B |
|
||
| Industrial Technology | 1 | $17B |
|
||
| Retail | 1 | $16B |
|
||
| Industrial Distribution | 1 | $10B |
|
||
| Utilities | 1 | $9B |
|
||
Price history
+621.0% since first listed14 events — show timeline
- 2026-04-29 Relisted — MARIS as Distributed by MLS Grid
- 2026-04-20 Pending — MARIS as Distributed by MLS Grid
- 2026-04-04 Listed $149,900 MARIS as Distributed by MLS Grid
- 2025-03-07 Delisted — MARIS as Distributed by MLS Grid
- 2024-10-03 Listed $295,000 MARIS as Distributed by MLS Grid
- 2024-09-27 Coming Soon — MARIS as Distributed by MLS Grid
- 2023-07-21 Delisted — MARIS as Distributed by MLS Grid
- 2023-06-23 Listed $295,000 MARIS as Distributed by MLS Grid
- 2023-06-16 Coming Soon — MARIS as Distributed by MLS Grid
- 2019-07-08 Sold (Public Records) $180,000 Public Records
- 2012-04-11 Sold (MLS) — MARIS as Distributed by MLS Grid
- 2012-02-13 Listed $20,790 MARIS as Distributed by MLS Grid
- 2010-09-15 Sold (Public Records) — Public Records
- 2004-12-16 Sold (Public Records) — Public Records
Property tax history
+9.9%/yrLatest (2024): $1,033 · +5.0% YoY. Source: county tax records.
Cash-flow waterfall
monthlySold comps — $/sqft
last 12 mo · ≤1 miLoading sold comps…