 Duplex
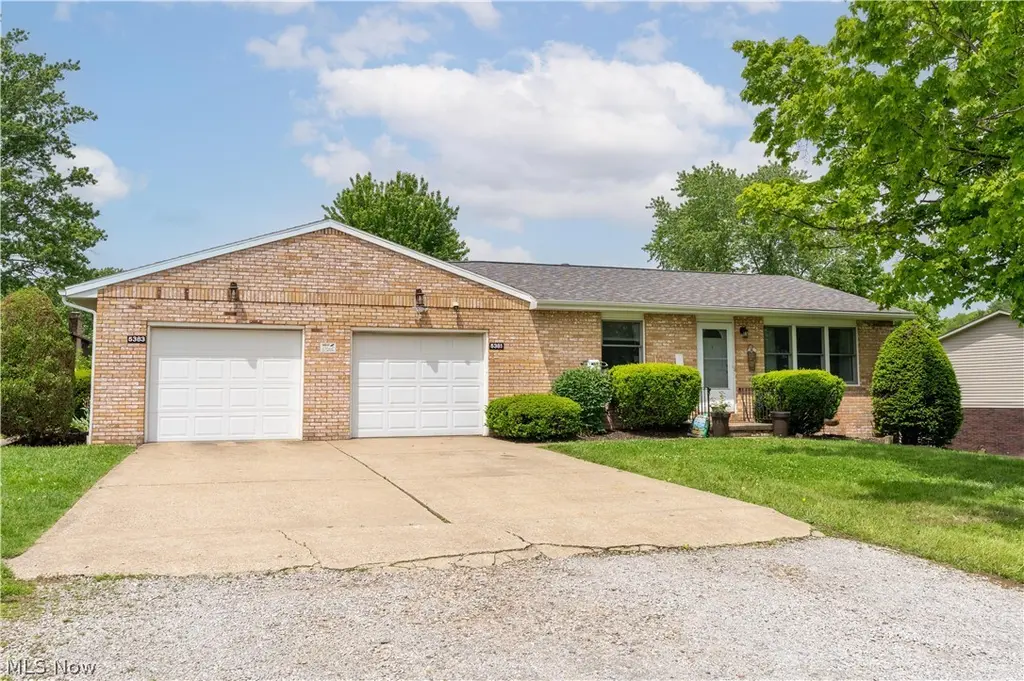
5381 Portage St NW · Canton, OH
Flood risk 1/10 · Minimal
- FEMA flood zone
- X (unshaded)
- Chance of flooding over 30 yrs
- 0.0%
- Est. flood insurance / yr
- $473 – $860
Fire risk 1/10 · Minimal
- Est. fire insurance / yr
- $713 – $1,323
Heat risk 3/10 · Minor
- Hot days now (above 96°F)
- 7 days/yr
- Hot days in 30 yrs
- 17 days/yr
Wind risk 1/10 · Minimal
- Chance of severe wind over 30 yrs
- —
Air-quality risk 2/10 · Minimal
- Unhealthy air days now
- 1 days/yr
- Unhealthy air days in 30 yrs
- 2 days/yr
Risk factors via First Street. Map © Google.
Why this score? — see what drove the C+ grade
The composite is a weighted blend of 9 inputs, each scored 0–100. Each bar is that input's sub-score; the figure is the points it added to the 100-point composite (weight × sub-score).
- Cash flow +19.7/30.0
- ARV discount +14.7/15.0
- Schools +6.7/10.0
- DSCR +6.2/10.0
- 1% rule +5.0/10.0
- Livability +3.6/5.0
- Rent growth +2.7/5.0
- Condition / age +2.5/5.0
- Appreciation +0.0/10.0
$249,900
🖨 Deal sheet 📄 Offer letter ✓ Due diligence
Multi-family units
County records classify this as Multi-Family (2-4 Unit). Listing-text estimate: 2 units. confirmed
Listing remarks
Solid investment opportunity in sought after Jackson Local Schools! This all brick duplex offers strong income potential for investors or owner-occupants alike. Each unit features 2 bedrooms, 1 full bath, an eat-in applianced kitchen, full basement with laundry, and a one-car attached garage. Plenty of additional parking plus a large backyard providing ample outdoor space for tenants to enjoy. One unit is vacant and move-in ready for a new renter, while the second unit is currently occupied on a month-to-month lease, offering flexibility for future rental adjustments or owner occupancy. Well-maintained duplex with great long-term investment potential in a desirable location!
Key facts
- Move-in ready
- Large backyard
- Full basement
Tags
Property features AI
Finance
- Financial info: Owner pays grounds care and sewer; Tenants pay cable TV, heat, and internet; One unit shown with current rent of $860 and listed as leased
Exterior
- Parking: Attached 2-car garage; Driveway parking
- Utilities: Public sewer; Well water
- Home design: Single-story building; One building on the lot
- Construction: Built (year per public records); Asphalt/fiberglass roof; Brick construction
- Exterior features: Brick exterior
Interior
- Kitchen: Dishwasher; Range; Refrigerator; Eat-in kitchen
- Bedrooms: Two 2-bedroom units
- Bathrooms: Two full bathrooms (one per unit)
- Heating & cooling: Forced air heating (gas); Central air conditioning
- Interior features: Double-pane windows; Ceiling fans; Eat-in kitchen; Full basement
- Laundry & utility: Laundry area on lower level
Neighborhood map
What this means for you Summary
Snapshot
- This is a 2 × 2-bed/1.0-bath units multifamily listed at $250k.
Deal economics
- At list price, monthly cash flow is $293 ($4k/yr) — positive. Per door: $146/mo.
- The deal already cash-flows at list — no discount required.
- Meets the 1% rule at list price ($3k rent vs $250k).
- Cap rate 7.7% vs local median 5.1% in Canton — top-decile yield for the area; either an underpriced asset or a hidden risk that comps aren't pricing in. Stress-test before assuming the spread holds.
Location & tenants
- Location reads 71/100 on livability (#441 in OH) — a middle-class / working-renter tenant base. Strengths: commute A+, cost of living A+, housing A; Watch: crime F, employment F.
- Jackson Local (suburban): math 75% / reading 78% proficiency, ranked #67 of 656 in OH (top 10%) — strong family-tenant draw, lease renewals of 3-5y typical; only 13% free/reduced lunch — higher-income household profile.
- Market conditions: Rents flat; 226 active listings in the ZIP; solid renter incomes; 528 units permitted in Stark County in 2024 (84 in 5+ unit buildings).
- This rent runs 36% of the median local income ($83k/yr) — at the standard rent-burdened threshold; future hikes will face affordability resistance.
Forward outlook
- Local home prices are declining (-3.0%/yr); year-one equity from $2k of loan paydown is wiped out by about $7k of value loss. Plan a longer hold.
- Stark County population projected to shrink 8% by 2050 — rents likely to lag national; underwrite the cash flow, not the appreciation.
Negotiation context
- Only 5 days on market — expect competitive offers; lowballing is unlikely to land.
- Current owner paid $80k; list at $250k implies a 212% gain — meaningful room to come down on a strong offer.
Questions for the listing agent
- Can we see the unit-by-unit rent roll, current vacancy, and any below-market leases? What's the average tenancy length?
- What capital expenditures (roof, boiler, parking lot, exteriors) have been made in the last 5 years, and what's planned in the next 2?
- Built in 1974 — when were the roof, HVAC, electrical panel, plumbing, and water heater last replaced?
- Is there a deadline driving the sale (1031 exchange, divorce, estate, relocation)? That informs how much negotiation room exists.
- Crime grade is F in this area — have there been break-ins, vandalism, or insurance claims at this property in the last 3 years? What carrier currently insures it and at what premium?
- What's the average days-on-market for RENTAL listings here right now (not sales)? A rising rental-DOM trend means longer vacancies and softer asking-rent achievability than the comps imply.
- What's the recent tenant-quality profile in this submarket — average credit score on applications, eviction rate, late-payment / NSF rate, and stable-employment percentage? A property-management company in the area should have these aggregated.
- How much new apartment / multifamily construction is in the pipeline within 1–3 miles? Heavy new supply (>2% of stock underway) typically softens rents 12–24 months out; light construction supports rent growth.
Investment metrics
- 1% rule
- 1.00% ✓
- Cap rate
- 7.70%
- Cash-on-cash
- 5.02%
- DSCR
- 1.22
- GRM
- 8.3
CMA / ARV
- ARV (on-the-fly)
- $297,216
- Comps found
- 2
Show comp detail 2 sales within ~0.75 mi
| Address | Dist | Beds/Ba | Sqft | Sold | Price | $/sf | Match |
|---|---|---|---|---|---|---|---|
| 5381 Portage St NW | 0.00mi | 4/2.0 | 1,728 (0%) | 0mo | $249,900 | $145 | 100 |
| 5415 Huckleberry St NW | 0.49mi | 4/2.0 | 1,512 (-12%) | 6mo | $260,000 | $172 | 51 |
Match score weights: distance 35% · size 25% · config 20% · recency 20%. Top-matched comps best support the ARV.
Projected returns pro-forma
-3.0% appreciation · 0.82% rent growth · sell at horizon
- IRR
- -10.9%
- Equity multiple
- 0.61×
- Total profit
- $-27,237
- Equity at exit
- $37,261
- IRR
- -5.0%
- Equity multiple
- 0.70×
- Total profit
- $-20,835
- Equity at exit
- $21,607
Cash invested: $69,972 (down + closing). Projections, not guarantees.
Landlord ↔ Tenant lean methodology
- Overall (STATE)
- 73 Landlord-Friendly
- State Ohio
- 73 Landlord-Friendly · R+6
- County
- — inherits STATE
- City
- — inherits STATE
ZIP-level market 44720
- Rents YoY
- 0.8%
- Active inventory
- 226
- Price-to-rent
- 16.6×
Monthly cashflow live
- Estimated rent
- $2,511 high interval (Pro) →
- Mortgage (P&I)
- −$1,311
- Tax from tax record
- −$277 /mo · $3,318/yr
- Insurance
- −$104
- HOA
- −$0
- Vacancy / Maint / Mgmt
- −$527
- Net cashflow
- $293
Break-even live
2-unit breakdown (identical units grouped — click to expand)
| Units | Beds | Baths | Est. rent |
|---|---|---|---|
| 2× units | 2 | 1 | $2,510 |
| #1 | 2 | 1 | $1,255 |
| #2 | 2 | 1 | $1,255 |
| Total (2 units) | $2,511 | ||
UW: 25.0% down · 7.5% · 30yr · 1.5% tax · 5.0% vac · 8.0% maint · 8.0% mgmt
Financing live
Cash to close
- Down payment
- $62,475
- Closing costs
- $7,497
- Reserves months
- —
- Total cash needed
- —
Loan-product check · same deal, 3 products live
Conventional
25% down · 7.5% · 30yr
- Down + closing
- —
- Monthly P&I
- —
- Monthly cashflow
- —
- DSCR
- —
- Eligible?
- —
Personal DTI + credit; lowest rate.
DSCR
20% down · 8.5% · 30yr
- Down + closing
- —
- Monthly P&I
- —
- Monthly cashflow
- —
- DSCR
- —
- Eligible?
- —
No personal income docs; deal must DSCR.
Hard money
10% down · 12.0% · 12mo
- Down + closing
- —
- Monthly P&I
- —
- Monthly cashflow
- —
- DSCR
- —
- Eligible?
- —
Short-term bridge; refi at stabilization.
Listing history 6 events
-
2026-06-02status $249,900 Pending 5 DOM
-
2026-06-01days on market $249,900 Active 5 DOM
-
2026-05-31days on market $249,900 Active 4 DOM
-
2026-05-30days on market $249,900 Active 3 DOM
-
2026-05-27$249,900 Active
-
1990-01-19soldstatus $80,000
ⓘ Source: listings_history table (triggers on properties + properties_extension) + one-shot
backfill from property_details.listing_events for pre-trigger history.
Tax reassessment forecast OH · Partial reset (capped growth)
- Current annual tax
- $3,318 · $277/mo
- Projected year-2 tax
- $3,608 · $301/mo
- Expected delta
- +$290/yr (+$24/mo · 8.7%)
ⓘ Screening estimate from a state-policy table — verify with the county assessor before closing.
Climate risk First Street
- Flood 1/10 Low FEMA zone X (unshaded) · 0% chance over 30 yrs
- Wildfire 1/10 Low
- Heat 3/10 Moderate 7 d/yr ≥96°F today · 17 d/yr by 30 yrs out
- Wind 1/10 Low
- Air quality 2/10 Low 1 unhealthy d/yr today · 2 by 30 yrs out
Nearby sold comps map
Loading sold comps map…
Walkable amenities ~0.75 mi
Loading nearby amenities…
Taxation est. · year 1
- Rental income
- $30,132
- − Mortgage interest
- −$13,998
- − Property taxes
- −$3,318
- − Insurance
- −$1,250
- − Repairs & maintenance
- −$2,411
- − Management
- −$2,411
- − Depreciation
- −$7,270
- Taxable loss
- −$525
- Est. tax savings @ 24.0%
- +$126
- After-tax cash flow
- $3,636/yr
For passive investors: Depreciation is non-cash, so a rental often shows a tax loss while cash-flowing — sheltering income. Rental losses are passive: they offset passive income freely, and up to $25,000/yr can offset ordinary (W-2) income if you actively participate and your MAGI is under $100k (phasing out to $0 by $150k); unused losses carry forward. On sale, claimed depreciation is recaptured at up to 25%, and gains may owe capital-gains tax (a 1031 exchange can defer both). Figures are a year-1 estimate at your 24.0% rate — not tax advice; consult a CPA.
Schools (NCES district)
- District
- Jackson Local
- NCES district ID
- 3904985
- Math proficiency
- 75% ▼ -9.00%
- Reading proficiency
- 78% ▼ -5.00%
- Median HH income
- $69,171
- Composite
- 66.58/100
- National rank
- #416
- State rank
- #67 of 656 in OH
Livability — Canton
- Score
- 71/100
- State rank
- #441
- US rank
- #7259
Category grades
Schools grade is shown separately in the Schools card above.
Census & demographics
- County
- Stark County · 272,865 people
- City population
- 103,614
- Metro
- Canton-Massillon, OH
- Population (ZIP)
- 39,851
- Household income
- $82,594
- Rent vs Own
- Severe rent burden
- 1068.0
Population outlook (Stark County) Hauer SSP2
- Today (2025)
- 373,708 people
- By 2030
- 371,245 · -0.7%
- By 2040
- 361,331 · -3.3%
- By 2050
- 345,290 · -7.6%
- By 2075
- 302,669 · -19.0%
- By 2100
- 238,870 · -36.1%
Race, ethnicity, and origin ACS 2023
- Neighborhood character
- Predominantly White (92%)
- Race & ethnicity
- White 92% Two or more races 3% Hispanic / Latino 2% Black 2% Asian 2%
- Common ancestry
- Romanian 5% Italian 4% Lithuanian 3%
- Foreign-born
- 3% · Canada, China
- Languages at home
- 97% English-only · Spanish 1% Other Indo-European 1%
Political lean MEDSL · Stark
- 2024 margin
- Strong R (+21.9) · D 38.6% · R 60.5%
- 2008→2024 swing
- -27.4pp toward R · 2008: 5.5pp · 2024: -21.9pp
- All cycles
- 2024: R+21.9 2020: R+18.5 2016: R+17.4 2012: R+0.4 2008: D+5.5
Not yet ingested
- Civics
- —
Market trends
- HPI YoY
- ▼ -218.69%
- Current HPI
- 215.4995
- Rent YoY
- ▲ 0.82%
- Metro
- Canton-Massillon, OH
- State GDP YoY
- ▲ 1.98%
- F500 in state
- 48
Industry mix (Fortune 500 HQ in OH)
| Industry | F500 HQs | Revenue |
|---|---|---|
| Insurance | 3 | $145B |
|
||
| Industrial Machinery | 3 | $49B |
|
||
| Financial Services | 3 | $24B |
|
||
| Consumer Goods | 2 | $93B |
|
||
| Aerospace / Defense | 2 | $47B |
|
||
| Utilities | 2 | $33B |
|
||
Price history
+212.4% since first listed2 events — show timeline
- 2026-05-27 Listed $249,900 MLSNOW
- 1990-01-19 Sold (Public Records) $80,000 Public Records
Property tax history
+2.8%/yrLatest (2024): $3,318 · +4.8% YoY. Source: county tax records.
Cash-flow waterfall
monthlySold comps — $/sqft
last 12 mo · ≤1 miLoading sold comps…