4091 Hollingsworth Dr SE · Palm Bay, FL
Flood risk No data
- FEMA flood zone
- —
- Chance of flooding over 30 yrs
- —
- Est. flood insurance / yr
- —
Fire risk No data
- Est. fire insurance / yr
- —
Heat risk No data
- Hot days now (above threshold)
- —
- Hot days in 30 yrs
- —
Wind risk No data
- Chance of severe wind over 30 yrs
- —
Air-quality risk No data
- Unhealthy air days now
- —
- Unhealthy air days in 30 yrs
- —
Risk factors via First Street. Map © Google.
Why this score? — see what drove the D- grade
The composite is a weighted blend of 9 inputs, each scored 0–100. Each bar is that input's sub-score; the figure is the points it added to the 100-point composite (weight × sub-score).
- Appreciation +10.0/10.0
- ARV discount +7.5/15.0
- Cash flow +5.5/30.0
- Schools +4.7/10.0
- Livability +3.6/5.0
- Rent growth +3.4/5.0
- Condition / age +2.5/5.0
- 1% rule +0.6/10.0
- DSCR +0.0/10.0
$439,990
🖨 Deal sheet 📄 Offer letter ✓ Due diligence
Listing remarks
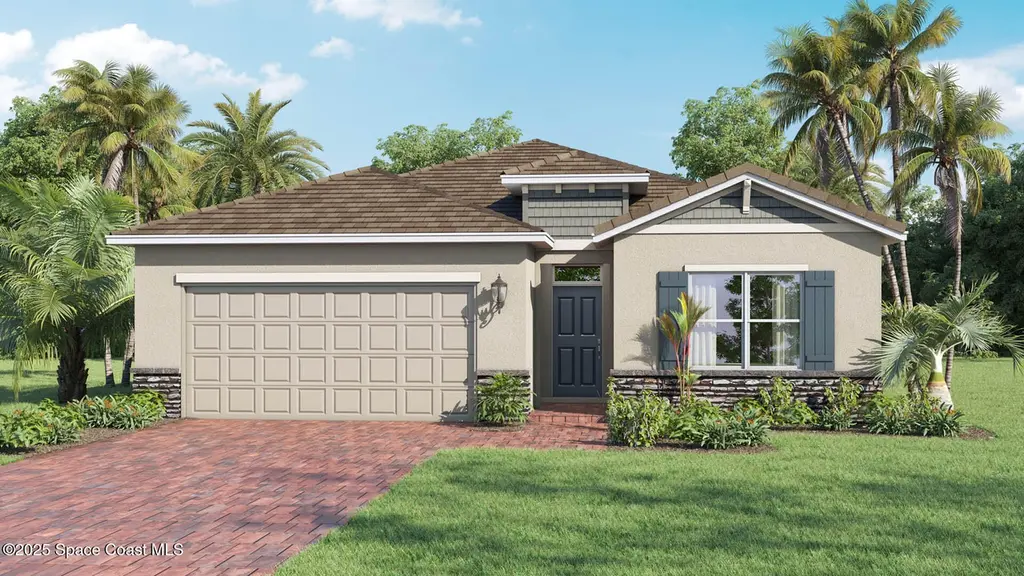
The Delray is a stunning one-story floorplan in our Cypress Bay West community in Palm Bay, Florida. Built with durable concrete block construction, this 4-bedroom, 2-bathroom home offers 2,034 square feet of living space. The open-concept design features oversized tile flooring in the main living and wet areas. The spacious kitchen includes an island with bar seating, quartz countertops, an oversized undermount sink, ample cabinet space, and stainless-steel appliances, all with a view of the oversized covered lanai. The primary bedroom has an en suite bathroom with double undermount sinks, quartz countertops, and two walk-in closets. Three additional bedrooms and a full bath are at the fro
Key facts
- One story floorplan
- Quartz countertops
- Spacious kitchen
Tags
Property features AI
Finance
- Other: Lot listed as approximately 0.15 acres
- HOA & community: Has association; Association dues $20.50 monthly (additional fee listed $155.25)
Exterior
- Parking: Garage
- Security: Smoke detector(s)
- Utilities: Public sewer; Water connected; Sewer connected; Electricity connected; Cable connected
- Home design: Single family residence; Faces north; New construction
- Construction: Block and stucco construction; Shingle roof
- Exterior features: Patio; Smoke detector(s)
Interior
- Kitchen: Dishwasher; Disposal; Electric oven; Electric range; Microwave; Refrigerator
- Bedrooms: 4 bedrooms
- Flooring: Carpet; Tile
- Bathrooms: 2 full bathrooms
- Heating & cooling: Central heating (electric); Central air (electric); Smart thermostat
- Interior features: Eat-in kitchen; Entrance foyer; Kitchen island; Pantry; Smart thermostat; Split bedrooms; Walk-in closet(s)
- Laundry & utility: Unfurnished (no built-in washer/dryer included indicated)
Neighborhood map
What this means for you Summary
Snapshot
- This is a 4-bed/2.0-bath land listed at $440k.
Deal economics
- At list price, monthly cash flow is $-940 ($-11k/yr) — negative.
- To cash-flow at today's rent, offer at most $274k (37.7% below list).
- To meet the 1% rule (rent ≥ 1% of price), the offer needs to be $247k (43.8% below list).
- Recommended offer: $247k (43.8% below list) — sets the bar for 1% rule.
Location & tenants
- Location reads 72/100 on livability (#366 in FL) — a middle-class / working-renter tenant base. Strengths: cost of living A+, housing A+; Watch: employment D+, amenities F, health & safety D-.
- Brevard (suburban): math 53% / reading 57% proficiency, ranked #19 of 73 in FL (top 26%) — acceptable for families but not a draw, mixed tenant base, ~2y average lease.
- Zoned schools: Sunrise Elementary School (math 52% / reading 57%, grade C, #892 of 2,144 statewide, top 44%, 759 students, 58% FRL); Southwest Middle School (math 40% / reading 39%, grade F, #373 of 571 statewide, top 66%, 920 students, 58% FRL); Bayside High School (math 27% / reading 40%, grade F, #400 of 667 statewide, top 61%, 1,854 students, 51% FRL).
- Zoned-school proficiency averages 42% at this address vs 55% district-wide (-12 pts) — the specific schools serving this property underperform the Brevard average; the district grade overstates school quality for this exact location.
- Market conditions: Rents rising (+3.7%/yr); 1111 active listings in the ZIP; 17 comparable units currently listed for rent nearby; rentals at typical pace (median 24d on market — plan ~3-4 weeks tenant-placement turnaround); solid renter incomes; 4,602 units permitted in Brevard County in 2024 (702 in 5+ unit buildings).
- This rent runs 37% of the median local income ($80k/yr) — at the standard rent-burdened threshold; future hikes will face affordability resistance.
Forward outlook
- In year one you build about $47k of equity ($3k loan paydown + $44k appreciation (10.0% local appreciation)).
- Brevard County population projected at +15% by 2050 — modest demand growth; plan on rents tracking national, not racing it.
- By year 2, paydown + projected appreciation supports a ~$76k cash-out refi (75% LTV) — recoverable capital for the next deal without selling this one.
Negotiation context
- It's been on market 28 days — a 2% lower offer ($433k) is reasonable based on typical stale-listing flexibility.
Questions for the listing agent
- What do current leases actually rent for vs. the listed asking? Can we see a recent rent roll and the last 12 months of T-12 income?
- What does the HOA fee cover, when was the last increase, and are there any pending special assessments or reserve-fund shortfalls?
- Is there a deadline driving the sale (1031 exchange, divorce, estate, relocation)? That informs how much negotiation room exists.
- The area grade is low — what's the realistic commute time and amenity access for the typical tenant pool here? Any planned neighborhood developments (good or bad) we should know about?
- What's the average days-on-market for RENTAL listings here right now (not sales)? A rising rental-DOM trend means longer vacancies and softer asking-rent achievability than the comps imply.
- What's the recent tenant-quality profile in this submarket — average credit score on applications, eviction rate, late-payment / NSF rate, and stable-employment percentage? A property-management company in the area should have these aggregated.
- How much new for-sale + rental construction is in the pipeline within 1–3 miles? Heavy new supply typically softens prices + rents 12–24 months out; constrained supply supports both.
Investment metrics
- 1% rule
- 0.56% ✗
- Cap rate
- 3.73%
- Cash-on-cash
- -9.15%
- DSCR
- 0.59
- GRM
- 14.8
CMA / ARV
No comps found within radius.
Projected returns pro-forma
10.0% appreciation · 3.67% rent growth · sell at horizon
- IRR
- 18.0%
- Equity multiple
- 2.47×
- Total profit
- $181,414
- Equity at exit
- $396,378
- IRR
- 16.9%
- Equity multiple
- 5.75×
- Total profit
- $584,683
- Equity at exit
- $854,804
Cash invested: $123,197 (down + closing). Projections, not guarantees.
Landlord ↔ Tenant lean methodology
- Overall (STATE)
- 87 Strongly Landlord-Friendly
- State Florida
- 87 Strongly Landlord-Friendly · R+3
- County
- — inherits STATE
- City
- — inherits STATE
ZIP-level market 32909
- Home prices YoY
- 6.0%
- Rents YoY
- 3.7%
- Active inventory
- 1111
- Price-to-rent
- 14.8×
Monthly cashflow live
- Estimated rent
- $2,472 high interval (Pro) →
- Mortgage (P&I)
- −$2,307
- Tax from tax record
- −$226 /mo · $2,716/yr
- Insurance
- −$183
- HOA
- −$175
- Vacancy / Maint / Mgmt
- −$519
- Net cashflow
- $-940
Break-even live
UW: 25.0% down · 7.5% · 30yr · 1.5% tax · 5.0% vac · 8.0% maint · 8.0% mgmt
Financing live
Cash to close
- Down payment
- $109,998
- Closing costs
- $13,200
- Reserves months
- —
- Total cash needed
- —
Loan-product check · same deal, 3 products live
Conventional
25% down · 7.5% · 30yr
- Down + closing
- —
- Monthly P&I
- —
- Monthly cashflow
- —
- DSCR
- —
- Eligible?
- —
Personal DTI + credit; lowest rate.
DSCR
20% down · 8.5% · 30yr
- Down + closing
- —
- Monthly P&I
- —
- Monthly cashflow
- —
- DSCR
- —
- Eligible?
- —
No personal income docs; deal must DSCR.
Hard money
10% down · 12.0% · 12mo
- Down + closing
- —
- Monthly P&I
- —
- Monthly cashflow
- —
- DSCR
- —
- Eligible?
- —
Short-term bridge; refi at stabilization.
Rent comps 17 comps
| Address | Beds | Baths | Sqft | Rent | $/sqft | DOM | Units | Dist |
|---|---|---|---|---|---|---|---|---|
| 1566 Criswell Ln SE Palm Bay, FL | 4.0 | 2.0 | 2046 | $2,400 | $1.17 | 23d | 1 | 0.08mi |
| 1434 Garabaldi Cir SE Palm Bay, FL | 4.0 | 2.0 | 1600 | $2,000 | $1.25 | 13d | 1 | 0.31mi |
| 1394 Garabaldi Cir SE Palm Bay, FL | 4.0 | 2.0 | 1876 | $2,500 | $1.33 | 19d | 1 | 0.32mi |
| 925 Dugan Cir SE Palm Bay, FL | 4.0 | 2.0 | 1830 | $2,295 | $1.25 | 13d | 1 | 0.39mi |
| 3636 Aberdeen Dr SE Palm Bay, FL | 4.0 | 2.0 | 1830 | $2,295 | $1.25 | 19d | 1 | 0.43mi |
| 1884 Middlebury Dr SE Palm Bay, FL | 3.0 | 2.0 | 1761 | $2,000 | $1.14 | 23d | 1 | 0.52mi |
| 3517 Rixford Way SE Palm Bay, FL | 4.0 | 3.0 | 2562 | $2,800 | $1.09 | 23d | 1 | 0.52mi |
| 1843 Middlebury Dr SE Palm Bay, FL | 4.0 | 2.0 | 1822 | $2,200 | $1.21 | 23d | 1 | 0.56mi |
| 1783 Dittmer Cir SE Palm Bay, FL | 4.0 | 2.0 | 2207 | $2,100 | $0.95 | 23d | 1 | 0.66mi |
| 1046 Grantham Ln SE Palm Bay, FL | 4.0 | 2.5 | 2405 | $3,100 | $1.29 | 23d | 1 | 0.80mi |
| 1496 Dittmer Cir SE Palm Bay, FL | 4.0 | 2.0 | 2187 | $2,440 | $1.12 | 14d | 1 | 0.81mi |
| 1063 Grantham Ln SE Palm Bay, FL | 3.0 | 2.0 | 1515 | $2,000 | $1.32 | 23d | 1 | 0.82mi |
| 2073 Farmhouse Rd SE Palm Bay, FL | 4.0 | 2.0 | 1830 | $2,133 | $1.17 | 23d | 1 | 1.00mi |
| 1453 Santa Anna St SE Palm Bay, FL | 3.0 | 2.0 | 1994 | $2,500 | $1.25 | 14d | 1 | 1.04mi |
| 2183 Farmhouse Rd SE Palm Bay, FL | 3.0 | 2.0 | 1676 | $2,000 | $1.19 | 23d | 1 | 1.09mi |
| 1213 Waterford St SE Palm Bay, FL | 4.0 | 2.0 | 1695 | $2,000 | $1.18 | 23d | 1 | 1.24mi |
| 3004 Suntan Ct SE Palm Bay, FL | 4.0 | 2.0 | 2388 | $2,900 | $1.21 | 23d | 1 | 1.39mi |
HOA detail
- Monthly dues
- $175 · $2,100/yr
Listing history 16 events
-
2026-06-18days on market $439,990 Active 28 DOM
-
2026-06-17days on market $439,990 Active 27 DOM
-
2026-06-16days on market $439,990 Active 26 DOM
-
2026-06-15days on market $439,990 Active 25 DOM
-
2026-06-14days on market $439,990 Active 23 DOM
-
2026-06-10days on market $439,990 Active 20 DOM
-
2026-06-08days on market $439,990 Active 18 DOM
-
2026-06-07days on market $439,990 Active 17 DOM
-
2026-06-05days on market $439,990 Active 14 DOM
-
2026-06-03days on market $439,990 Active 13 DOM
-
2026-06-02days on market $439,990 Active 12 DOM
-
2026-06-01days on market $439,990 Active 11 DOM
-
2026-05-31days on market $439,990 Active 10 DOM
-
2026-05-31days on market $439,990 Active 9 DOM
-
2026-05-21$439,990 Active
-
2025-09-10soldstatus $1,120,189
ⓘ Source: listings_history table (triggers on properties + properties_extension) + one-shot
backfill from property_details.listing_events for pre-trigger history.
Tax reassessment forecast FL · Resets to sale price
- Current annual tax
- $2,716 · $226/mo
- Projected year-2 tax
- $3,652 · $304/mo
- Expected delta
- +$935/yr (+$78/mo · 34.4%)
ⓘ Screening estimate from a state-policy table — verify with the county assessor before closing.
Nearby sold comps map
Loading sold comps map…
Walkable amenities ~0.75 mi
Loading nearby amenities…
Taxation est. · year 1
- Rental income
- $29,659
- − Mortgage interest
- −$24,646
- − Property taxes
- −$2,716
- − Insurance
- −$2,200
- − Repairs & maintenance
- −$2,373
- − Management
- −$2,373
- − HOA
- −$2,100
- − Depreciation
- −$12,800
- Taxable loss
- −$19,549
- Est. tax savings @ 24.0%
- +$4,692
- After-tax cash flow
- $-6,583/yr
For passive investors: Depreciation is non-cash, so a rental often shows a tax loss while cash-flowing — sheltering income. Rental losses are passive: they offset passive income freely, and up to $25,000/yr can offset ordinary (W-2) income if you actively participate and your MAGI is under $100k (phasing out to $0 by $150k); unused losses carry forward. On sale, claimed depreciation is recaptured at up to 25%, and gains may owe capital-gains tax (a 1031 exchange can defer both). Figures are a year-1 estimate at your 24.0% rate — not tax advice; consult a CPA.
Schools (NCES district)
- District
- Brevard
- NCES district ID
- 1200150
- Math proficiency
- 53% ▼ -9.00%
- Reading proficiency
- 57% ▼ -4.00%
- Median HH income
- $49,426
- Composite
- 46.86/100
- National rank
- #2370
- State rank
- #19 of 73 in FL
Livability — Palm Bay
- Score
- 72/100
- State rank
- #366
- US rank
- #6458
Category grades
Schools grade is shown separately in the Schools card above.
Census & demographics
- Census place
- Palm Bay, FL
- County
- Brevard County · 602,871 people
- City population
- 132,211
- Metro
- Palm Bay-Melbourne-Titusville, FL
- Population (ZIP)
- 41,804
- Household income
- $79,977
- Rent vs Own
- Severe rent burden
- 697.0
Population outlook (Brevard County) Hauer SSP2
- Today (2025)
- 623,254 people
- By 2030
- 648,420 · +4.0%
- By 2040
- 690,009 · +10.7%
- By 2050
- 715,669 · +14.8%
- By 2075
- 775,744 · +24.5%
- By 2100
- 776,687 · +24.6%
Race, ethnicity, and origin ACS 2023
- Neighborhood character
- Diverse neighborhood (Simpson 0.70)
- Race & ethnicity
- White 46% Black 21% Hispanic / Latino 20% Two or more races 16% Asian 4%
- Hispanic origin (detail)
- Mexican 2% Puerto Rican 8% Cuban 5%
- Common ancestry
- Hispanic 3% Slovak 2% Lithuanian 2%
- Foreign-born
- 17% · Canada, China, Jamaica
- Languages at home
- 84% English-only · Spanish 9% French/Haitian/Cajun 4% Chinese 1%
Political lean MEDSL · Brevard
- 2024 margin
- Strong R (+20.8) · D 39.1% · R 59.9% · Other 1.0%
- 2008→2024 swing
- -10.4pp toward R · 2008: -10.4pp · 2024: -20.8pp
- All cycles
- 2024: R+20.8 2020: R+16.4 2016: R+19.8 2012: R+12.7 2008: R+10.4
Not yet ingested
- Civics
- —
Market trends
- HPI YoY
- ▲ 18.81%
- Current HPI
- 330.8595
- Rent YoY
- ▲ 3.67%
- Metro
- Palm Bay-Melbourne-Titusville, FL
- State GDP YoY
- ▲ 3.28%
- F500 in state
- 36
Industry mix (Fortune 500 HQ in FL)
| Industry | F500 HQs | Revenue |
|---|---|---|
| Industrial Technology | 2 | $29B |
|
||
| Insurance | 2 | $17B |
|
||
| Retail | 1 | $60B |
|
||
| Technology Distribution | 1 | $58B |
|
||
| Homebuilding | 1 | $35B |
|
||
| Technology Manufacturing | 1 | $35B |
|
||
Price history
-60.7% since first listed2 events — show timeline
- 2026-05-21 Listed $439,990 SCMLS
- 2025-09-10 Sold (Public Records) $1,120,189 Public Records
Property tax history
+10.1%/yrLatest (2025): $2,716 · +10.1% YoY. Source: county tax records.
Cash-flow waterfall
monthlySold comps — $/sqft
last 12 mo · ≤1 miLoading sold comps…