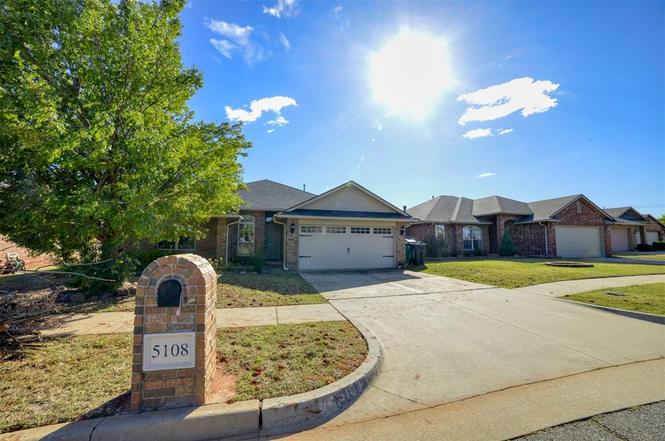
5108 NW 163rd St · Oklahoma City, OK
Flood risk 1/10 · Minimal
- FEMA flood zone
- X (unshaded)
- Chance of flooding over 30 yrs
- 0.0%
- Est. flood insurance / yr
- $507 – $1,088
Fire risk 4/10 · Minor
- Est. fire insurance / yr
- $2,463 – $4,575
Heat risk 6/10 · Moderate
- Hot days now (above 107°F)
- 7 days/yr
- Hot days in 30 yrs
- 19 days/yr
Wind risk 3/10 · Minor
- Chance of severe wind over 30 yrs
- 4.0%
Air-quality risk 2/10 · Minimal
- Unhealthy air days now
- 1 days/yr
- Unhealthy air days in 30 yrs
- 1 days/yr
Risk factors via First Street. Map © Google.
Why this score? — see what drove the D grade
The composite is a weighted blend of 9 inputs, each scored 0–100. Each bar is that input's sub-score; the figure is the points it added to the 100-point composite (weight × sub-score).
- ARV discount +11.9/15.0
- Cash flow +10.3/30.0
- Schools +4.1/10.0
- Livability +4.0/5.0
- Rent growth +3.3/5.0
- 1% rule +3.0/10.0
- DSCR +2.9/10.0
- Condition / age +2.5/5.0
- Appreciation +0.0/10.0
$255,000
🖨 Deal sheet (PDF) 📄 Offer letter ✓ Due diligence
Listing remarks MLS
Are you looking to get your kids in Deer Creek schools by August?! This location is for you! Beautiful home located within walking distance to Deer Creek Elementary. NEW carpet throughout the house! Perfect open floor plan with huge backyard! Entertaining will be easy with all this space! NEW side gate and new fence along west side of property. This home has 4 bedrooms, or 3 bedrooms and a study, two full baths and a fireplace in the master bedroom. The master bath has a shower, separate jacuzzi bathtub, TWO separate closets and double vanities. The double sided gas fireplace will keep you warm in the living room and the master bedroom all winter long. This house has it all! *** buyer to verify all information***
Key facts
- Spacious backyard
- Flexible floor plan
- Double vanities
Tags
Neighborhood map
What this means for you Summary
Snapshot
- This is a 3-bed/2.0-bath single-family listed at $255k.
Deal economics
- At list price, monthly cash flow is $-141 ($-2k/yr) — negative.
- To cash-flow at today's rent, offer at most $230k (9.7% below list).
- To meet the 1% rule (rent ≥ 1% of price), the offer needs to be $205k (19.6% below list).
- Recommended offer: $205k (19.6% below list) — sets the bar for 1% rule.
- Cap rate 5.6% vs local median 3.7% in Oklahoma City — top-decile yield for the area; either an underpriced asset or a hidden risk that comps aren't pricing in. Stress-test before assuming the spread holds.
Location & tenants
- Location reads 80/100 on livability (#3 in OK, #1,635 nationally) — a professional / high-income tenant draw. Strengths: amenities A+, commute A+, cost of living A+; Watch: crime F.
- Deer Creek (rural): math 41% / reading 44% proficiency, ranked #4 of 270 in OK (top 2%) — families likely to look elsewhere, expect single-tenant / working-renter base with shorter leases; only 7% free/reduced lunch — higher-income household profile.
- Zoned schools: Deer Creek Es (math 47% / reading 42%, grade F, #63 of 845 statewide, top 8%, 464 students, 0% FRL); Deer Creek Ms (math 35% / reading 43%, grade F, #10 of 345 statewide, top 3%, 1,179 students, 0% FRL); Deer Creek Hs (math 39% / reading 51%, grade D-, #13 of 447 statewide, top 3%, 2,036 students, 0% FRL).
- Market conditions: Rents rising (+3.1%/yr); 662 active listings in the ZIP; 16 comparable units currently listed for rent nearby; rentals leasing fast (median 4d on market — plan ~1-2 weeks tenant-placement turnaround); high-income renter base; 5,365 units permitted in Oklahoma County in 2024 (569 in 5+ unit buildings).
Forward outlook
- Local home prices are declining (-3.0%/yr); year-one equity from $2k of loan paydown is wiped out by about $8k of value loss. Plan a longer hold.
- Oklahoma County population projected at +41% by 2050 — long-run rental-demand tailwind backs the buy-and-hold thesis.
Negotiation context
- It's been on market 16 days — a 2% lower offer ($251k) is reasonable based on typical stale-listing flexibility.
- 4 sale attempts since 12y ago with the ask held roughly flat each time — persistent listings suggest the price (not the market) is what's stuck; bring a comps-based counter.
- Current owner paid $220k; 16% above their basis — modest negotiation headroom, anchor on the comps not their cost.
Risks & watch-outs
- Climate carrying-cost: extreme-heat days projected 7→19/yr by 2055 (HVAC capex compounding) — expect insurance premiums to compound above CPI over the hold.
Questions for the listing agent
- What do current leases actually rent for vs. the listed asking? Can we see a recent rent roll and the last 12 months of T-12 income?
- What does the HOA fee cover, when was the last increase, and are there any pending special assessments or reserve-fund shortfalls?
- Is there a deadline driving the sale (1031 exchange, divorce, estate, relocation)? That informs how much negotiation room exists.
- Schools are F-rated, which usually means shorter tenancies and higher turnover. Who's the typical renter profile here, and what's been the actual vacancy rate?
- Crime grade is F in this area — have there been break-ins, vandalism, or insurance claims at this property in the last 3 years? What carrier currently insures it and at what premium?
- The area grade is low — what's the realistic commute time and amenity access for the typical tenant pool here? Any planned neighborhood developments (good or bad) we should know about?
- What's the average days-on-market for RENTAL listings here right now (not sales)? A rising rental-DOM trend means longer vacancies and softer asking-rent achievability than the comps imply.
- What's the recent tenant-quality profile in this submarket — average credit score on applications, eviction rate, late-payment / NSF rate, and stable-employment percentage? A property-management company in the area should have these aggregated.
- How much new for-sale + rental construction is in the pipeline within 1–3 miles? Heavy new supply typically softens prices + rents 12–24 months out; constrained supply supports both.
Investment metrics
- 1% rule
- 0.80% ✗
- Cap rate
- 5.63%
- Cash-on-cash
- -2.36%
- DSCR
- 0.89
- GRM
- 10.4
CMA / ARV
- ARV (on-the-fly)
- $282,576
- Comps found
- 12
Show comp detail 12 sales within ~0.75 mi
| Address | Dist | Beds/Ba | Sqft | Sold | Price | $/sf | Match |
|---|---|---|---|---|---|---|---|
| 5108 NW 163rd St | 0.00mi | 4/2.0 (+1) | 1,624 (0%) | 0mo | $247,000 | $152 | 95 |
| 5109 NW 163 St | 0.03mi | 4/2.0 (+1) | 1,611 (-1%) | 10mo | $277,000 | $172 | 84 |
| 7912 NW 163rd St | 0.03mi | 3/2.0 | 1,700 (+5%) | 9mo | $374,950 | $221 | 84 |
| 16424 Monarch Field Rd | 0.15mi | 3/2.0 | 1,619 (-0%) | 11mo | $319,000 | $197 | 83 |
| 5112 NW 163rd St | 0.01mi | 3/2.0 | 1,532 (-6%) | 9mo | $269,900 | $176 | 83 |
| 15924 Prairie Run Dr | 0.33mi | 4/2.0 (+1) | 1,558 (-4%) | 8mo | $252,000 | $162 | 66 |
| 5905 NW 159th St | 0.66mi | 3/2.0 | 1,603 (-1%) | 2mo | $285,500 | $178 | 65 |
| 4709 NW 159th St | 0.33mi | 4/2.0 (+1) | 1,833 (+13%) | 3mo | $300,000 | $164 | 56 |
| 15920 Prairie Run Dr | 0.34mi | 3/2.0 | 1,402 (-14%) | 10mo | $260,000 | $185 | 53 |
| 4305 NW 164th Ter | 0.61mi | 3/2.0 | 1,804 (+11%) | 8mo | $280,000 | $155 | 46 |
| 4800 NW 153rd St | 0.75mi | 4/2.5 (+1) | 1,861 (+15%) | 3mo | $319,900 | $172 | 31 |
| 15508 Homecoming Dr | 0.64mi | 4/2.5 (+1) | 1,866 (+15%) | 11mo | $325,000 | $174 | 29 |
Match score weights: distance 35% · size 25% · config 20% · recency 20%. Top-matched comps best support the ARV.
Projected returns pro-forma
-3.0% appreciation · 3.14% rent growth · sell at horizon
- IRR
- -20.0%
- Equity multiple
- 0.30×
- Total profit
- $-49,954
- Equity at exit
- $38,021
- IRR
- -12.7%
- Equity multiple
- 0.25×
- Total profit
- $-53,717
- Equity at exit
- $22,048
Cash invested: $71,400 (down + closing). Projections, not guarantees.
Landlord ↔ Tenant lean methodology
- Overall (STATE)
- 83 Strongly Landlord-Friendly
- State Oklahoma
- 83 Strongly Landlord-Friendly · R+20
- County
- — inherits STATE
- City
- — inherits STATE
ZIP-level market 73013
- Rents YoY
- 3.1%
- Active inventory
- 662
- Price-to-rent
- 10.4×
Monthly cashflow live
- Estimated rent
- $2,049 high interval (Pro) →
- Mortgage (P&I)
- −$1,337
- Tax from tax record
- −$299 /mo · $3,587/yr
- Insurance
- −$106
- HOA
- −$17
- Vacancy / Maint / Mgmt
- −$430
- Net cashflow
- $-141
Break-even live
Sensitivity live
| Price | -10% $4 | -5% $-68 | +0% $-141 | +5% $-213 | +10% $-285 |
|---|---|---|---|---|---|
| Rent | -10% $-302 | -5% $-221 | +0% $-141 | +5% $-60 | +10% $21 |
| Rate | -1.0pp $-12 | -0.5pp $-76 | base $-141 | +0.5pp $-207 | +1.0pp $-274 |
UW: 25.0% down · 7.5% · 30yr · 1.5% tax · 5.0% vac · 8.0% maint · 8.0% mgmt
Financing live
Cash to close
- Down payment
- $63,750
- Closing costs
- $7,650
- Reserves months
- —
- Total cash needed
- —
Loan-product check · same deal, 3 products live
Conventional
25% down · 7.5% · 30yr
- Down + closing
- —
- Monthly P&I
- —
- Monthly cashflow
- —
- DSCR
- —
- Eligible?
- —
Personal DTI + credit; lowest rate.
DSCR
20% down · 8.5% · 30yr
- Down + closing
- —
- Monthly P&I
- —
- Monthly cashflow
- —
- DSCR
- —
- Eligible?
- —
No personal income docs; deal must DSCR.
Hard money
10% down · 12.0% · 12mo
- Down + closing
- —
- Monthly P&I
- —
- Monthly cashflow
- —
- DSCR
- —
- Eligible?
- —
Short-term bridge; refi at stabilization.
Rent comps 16 comps
| Address | Beds | Baths | Sqft | Rent | $/sqft | DOM | Units | Dist |
|---|---|---|---|---|---|---|---|---|
| 5108 NW 163rd St Edmond, OK | 4.0 | 2.0 | 1624 | $1,921 | $1.18 | 4d | 1 | 0.01mi |
| 4916 NW 164th Ter Edmond, OK | 3.0 | 2.0 | 1607 | $1,995 | $1.24 | 17d | 1 | 0.13mi |
| 6528 NW 163rd Ter Edmond, OK | 4.0 | 2.0 | 1783 | $2,095 | $1.17 | 25d | 1 | 1.12mi |
| 3916 NW 164th St Edmond, OK | 1.0–2.0 | 1.0–2.0 | 1121 | $2,235 | $1.99 | 3d | 12 | 1.14mi |
| 3925 NW 166th Ter Edmond, OK | 3.0 | 3.0 | 2102 | $5,000 | $2.38 | 4d | 1 | 1.14mi |
| 6508 NW 157th St Edmond, OK | 3.0 | 2.0 | 1516 | $1,795 | $1.18 | 25d | 1 | 1.18mi |
| 15316 Hill Branch Rd Edmond, OK | 3.0 | 2.0 | 1489 | $1,849 | $1.24 | 22d | 1 | 1.19mi |
| 15516 Potomac Dr Edmond, OK | 3.0 | 2.0 | 1234 | $1,695 | $1.37 | 3d | 1 | 1.23mi |
| 16209 Juliet Dr Edmond, OK | 3.0 | 2.0 | 1488 | $1,800 | $1.21 | 25d | 1 | 1.24mi |
| 16113 Juliet Dr Edmond, OK | 3.0 | 2.0 | 1625 | $1,890 | $1.16 | 4d | 1 | 1.25mi |
| 6705 NW 159th St Edmond, OK | 3.0 | 2.0 | 1665 | $1,875 | $1.13 | 4d | 1 | 1.25mi |
| 15512 Caney Dr Edmond, OK | 3.0 | 2.0 | 1457 | $1,795 | $1.23 | 3d | 1 | 1.28mi |
| 16009 Capulet Dr Edmond, OK | 4.0 | 2.0 | 1701 | $2,195 | $1.29 | 4d | 1 | 1.32mi |
| 6271 NW 178th Cir Edmond, OK | 4.0 | 2.0 | 2218 | $2,725 | $1.23 | 25d | 1 | 1.34mi |
| 6296 NW 178th Ter Edmond, OK | 3.0 | 2.0 | 1874 | $2,195 | $1.17 | 25d | 1 | 1.37mi |
| 15509 Ridley Dr Edmond, OK | 3.0 | 2.0 | 1682 | $1,995 | $1.19 | 3d | 1 | 1.43mi |
HOA detail
- Monthly dues
- $17 · $204/yr
- Likely covers
- gas
Listing history 12 events
-
2026-03-25status Pending
-
2026-03-09$255,000 Active
-
2026-02-28historical
-
2025-12-05price $259,000
-
2025-11-08$269,000 Active
-
2021-07-14soldstatus $220,000
-
2021-07-09soldstatus $220,000 Sold 724-char remark
Show marketing remark (724 chars)
Are you looking to get your kids in Deer Creek schools by August?! This location is for you! Beautiful home located within walking distance to Deer Creek Elementary. NEW carpet throughout the house! Perfect open floor plan with huge backyard! Entertaining will be easy with all this space! NEW side gate and new fence along west side of property. This home has 4 bedrooms, or 3 bedrooms and a study, two full baths and a fireplace in the master bedroom. The master bath has a shower, separate jacuzzi bathtub, TWO separate closets and double vanities. The double sided gas fireplace will keep you warm in the living room and the master bedroom all winter long. This house has it all! *** buyer to verify all information***
-
2021-06-22status Pending 724-char remark
Show marketing remark (724 chars)
Are you looking to get your kids in Deer Creek schools by August?! This location is for you! Beautiful home located within walking distance to Deer Creek Elementary. NEW carpet throughout the house! Perfect open floor plan with huge backyard! Entertaining will be easy with all this space! NEW side gate and new fence along west side of property. This home has 4 bedrooms, or 3 bedrooms and a study, two full baths and a fireplace in the master bedroom. The master bath has a shower, separate jacuzzi bathtub, TWO separate closets and double vanities. The double sided gas fireplace will keep you warm in the living room and the master bedroom all winter long. This house has it all! *** buyer to verify all information***
-
2021-06-17$214,700 Active 724-char remark
Show marketing remark (724 chars)
Are you looking to get your kids in Deer Creek schools by August?! This location is for you! Beautiful home located within walking distance to Deer Creek Elementary. NEW carpet throughout the house! Perfect open floor plan with huge backyard! Entertaining will be easy with all this space! NEW side gate and new fence along west side of property. This home has 4 bedrooms, or 3 bedrooms and a study, two full baths and a fireplace in the master bedroom. The master bath has a shower, separate jacuzzi bathtub, TWO separate closets and double vanities. The double sided gas fireplace will keep you warm in the living room and the master bedroom all winter long. This house has it all! *** buyer to verify all information***
-
2014-08-15soldstatus $176,500
-
2014-08-12soldstatus $176,100
-
2014-06-26$175,000
ⓘ Source: listings_history table (triggers on properties + properties_extension) + one-shot
backfill from property_details.listing_events for pre-trigger history.
Tax reassessment forecast OK · Resets to sale price
- Current annual tax
- $3,587 · $299/mo
- Projected year-2 tax
- $3,587 · $299/mo
- Expected delta
- $0/yr ($0/mo · 0.0%)
ⓘ Screening estimate from a state-policy table — verify with the county assessor before closing.
Climate risk First Street
- Flood 1/10 Low FEMA zone X (unshaded) · 0% chance over 30 yrs
- Wildfire 4/10 Moderate
- Heat 6/10 Major 7 d/yr ≥107°F today · 19 d/yr by 30 yrs out
- Wind 3/10 Moderate 4% chance of damaging wind over 30 yrs
- Air quality 2/10 Low 1 unhealthy d/yr today · 1 by 30 yrs out
Nearby sold comps map
Loading sold comps map…
Walkable amenities ~0.75 mi
Loading nearby amenities…
Taxation est. · year 1
- Rental income
- $24,590
- − Mortgage interest
- −$14,284
- − Property taxes
- −$3,587
- − Insurance
- −$1,275
- − Repairs & maintenance
- −$1,967
- − Management
- −$1,967
- − HOA
- −$204
- − Depreciation
- −$7,418
- Taxable loss
- −$6,112
- Est. tax savings @ 24.0%
- +$1,467
- After-tax cash flow
- $-220/yr
For passive investors: Depreciation is non-cash, so a rental often shows a tax loss while cash-flowing — sheltering income. Rental losses are passive: they offset passive income freely, and up to $25,000/yr can offset ordinary (W-2) income if you actively participate and your MAGI is under $100k (phasing out to $0 by $150k); unused losses carry forward. On sale, claimed depreciation is recaptured at up to 25%, and gains may owe capital-gains tax (a 1031 exchange can defer both). Figures are a year-1 estimate at your 24.0% rate — not tax advice; consult a CPA.
Schools (NCES district)
- District
- Deer Creek
- NCES district ID
- 4009570
- Math proficiency
- 41% ▼ -16.00%
- Reading proficiency
- 44% ▼ -14.00%
- Median HH income
- $101,218
- Composite
- 41.46/100
- National rank
- #3465
- State rank
- #4 of 270 in OK
Livability — Oklahoma City
- Score
- 80/100
- State rank
- #3
- US rank
- #1635
Category grades
Schools grade is shown separately in the Schools card above.
Census & demographics
- Census place
- Oklahoma City, OK
- County
- Oklahoma County · 771,644 people
- City population
- 498,656
- Metro
- Oklahoma City, OK
- Population (ZIP)
- 58,023
- Household income
- $113,870
- Rent vs Own
- Severe rent burden
- 1313.0
Population outlook (Oklahoma County) Hauer SSP2
- Today (2025)
- 911,875 people
- By 2030
- 982,413 · +7.7%
- By 2040
- 1,130,468 · +24.0%
- By 2050
- 1,288,422 · +41.3%
- By 2075
- 1,711,482 · +87.7%
- By 2100
- 2,088,448 · +129.0%
Race, ethnicity, and origin ACS 2023
- Neighborhood character
- Predominantly White (67%)
- Race & ethnicity
- White 67% Two or more races 11% Black 9% Asian 7% Hispanic / Latino 5% Native American 2%
- Hispanic origin (detail)
- Mexican 2%
- Common ancestry
- Slovak 3% Italian 2% Lithuanian 2%
- Foreign-born
- 7% · Canada, Vietnam
- Languages at home
- 91% English-only · Other Indo-European 3% Spanish 2% Vietnamese 1%
Political lean MEDSL · Oklahoma
- 2024 margin
- Toss-up / Even · D 48.0% · R 49.7% · Other 2.3%
- 2008→2024 swing
- +15.1pp toward D · 2008: -16.8pp · 2024: -1.7pp
- All cycles
- 2024: R+1.7 2020: R+1.1 2016: R+10.5 2012: R+16.7 2008: R+16.8
Not yet ingested
- Civics
- —
Market trends
- HPI YoY
- ▼ -201.41%
- Current HPI
- 214.2251
- Rent YoY
- ▲ 3.14%
- Metro
- Oklahoma City, OK
- State GDP YoY
- ▲ 1.55%
- F500 in state
- 6
Industry mix (Fortune 500 HQ in OK)
| Industry | F500 HQs | Revenue |
|---|---|---|
| Energy | 3 | $48B |
|
||
Price history
+45.7% since first listed12 events — show timeline
- 2026-03-25 Pending — MLSOK
- 2026-03-09 Listed $255,000 MLSOK
- 2026-02-28 Listing Removed — MLSOK
- 2025-12-05 Price Changed $259,000 MLSOK
- 2025-11-08 Listed $269,000 MLSOK
- 2021-07-14 Sold (Public Records) $220,000 Public Records
- 2021-07-09 Sold (MLS) $220,000 MLSOK
- 2021-06-22 Pending — MLSOK
- 2021-06-17 Listed $214,700 MLSOK
- 2014-08-15 Sold (Public Records) $176,500 Public Records
- 2014-08-12 Sold (MLS) $176,100 MLSOK
- 2014-06-26 Listed $175,000 MLSOK
Property tax history
+3.4%/yrLatest (2025): $3,587 · +3.7% YoY. Source: county tax records.
Cash-flow waterfall
monthlySold comps — $/sqft
last 12 mo · ≤1 miLoading sold comps…