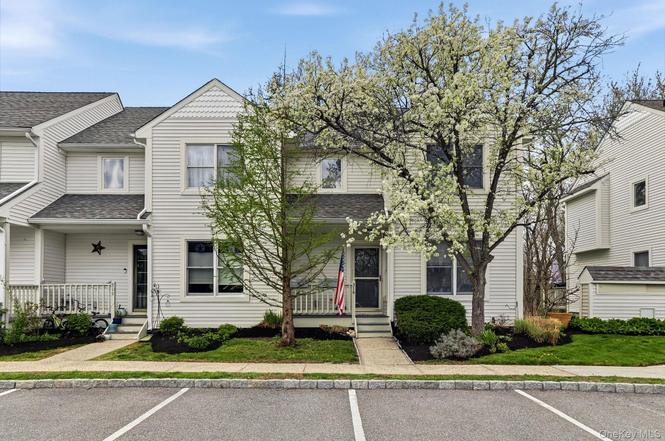
314 Cornwall Meadows Ln · Pawling, NY
Flood risk 1/10 · Minimal
- FEMA flood zone
- X (unshaded)
- Chance of flooding over 30 yrs
- 0.0%
- Est. flood insurance / yr
- $473 – $860
Fire risk 4/10 · Minor
- Est. fire insurance / yr
- $691 – $1,283
Heat risk 5/10 · Moderate
- Hot days now (above 97°F)
- 7 days/yr
- Hot days in 30 yrs
- 16 days/yr
Wind risk 4/10 · Minor
- Chance of severe wind over 30 yrs
- 18.0%
Air-quality risk 3/10 · Minor
- Unhealthy air days now
- 2 days/yr
- Unhealthy air days in 30 yrs
- 3 days/yr
Risk factors via First Street. Map © Google.
Why this score? — see what drove the B+ grade
The composite is a weighted blend of 9 inputs, each scored 0–100. Each bar is that input's sub-score; the figure is the points it added to the 100-point composite (weight × sub-score).
- Cash flow +30.0/30.0
- ARV discount +13.6/15.0
- 1% rule +10.0/10.0
- DSCR +10.0/10.0
- Schools +5.0/10.0
- Livability +4.0/5.0
- Rent growth +2.5/5.0
- Condition / age +2.5/5.0
- Appreciation +0.0/10.0
$439,000
🖨 Deal sheet (PDF) 📄 Offer letter ✓ Due diligence
Listing remarks
Welcome to this spacious, sun-filled end unit in the highly desirable Cornwall Meadows community. .. where thoughtful upgrades and exceptional details set this home apart from the rest. From the moment you step inside, you’ll notice the warmth of solid hardwood floors flowing throughout and the inviting living room centered around a beautiful fireplace featuring solid oak dentil molding, custom Mexican tile, and elegant built-in shelving. The recently remodeled kitchen is truly stunning, showcasing quartz countertops, fabulous custom tile flooring, striking glass backsplash, and soft-close cabinetry. Thoughtful details like recessed and under-cabinet lighting, custom corner cabinets,
Key facts
- Quartz countertops
- Beautiful fireplace
- Remodeled kitchen
Tags
Property features AI
Finance
- Other: Community pool: fenced, in-ground, outdoor pool with pool/spa combo (community); Basement: finished full basement with storage space and walk-out access; Partial attic
- HOA & community: Has homeowners association; Monthly association fee; Association amenities include clubhouse, dog park, fitness center, maintenance of grounds, park, playground, pool, parking, and snow removal; Association fee covers common area maintenance, exterior maintenance, grounds care, pool service, sewer, snow removal, trash, and water
Exterior
- Parking: Assigned parking; 2 parking spaces
- Utilities: Con-Edison electric; Public sewer; Cable connected; Electricity connected; Natural gas connected; Sewer connected; Trash collection (public); Water connected
- Home design: Townhouse / Single-family residence; Updated / remodeled condition
- Construction: Vinyl siding; Block foundation
- Exterior features: Lighting; Mailbox; Playground; Back yard; Front yard; Landscaped; Level lot; Wooded; Borders state land; Corner lot
Interior
- Kitchen: Dishwasher; Microwave; Oven; Range; Refrigerator; Stainless steel appliances
- Bedrooms: Tri-level layout; 8 total rooms (includes bedrooms and living spaces)
- Flooring: Carpet; Ceramic tile; Hardwood
- Bathrooms: 3 full bathrooms; 1 half bathroom
- Heating & cooling: Central air conditioning; Electric heating; Forced air; Natural gas
- Interior features: Chef's kitchen; Eat-in kitchen; Entrance foyer; Formal dining room; Open floorplan; Pantry; Primary bathroom; Quartz/Quartzite counters; Washer/dryer hookup; Covered patio/deck; Patio
- Laundry & utility: Washer; Dryer; Laundry located in hall; Water softener (owned)
Neighborhood map
What this means for you Summary
Snapshot
- This is a 2-bed/2.5-bath townhouse listed at $439k.
Deal economics
- At list price, monthly cash flow is $2k ($29k/yr) — positive.
- The deal already cash-flows at list — no discount required.
- Meets the 1% rule at list price ($8k rent vs $439k).
- Recommended offer: $432k (1.5% below list) — sets the bar for market timing.
Location & tenants
- Location reads 80/100 on livability (#107 in NY, #1,763 nationally) — a professional / high-income tenant draw. Strengths: crime A+, commute A+, employment A+; Watch: cost of living D, amenities F, health & safety D-.
- Carmel Central School District (suburban): math 46% / reading 63% proficiency, ranked #258 of 590 in NY (top 44%) — acceptable for families but not a draw, mixed tenant base, ~2y average lease; only 17% free/reduced lunch — higher-income household profile.
- Zoned schools: Matthew Paterson Elementary School (math 47% / reading 62%, grade C, #908 of 2,108 statewide, top 46%, 488 students, 41% FRL); George Fischer Middle School (math 21% / reading 56%, grade F, #437 of 729 statewide, top 60%, 1,130 students, 38% FRL); Carmel High School (math 97% / reading 87%, grade A+, #171 of 1,100 statewide, top 18%, 1,365 students, 36% FRL) — zoned schools average 38% FRL vs 17% district-wide (22 pts higher); higher-poverty schools than district average — tighter screening recommended.
- Market conditions: 50 active listings in the ZIP; 1 comparable units currently listed for rent nearby; 142 units permitted in Putnam County in 2024 (75 in 5+ unit buildings).
Forward outlook
- Local home prices are declining (-3.0%/yr); year-one equity from $3k of loan paydown is wiped out by about $13k of value loss. Plan a longer hold.
- Putnam County population projected to shrink 3% by 2050 — rents likely to lag national; underwrite the cash flow, not the appreciation.
- At projected returns (-3.0% appreciation + 3.0% rent growth), your $123k cash investment doubles in ~6 years — after that, you're playing with house money.
Negotiation context
- It's been on market 29 days — a 2% lower offer ($432k) is reasonable based on typical stale-listing flexibility.
- 2 sale attempts since 18y ago with the ask held roughly flat each time — persistent listings suggest the price (not the market) is what's stuck; bring a comps-based counter.
- Current owner paid $200k; list at $439k implies a 119% gain — meaningful room to come down on a strong offer.
Risks & watch-outs
- Climate carrying-cost: extreme-heat days projected 7→16/yr by 2055 (HVAC capex compounding) — expect insurance premiums to compound above CPI over the hold.
Questions for the listing agent
- What does the HOA fee cover, when was the last increase, and are there any pending special assessments or reserve-fund shortfalls?
- Is there a deadline driving the sale (1031 exchange, divorce, estate, relocation)? That informs how much negotiation room exists.
- Schools are A-rated — typically a magnet for longer-tenancy family renters. What's the average tenant stay here, and is there a school-zone premium baked into asking?
- What's the average days-on-market for RENTAL listings here right now (not sales)? A rising rental-DOM trend means longer vacancies and softer asking-rent achievability than the comps imply.
- What's the recent tenant-quality profile in this submarket — average credit score on applications, eviction rate, late-payment / NSF rate, and stable-employment percentage? A property-management company in the area should have these aggregated.
- How much new for-sale + rental construction is in the pipeline within 1–3 miles? Heavy new supply typically softens prices + rents 12–24 months out; constrained supply supports both.
Investment metrics
- 1% rule
- 1.82% ✓
- Cap rate
- 12.91%
- Cash-on-cash
- 23.64%
- DSCR
- 2.05
- GRM
- 4.6
CMA / ARV
- ARV (median comp)
- $507,694
- List price
- $439,000
- Delta
- -13.53%
- Verdict
- UNDERPRICED
- Comps
- 20 within 1.0 mi
Show comp detail 9 sales within ~0.75 mi
| Address | Dist | Beds/Ba | Sqft | Sold | Price | $/sf | Match |
|---|---|---|---|---|---|---|---|
| 217 Cornwall Meadows Ln | 0.05mi | 2/2.5 | 2,058 (-0%) | 11mo | $415,000 | $202 | 88 |
| 319 Cornwall Meadows Ln | 0.02mi | 2/2.5 | 2,058 (-0%) | 13mo | $345,000 | $168 | 88 |
| 316 Cornwall Meadows Ln | 0.01mi | 2/2.5 | 2,052 (-1%) | 16mo | $430,000 | $210 | 85 |
| 120 Cornwall Meadows Ln | 0.08mi | 2/2.5 | 2,066 (0%) | 22mo | $410,000 | $198 | 78 |
| 104 Cornwall Meadows Ln | 0.08mi | 2/2.5 | 2,058 (-0%) | 21mo | $335,000 | $163 | 78 |
| 422 Cornwall Meadows Ln | 0.07mi | 2/2.5 | 2,000 (-3%) | 17mo | $394,000 | $197 | 78 |
| 114 Cornwall Meadows Ln | 0.10mi | 2/3.0 | 2,162 (+5%) | 14mo | $391,050 | $181 | 74 |
| 425 Cornwall Meadows Ln | 0.06mi | 2/3.0 | 2,000 (-3%) | 21mo | $415,000 | $208 | 72 |
| 211 Cornwall Meadows Ln | 0.07mi | 2/2.5 | 1,828 (-12%) | 22mo | $430,000 | $235 | 59 |
Match score weights: distance 35% · size 25% · config 20% · recency 20%. Top-matched comps best support the ARV.
Projected returns pro-forma
-3.0% appreciation · 3.0% rent growth · sell at horizon
- IRR
- 16.9%
- Equity multiple
- 1.68×
- Total profit
- $83,736
- Equity at exit
- $65,456
- IRR
- 25.5%
- Equity multiple
- 3.23×
- Total profit
- $274,149
- Equity at exit
- $37,957
Cash invested: $122,920 (down + closing). Projections, not guarantees.
Landlord ↔ Tenant lean methodology
- Overall (STATE)
- 15 Strongly Tenant-Friendly
- State New York
- 15 Strongly Tenant-Friendly · D+10
- County
- — inherits STATE
- City
- — inherits STATE
ZIP-level market 12563
- Home prices YoY
- -12.7%
- Active inventory
- 50
- Price-to-rent
- 4.6×
Monthly cashflow live
- Estimated rent
- $8,000 medium interval (Pro) →
- Mortgage (P&I)
- −$2,302
- Tax from tax record
- −$896 /mo · $10,746/yr
- Insurance
- −$183
- HOA
- −$518
- Vacancy / Maint / Mgmt
- −$1,680
- Net cashflow
- $2,421
Break-even live
Sensitivity live
| Price | -10% $2,670 | -5% $2,546 | +0% $2,421 | +5% $2,297 | +10% $2,173 |
|---|---|---|---|---|---|
| Rent | -10% $1,789 | -5% $2,105 | +0% $2,421 | +5% $2,737 | +10% $3,053 |
| Rate | -1.0pp $2,642 | -0.5pp $2,533 | base $2,421 | +0.5pp $2,308 | +1.0pp $2,192 |
UW: 25.0% down · 7.5% · 30yr · 1.5% tax · 5.0% vac · 8.0% maint · 8.0% mgmt
Financing live
Cash to close
- Down payment
- $109,750
- Closing costs
- $13,170
- Reserves months
- —
- Total cash needed
- —
Loan-product check · same deal, 3 products live
Conventional
25% down · 7.5% · 30yr
- Down + closing
- —
- Monthly P&I
- —
- Monthly cashflow
- —
- DSCR
- —
- Eligible?
- —
Personal DTI + credit; lowest rate.
DSCR
20% down · 8.5% · 30yr
- Down + closing
- —
- Monthly P&I
- —
- Monthly cashflow
- —
- DSCR
- —
- Eligible?
- —
No personal income docs; deal must DSCR.
Hard money
10% down · 12.0% · 12mo
- Down + closing
- —
- Monthly P&I
- —
- Monthly cashflow
- —
- DSCR
- —
- Eligible?
- —
Short-term bridge; refi at stabilization.
Rent comps 1 comps
| Address | Beds | Baths | Sqft | Rent | $/sqft | DOM | Units | Dist |
|---|---|---|---|---|---|---|---|---|
| 90 Cushman Rd Patterson, NY | 3.0 | 2.0 | 2286 | $8,000 | $3.50 | 14d | 1 | 1.43mi |
HOA detail
- Monthly dues
- $518 · $6,216/yr
Listing history 5 events
-
2026-06-15statusdays on market $439,000 Pending 29 DOM
-
2026-04-22$439,000 Active 1893-char remark
-
2008-11-30historical
-
2008-05-20
-
1990-04-27soldstatus $200,030
ⓘ Source: listings_history table (triggers on properties + properties_extension) + one-shot
backfill from property_details.listing_events for pre-trigger history.
Tax reassessment forecast NY · Partial reset (capped growth)
- Current annual tax
- $10,746 · $896/mo
- Projected year-2 tax
- $10,746 · $896/mo
- Expected delta
- $0/yr ($0/mo · 0.0%)
ⓘ Screening estimate from a state-policy table — verify with the county assessor before closing.
Climate risk First Street
- Flood 1/10 Low FEMA zone X (unshaded) · 0% chance over 30 yrs
- Wildfire 4/10 Moderate
- Heat 5/10 Major 7 d/yr ≥97°F today · 16 d/yr by 30 yrs out
- Wind 4/10 Moderate 18% chance of damaging wind over 30 yrs
- Air quality 3/10 Moderate 2 unhealthy d/yr today · 3 by 30 yrs out
Nearby sold comps map
Loading sold comps map…
Walkable amenities ~0.75 mi
Loading nearby amenities…
Taxation est. · year 1
- Rental income
- $96,000
- − Mortgage interest
- −$24,591
- − Property taxes
- −$10,746
- − Insurance
- −$2,195
- − Repairs & maintenance
- −$7,680
- − Management
- −$7,680
- − HOA
- −$6,216
- − Depreciation
- −$12,771
- Taxable income
- $24,121
- Est. tax owed @ 24.0%
- −$5,789
- After-tax cash flow
- $23,268/yr
For passive investors: Depreciation is non-cash, so a rental often shows a tax loss while cash-flowing — sheltering income. Rental losses are passive: they offset passive income freely, and up to $25,000/yr can offset ordinary (W-2) income if you actively participate and your MAGI is under $100k (phasing out to $0 by $150k); unused losses carry forward. On sale, claimed depreciation is recaptured at up to 25%, and gains may owe capital-gains tax (a 1031 exchange can defer both). Figures are a year-1 estimate at your 24.0% rate — not tax advice; consult a CPA.
Schools (NCES district)
- District
- Carmel Central School District
- NCES district ID
- 3606570
- Math proficiency
- 46% ▼ -15.00%
- Reading proficiency
- 63% ▲ 11.00%
- Median HH income
- $87,665
- Composite
- 50.05/100
- National rank
- #1914
- State rank
- #258 of 590 in NY
Livability — Pawling
- Score
- 80/100
- State rank
- #107
- US rank
- #1763
Category grades
Schools grade is shown separately in the Schools card above.
Census & demographics
- Population (ZIP)
- 7,456
Population outlook (Putnam County) Hauer SSP2
- Today (2025)
- 99,705 people
- By 2030
- 99,650 · -0.1%
- By 2040
- 98,641 · -1.1%
- By 2050
- 96,348 · -3.4%
- By 2075
- 94,412 · -5.3%
- By 2100
- 88,728 · -11.0%
Race, ethnicity, and origin ACS 2023
- Neighborhood character
- Predominantly White (69%)
- Race & ethnicity
- White 69% Hispanic / Latino 17% Black 9% Two or more races 6% Asian 2%
- Hispanic origin (detail)
- Mexican 4% Puerto Rican 3% Cuban 1% Dominican 3%
- Common ancestry
- Romanian 5% Portuguese 2% Slovak 1%
- Foreign-born
- 14% · Canada, South Korea, Dominican Republic
- Languages at home
- 79% English-only · Spanish 12% Other Indo-European 3% Russian/Polish/Slavic 2%
Political lean MEDSL · Putnam
- 2024 margin
- R (+13.7) · D 43.2% · R 56.8%
- 2008→2024 swing
- -6.2pp toward R · 2008: -7.5pp · 2024: -13.7pp
- All cycles
- 2024: R+13.7 2020: R+7.9 2016: R+17.8 2012: R+11.2 2008: R+7.5
Not yet ingested
- Civics
- —
Market trends
- HPI YoY
- ▼ -36.07%
- Current HPI
- 247.1582
- Rent YoY
- —
- Metro
- —
- State GDP YoY
- ▲ 2.60%
- F500 in state
- 92
Industry mix (Fortune 500 HQ in NY)
| Industry | F500 HQs | Revenue |
|---|---|---|
| Financial Services | 10 | $950B |
|
||
| Consumer Goods | 9 | $162B |
|
||
| Insurance | 4 | $225B |
|
||
| Telecommunications | 2 | $144B |
|
||
| Pharmaceuticals | 2 | $112B |
|
||
| Media / Entertainment | 2 | $69B |
|
||
Price history
+119.5% since first listed5 events — show timeline
- 2026-06-15 Pending — OneKey® MLS as Distributed by MLS Grid
- 2026-04-22 Listed $439,000 OneKey® MLS as Distributed by MLS Grid
- 2008-11-30 Delisted — HGMLS
- 2008-05-20 Listed — HGMLS
- 1990-04-27 Sold (Public Records) $200,030 Public Records
Property tax history
+6.0%/yrLatest (2025): $10,746 · +7.2% YoY. Source: county tax records.
Cash-flow waterfall
monthlySold comps — $/sqft
last 12 mo · ≤1 miLoading sold comps…