 Multi-family
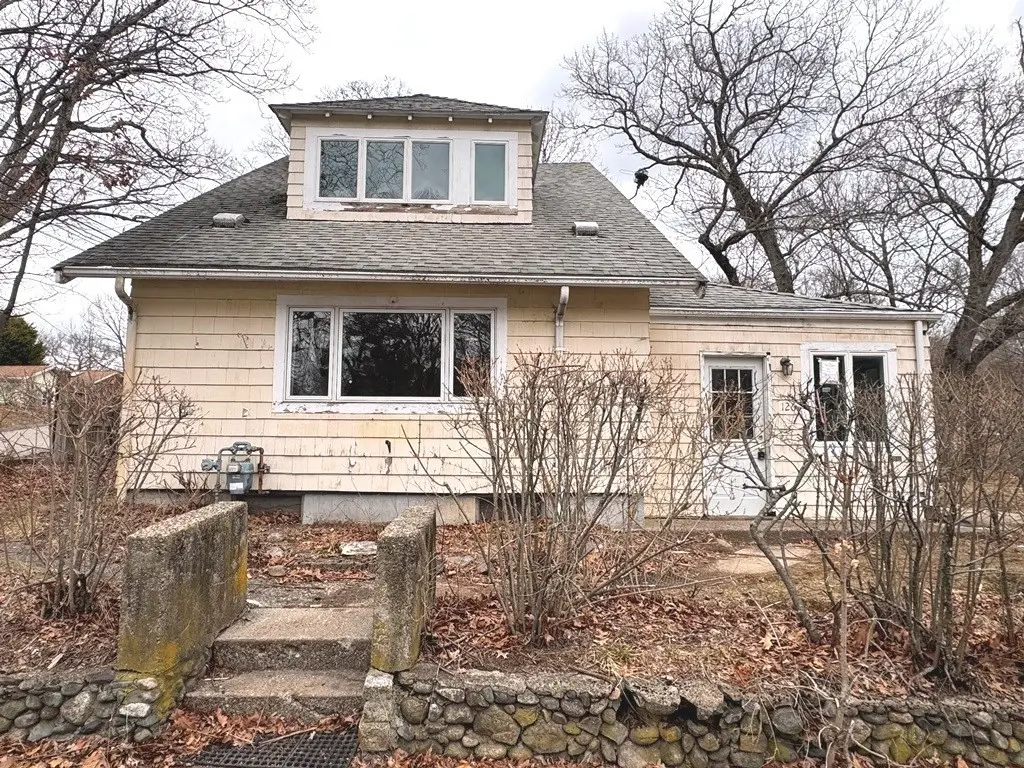
126 Lakehurst Ave · Weymouth Town, MA
Flood risk 1/10 · Minimal
- FEMA flood zone
- X (unshaded)
- Chance of flooding over 30 yrs
- 0.0%
- Est. flood insurance / yr
- $473 – $860
Fire risk 1/10 · Minimal
- Est. fire insurance / yr
- $915 – $1,699
Heat risk 5/10 · Moderate
- Hot days now (above 95°F)
- 7 days/yr
- Hot days in 30 yrs
- 15 days/yr
Wind risk 6/10 · Moderate
- Chance of severe wind over 30 yrs
- 77.0%
Air-quality risk 2/10 · Minimal
- Unhealthy air days now
- 1 days/yr
- Unhealthy air days in 30 yrs
- 2 days/yr
Risk factors via First Street. Map © Google.
Why this score? — see what drove the B- grade
The composite is a weighted blend of 9 inputs, each scored 0–100. Each bar is that input's sub-score; the figure is the points it added to the 100-point composite (weight × sub-score).
- Cash flow +25.9/30.0
- ARV discount +15.0/15.0
- DSCR +8.7/10.0
- 1% rule +6.6/10.0
- Livability +4.2/5.0
- Schools +3.5/10.0
- Condition / age +2.5/5.0
- Rent growth +2.4/5.0
- Appreciation +0.0/10.0
$436,500
🖨 Deal sheet (PDF) 📄 Offer letter ✓ Due diligence
Multi-family units
County records classify this as Multi-Family (2-4 Unit). Listing-text estimate: 1 unit. estimate disagrees with records
Listing remarks
Two-unit multifamily offering 3 total bedrooms, 2 full bathrooms, and approximately 1,980 square feet of living space. Strong opportunity for an owner-occupant or investor. The first-floor unit features 1 bedroom, 1 full bathroom, and an enclosed porch, while the second-floor unit offers 2 bedrooms and 1 full bathroom. Situated on a nice lot with a great side yard providing functional outdoor space. Additional features include a full basement for storage and off-street parking for at least 3 vehicles. Conveniently located near Whitmans Pond, local golf courses, restaurants, shopping, and other area amenities. Schedule your showing today.
Key facts
- Full basement
- Enclosed porch
- Large side yard
Tags
Property features AI
Finance
- HOA & community: Community features include access to public transportation, shopping, parks, golf, conservation areas, highway access, and public schools; Not a senior community
Exterior
- Parking: Four off-street parking spaces
- Utilities: Public water; Public sewer
- Home design: Multi-family property; Two stories; Yellow exterior
- Construction: Frame construction; Block foundation; Shingle roof; Built year per public records
- Exterior features: Covered patio/porch; Level lot; Public road frontage
Interior
- Flooring: Wood
- Bathrooms: Two full bathrooms
- Interior features: Seven total rooms; Full basement; Wood flooring; One fireplace
Neighborhood map
What this means for you Summary
Snapshot
- This is a 3-bed/2.0-bath multifamily listed at $436k.
Deal economics
- At list price, monthly cash flow is $1k ($13k/yr) — positive.
- The deal already cash-flows at list — no discount required.
- Meets the 1% rule at list price ($5k rent vs $436k).
- Recommended offer: $423k (3.0% below list) — sets the bar for market timing.
- Cap rate 9.2% vs local median 3.2% in Weymouth Town — top-decile yield for the area; either an underpriced asset or a hidden risk that comps aren't pricing in. Stress-test before assuming the spread holds.
Location & tenants
- Location reads 85/100 on livability (#11 in MA, #465 nationally) — a professional / high-income tenant draw. Strengths: amenities A+, commute A+, employment A+; Watch: cost of living F.
- Weymouth (suburban): math 32% / reading 45% proficiency, ranked #205 of 302 in MA (top 68%) — families likely to look elsewhere, expect single-tenant / working-renter base with shorter leases.
- Zoned schools: William Seach (math 17% / reading 32%, grade F, #721 of 938 statewide, top 79%, 356 students, 0% FRL); Abigail Adams Middle School (math 31% / reading 43%); Weymouth High School (math 32% / reading 45%, grade F, #233 of 343 statewide, top 69%, 1,807 students, 0% FRL) — zoned schools average 0% FRL vs 26% district-wide (26 pts lower); this property's tenant base skews higher-income than the district average.
- Market conditions: Rents soft (-0.2%/yr); 19 active listings in the ZIP; 8 comparable units currently listed for rent nearby; rentals leasing fast (median 0d on market — plan ~1-2 weeks tenant-placement turnaround); solid renter incomes; 958 units permitted in Norfolk County in 2024 (305 in 5+ unit buildings).
- At $5,048/mo this rent would consume 64% of the median local household income ($95k/yr) (locally 524% of renters already pay >50% of income on rent) — very limited rent-growth headroom before tenants either downsize or default.
Forward outlook
- Local home prices are declining (-3.0%/yr); year-one equity from $3k of loan paydown is wiped out by about $13k of value loss. Plan a longer hold.
- Norfolk County population projected at +10% by 2050 — modest demand growth; plan on rents tracking national, not racing it.
Negotiation context
- It's been on market 37 days — a 3% lower offer ($423k) is reasonable based on typical stale-listing flexibility.
Risks & watch-outs
- Watch-outs: built in 1923 — expect roof / HVAC / electrical / plumbing capex.
- Climate carrying-cost: major wind risk, 77% chance of damaging wind over 30y; extreme-heat days projected 7→15/yr by 2055 (HVAC capex compounding) — expect insurance premiums to compound above CPI over the hold.
Questions for the listing agent
- It's been on market 37 days. Have you received any prior offers? Is the seller open to a 3% concession, seller financing, or rate buy-down credit?
- Built in 1923 — when were the roof, HVAC, electrical panel, plumbing, and water heater last replaced?
- Is there a deadline driving the sale (1031 exchange, divorce, estate, relocation)? That informs how much negotiation room exists.
- What's the average days-on-market for RENTAL listings here right now (not sales)? A rising rental-DOM trend means longer vacancies and softer asking-rent achievability than the comps imply.
- What's the recent tenant-quality profile in this submarket — average credit score on applications, eviction rate, late-payment / NSF rate, and stable-employment percentage? A property-management company in the area should have these aggregated.
- How much new apartment / multifamily construction is in the pipeline within 1–3 miles? Heavy new supply (>2% of stock underway) typically softens rents 12–24 months out; light construction supports rent growth.
Investment metrics
- 1% rule
- 1.16% ✓
- Cap rate
- 9.25%
- Cash-on-cash
- 10.55%
- DSCR
- 1.47
- GRM
- 7.2
CMA / ARV
- ARV (median comp)
- $680,193
- List price
- $436,500
- Delta
- -35.83%
- Verdict
- UNDERPRICED
- Comps
- 3 within 1.0 mi
Show comp detail 1 sale within ~0.75 mi
| Address | Dist | Beds/Ba | Sqft | Sold | Price | $/sf | Match |
|---|---|---|---|---|---|---|---|
| 1035-1037 Pleasant St | 0.61mi | 4/2.0 (+1) | 2,230 (+13%) | 19mo | $795,000 | $357 | 30 |
Match score weights: distance 35% · size 25% · config 20% · recency 20%. Top-matched comps best support the ARV.
Projected returns pro-forma
-3.0% appreciation · 0.0% rent growth · sell at horizon
- IRR
- -3.9%
- Equity multiple
- 0.86×
- Total profit
- $-17,083
- Equity at exit
- $65,084
- IRR
- 2.1%
- Equity multiple
- 1.13×
- Total profit
- $16,119
- Equity at exit
- $37,741
Cash invested: $122,220 (down + closing). Projections, not guarantees.
Landlord ↔ Tenant lean methodology
- Overall (STATE)
- 20 Strongly Tenant-Friendly
- State Massachusetts
- 20 Strongly Tenant-Friendly · D+15
- County
- — inherits STATE
- City
- — inherits STATE
ZIP-level market 02189
- Rents YoY
- -0.2%
- Active inventory
- 19
- Price-to-rent
- 15.4×
Monthly cashflow live
- Estimated rent
- $5,048 high interval (Pro) →
- Mortgage (P&I)
- −$2,289
- Tax from tax record
- −$443 /mo · $5,311/yr
- Insurance
- −$182
- HOA
- −$0
- Vacancy / Maint / Mgmt
- −$1,060
- Net cashflow
- $1,074
Break-even live
Sensitivity live
| Price | -10% $1,322 | -5% $1,198 | +0% $1,074 | +5% $951 | +10% $827 |
|---|---|---|---|---|---|
| Rent | -10% $676 | -5% $875 | +0% $1,074 | +5% $1,274 | +10% $1,473 |
| Rate | -1.0pp $1,294 | -0.5pp $1,185 | base $1,074 | +0.5pp $961 | +1.0pp $846 |
2-unit breakdown (identical units grouped — click to expand)
| Units | Beds | Baths | Est. rent |
|---|---|---|---|
| 1× unit | 1 | 1 | $2,360 |
| 1× unit | 2 | 1 | $2,688 |
| Total (2 units) | $5,048 | ||
UW: 25.0% down · 7.5% · 30yr · 1.5% tax · 5.0% vac · 8.0% maint · 8.0% mgmt
Financing live
Cash to close
- Down payment
- $109,125
- Closing costs
- $13,095
- Reserves months
- —
- Total cash needed
- —
Loan-product check · same deal, 3 products live
Conventional
25% down · 7.5% · 30yr
- Down + closing
- —
- Monthly P&I
- —
- Monthly cashflow
- —
- DSCR
- —
- Eligible?
- —
Personal DTI + credit; lowest rate.
DSCR
20% down · 8.5% · 30yr
- Down + closing
- —
- Monthly P&I
- —
- Monthly cashflow
- —
- DSCR
- —
- Eligible?
- —
No personal income docs; deal must DSCR.
Hard money
10% down · 12.0% · 12mo
- Down + closing
- —
- Monthly P&I
- —
- Monthly cashflow
- —
- DSCR
- —
- Eligible?
- —
Short-term bridge; refi at stabilization.
Rent comps 8 comps
| Address | Beds | Baths | Sqft | Rent | $/sqft | DOM | Units | Dist |
|---|---|---|---|---|---|---|---|---|
| 1325 Washington St Weymouth, MA | 3.0 | 1.0–2.0 | 1008 | $4,813 | $4.77 | 0d | 20 | 0.55mi |
| 100 Queen Anne Dr Weymouth, MA | 3.0 | 1.0–2.0 | 929 | $3,505 | $3.77 | 0d | 18 | 0.69mi |
| 200 Burkhall St #505 Weymouth, MA | 2.0 | 2.0 | 1350 | $2,800 | $2.07 | 26d | 1 | 0.79mi |
| 38 Lake Shore Dr East Weymouth, MA | 4.0 | 4.5 | 2056 | $4,500 | $2.19 | 45d | 1 | 0.80mi |
| 1 Gradient Ct Weymouth, MA | 2.0 | 1.0–2.0 | 918 | $3,345 | $3.64 | 0d | 21 | 0.88mi |
| 80 Donald St Weymouth, MA | 3.0 | 1.0–2.0 | 877 | $4,001 | $4.56 | 0d | 32 | 0.98mi |
| 655 Washington St Weymouth, MA | 2.0 | 1.0–2.0 | 932 | $3,225 | $3.46 | 0d | 10 | 1.03mi |
| 89 Mill St #1 Weymouth, MA | 3.0 | 2.0 | 1800 | $3,300 | $1.83 | 45d | 1 | 1.45mi |
Listing history 16 events
-
2026-06-21days on market $436,500 Active 37 DOM
-
2026-06-18days on market $436,500 Active 34 DOM
-
2026-06-17days on market $436,500 Active 33 DOM
-
2026-06-16days on market $436,500 Active 32 DOM
-
2026-06-15days on market $436,500 Active 31 DOM
-
2026-06-13days on market $436,500 Active 29 DOM
-
2026-06-13days on market $436,500 Active 28 DOM
-
2026-06-09days on market $436,500 Active 25 DOM
-
2026-06-08days on market $436,500 Active 24 DOM
-
2026-06-07days on market $436,500 Active 23 DOM
-
2026-06-04days on market $436,500 Active 20 DOM
-
2026-06-03days on market $436,500 Active 19 DOM
-
2026-06-02days on market $436,500 Active 18 DOM
-
2026-06-01days on market $436,500 Active 17 DOM
-
2026-05-31days on market $436,500 Active 16 DOM
-
2026-05-15$436,500 New 645-char remark
ⓘ Source: listings_history table (triggers on properties + properties_extension) + one-shot
backfill from property_details.listing_events for pre-trigger history.
Tax reassessment forecast MA · Partial reset (capped growth)
- Current annual tax
- $5,311 · $443/mo
- Projected year-2 tax
- $5,340 · $445/mo
- Expected delta
- +$29/yr (+$2/mo · 0.5%)
ⓘ Screening estimate from a state-policy table — verify with the county assessor before closing.
Climate risk First Street
- Flood 1/10 Low FEMA zone X (unshaded) · 0% chance over 30 yrs
- Wildfire 1/10 Low
- Heat 5/10 Major 7 d/yr ≥95°F today · 15 d/yr by 30 yrs out
- Wind 6/10 Major 77% chance of damaging wind over 30 yrs
- Air quality 2/10 Low 1 unhealthy d/yr today · 2 by 30 yrs out
Nearby sold comps map
Loading sold comps map…
Walkable amenities ~0.75 mi
Loading nearby amenities…
Taxation est. · year 1
- Rental income
- $60,576
- − Mortgage interest
- −$24,451
- − Property taxes
- −$5,311
- − Insurance
- −$2,182
- − Repairs & maintenance
- −$4,846
- − Management
- −$4,846
- − Depreciation
- −$12,698
- Taxable income
- $6,241
- Est. tax owed @ 24.0%
- −$1,498
- After-tax cash flow
- $11,395/yr
For passive investors: Depreciation is non-cash, so a rental often shows a tax loss while cash-flowing — sheltering income. Rental losses are passive: they offset passive income freely, and up to $25,000/yr can offset ordinary (W-2) income if you actively participate and your MAGI is under $100k (phasing out to $0 by $150k); unused losses carry forward. On sale, claimed depreciation is recaptured at up to 25%, and gains may owe capital-gains tax (a 1031 exchange can defer both). Figures are a year-1 estimate at your 24.0% rate — not tax advice; consult a CPA.
Schools (NCES district)
- District
- Weymouth
- NCES district ID
- 2512840
- Math proficiency
- 32% ▼ -12.00%
- Reading proficiency
- 45% ▼ -5.00%
- Median HH income
- $69,444
- Composite
- 35.06/100
- National rank
- #5032
- State rank
- #205 of 302 in MA
Livability — Weymouth Town
- Score
- 85/100
- State rank
- #11
- US rank
- #465
Category grades
Schools grade is shown separately in the Schools card above.
Census & demographics
- Census place
- Weymouth Town, MA
- County
- Norfolk County · 644,082 people
- City population
- 57,786
- Metro
- Boston-Cambridge-Newton, MA-NH
- Population (ZIP)
- 14,450
- Household income
- $94,541
- Rent vs Own
- Severe rent burden
- 524.0
Population outlook (Norfolk County) Hauer SSP2
- Today (2025)
- 737,259 people
- By 2030
- 755,213 · +2.4%
- By 2040
- 786,961 · +6.7%
- By 2050
- 813,019 · +10.3%
- By 2075
- 861,214 · +16.8%
- By 2100
- 845,063 · +14.6%
Race, ethnicity, and origin ACS 2023
- Neighborhood character
- Predominantly White (76%)
- Race & ethnicity
- White 76% Black 9% Two or more races 6% Hispanic / Latino 5% Asian 5%
- Hispanic origin (detail)
- Puerto Rican 1% Cuban 1%
- Common ancestry
- Lithuanian 3% Romanian 2% Estonian 1%
- Foreign-born
- 12% · Canada, China, Vietnam
- Languages at home
- 87% English-only · Other Indo-European 3% Spanish 3% French/Haitian/Cajun 2%
Political lean MEDSL · Norfolk
- 2024 margin
- Strong D (+28.8) · D 63.3% · R 34.6% · Other 2.1%
- 2008→2024 swing
- +10.2pp toward D · 2008: 18.5pp · 2024: 28.8pp
- All cycles
- 2024: D+28.8 2020: D+36.3 2016: D+27.9 2012: D+16.1 2008: D+18.5
Not yet ingested
- Civics
- —
Market trends
- HPI YoY
- ▼ -270.48%
- Current HPI
- 303.3138
- Rent YoY
- ▼ -0.23%
- Metro
- Boston-Cambridge-Newton, MA-NH
- State GDP YoY
- ▲ 2.28%
- F500 in state
- 38
Industry mix (Fortune 500 HQ in MA)
| Industry | F500 HQs | Revenue |
|---|---|---|
| Technology | 3 | $17B |
|
||
| Insurance | 2 | $84B |
|
||
| Retail | 2 | $76B |
|
||
| Life Sciences | 1 | $43B |
|
||
| Energy Technology | 1 | $31B |
|
||
| Aerospace / Defense | 1 | $18B |
|
||
Price history
1 event — show timeline
- 2026-05-15 Listed $436,500 MLS PIN
Property tax history
+4.9%/yrLatest (2023): $5,311 · +3.0% YoY. Source: county tax records.
Cash-flow waterfall
monthlySold comps — $/sqft
last 12 mo · ≤1 miLoading sold comps…