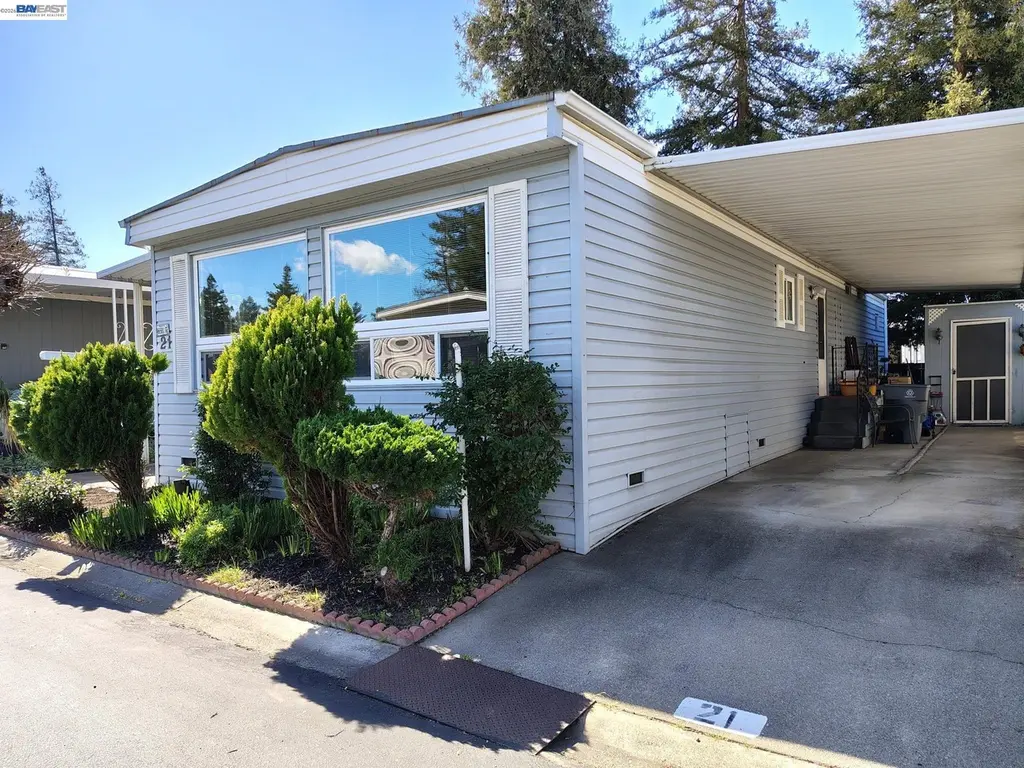
3231 Vineyard Ave #21 · Pleasanton, CA
Flood risk 1/10 · Minimal
- FEMA flood zone
- X (unshaded)
- Chance of flooding over 30 yrs
- 0.0%
- Est. flood insurance / yr
- $507 – $1,088
Fire risk 6/10 · Moderate
- Est. fire insurance / yr
- $659 – $1,223
Heat risk 4/10 · Minor
- Hot days now (above 97°F)
- 7 days/yr
- Hot days in 30 yrs
- 14 days/yr
Wind risk 1/10 · Minimal
- Chance of severe wind over 30 yrs
- —
Air-quality risk 9/10 · Severe
- Unhealthy air days now
- 19 days/yr
- Unhealthy air days in 30 yrs
- 21 days/yr
Risk factors via First Street. Map © Google.
Why this score? — see what drove the A- grade
The composite is a weighted blend of 9 inputs, each scored 0–100. Each bar is that input's sub-score; the figure is the points it added to the 100-point composite (weight × sub-score).
- Cash flow +30.0/30.0
- ARV discount +15.0/15.0
- 1% rule +10.0/10.0
- DSCR +10.0/10.0
- Schools +7.3/10.0
- Livability +4.2/5.0
- Rent growth +4.0/5.0
- Condition / age +2.5/5.0
- Appreciation +0.0/10.0
$125,000
🖨 Deal sheet 📄 Offer letter ✓ Due diligence
Listing remarks MLS
Well-maintained home in the very desirable Hacienda MH Park
Key facts
- Garage
- Community pool
- Listed 102 days
Neighborhood map
What this means for you Summary
Snapshot
- This is a 2-bed/2.0-bath manufactured listed at $125k.
Deal economics
- At list price, monthly cash flow is $2k ($20k/yr) — positive.
- The deal already cash-flows at list — no discount required.
- Meets the 1% rule at list price ($3k rent vs $125k).
- Recommended offer: $114k (9.0% below list) — sets the bar for market timing.
- Cap rate 22.0% vs local median 1.3% in Pleasanton — top-decile yield for the area; either an underpriced asset or a hidden risk that comps aren't pricing in. Stress-test before assuming the spread holds.
Location & tenants
- Location reads 84/100 on livability (#17 in CA, #655 nationally) — a professional / high-income tenant draw. Strengths: schools A+, amenities A+, commute A+; Watch: cost of living F.
- Pleasanton Unified (urban): math 75% / reading 79% proficiency, ranked #43 of 1,400 in CA (top 3%) — strong family-tenant draw, lease renewals of 3-5y typical; only 6% free/reduced lunch — higher-income household profile.
- Market conditions: Rents rising fast (+6.0%/yr); 152 active listings in the ZIP; 8 comparable units currently listed for rent nearby; rentals at typical pace (median 21d on market — plan ~3-4 weeks tenant-placement turnaround); high-income renter base; 1,742 units permitted in Alameda County in 2024 (856 in 5+ unit buildings).
Forward outlook
- Local home prices are declining (-3.0%/yr); year-one equity from $864 of loan paydown is wiped out by about $4k of value loss. Plan a longer hold.
- Alameda County population projected at +34% by 2050 — long-run rental-demand tailwind backs the buy-and-hold thesis.
- At projected returns (-3.0% appreciation + 6.0% rent growth), your $35k cash investment doubles in ~2 years — after that, you're playing with house money.
Negotiation context
- It's been on market 102 days — a 9% lower offer ($114k) is reasonable based on typical stale-listing flexibility.
- 3 sale attempts since 30y ago with the ask held roughly flat each time — persistent listings suggest the price (not the market) is what's stuck; bring a comps-based counter.
- Current owner paid $50k; list at $125k implies a 150% gain — meaningful room to come down on a strong offer.
Risks & watch-outs
- Climate carrying-cost: major wildfire risk — expect insurance premiums to compound above CPI over the hold.
Questions for the listing agent
- It's been on market 102 days. Have you received any prior offers? Is the seller open to a 9% concession, seller financing, or rate buy-down credit?
- Why hasn't it sold? Are there any deal-killer items the seller is aware of (foundation, flood, title, zoning, code violations)?
- Is there a deadline driving the sale (1031 exchange, divorce, estate, relocation)? That informs how much negotiation room exists.
- Schools are A-rated — typically a magnet for longer-tenancy family renters. What's the average tenant stay here, and is there a school-zone premium baked into asking?
- What's the average days-on-market for RENTAL listings here right now (not sales)? A rising rental-DOM trend means longer vacancies and softer asking-rent achievability than the comps imply.
- What's the recent tenant-quality profile in this submarket — average credit score on applications, eviction rate, late-payment / NSF rate, and stable-employment percentage? A property-management company in the area should have these aggregated.
- How much new for-sale + rental construction is in the pipeline within 1–3 miles? Heavy new supply typically softens prices + rents 12–24 months out; constrained supply supports both.
Investment metrics
- 1% rule
- 2.53% ✓
- Cap rate
- 22.00%
- Cash-on-cash
- 56.08%
- DSCR
- 3.50
- GRM
- 3.3
CMA / ARV
- ARV (median comp)
- $232,240
- List price
- $125,000
- Delta
- -46.18%
- Verdict
- UNDERPRICED
- Comps
- 16 within 1.0 mi
Show comp detail 12 sales within ~0.75 mi
| Address | Dist | Beds/Ba | Sqft | Sold | Price | $/sf | Match |
|---|---|---|---|---|---|---|---|
| 3231 Vineyard Ave #141 #141 | 0.09mi | 2/2.0 | 1,180 (+3%) | 3mo | $236,000 | $200 | 88 |
| 3231 Vineyard Ave #24 | 0.00mi | 2/2.0 | 1,120 (-2%) | 21mo | $175,000 | $156 | 79 |
| 3231 Vineyard Ave #132 | 0.00mi | 2/2.0 | 1,250 (+9%) | 7mo | $159,000 | $127 | 79 |
| 3263 Vineyard Ave #89 | 0.11mi | 2/2.0 | 1,250 (+9%) | 3mo | $280,000 | $224 | 77 |
| 3231 Vineyard #33 #33 | 0.14mi | 2/2.0 | 1,040 (-9%) | 2mo | $159,000 | $153 | 77 |
| 3231 Vineyard Ave #121 | 0.00mi | 2/2.0 | 1,248 (+9%) | 10mo | $225,000 | $180 | 76 |
| 3263 Vineyard #132 | 0.17mi | 2/2.0 | 1,248 (+9%) | 5mo | $185,000 | $148 | 73 |
| 3231 Vineyard #37 | 0.01mi | 2/2.0 | 1,296 (+13%) | 10mo | $270,000 | $208 | 70 |
| 3231 Vineyard Ave. #20 #20 | 0.05mi | 2/2.0 | 1,040 (-9%) | 22mo | $195,000 | $188 | 64 |
| 3263 Vineyard #68 | 0.14mi | 3/2.0 (+1) | 1,300 (+14%) | 2mo | $275,000 | $212 | 64 |
| 3263 Vineyard Ave #192 | 0.15mi | 2/2.0 | 1,050 (-8%) | 23mo | $160,000 | $152 | 60 |
| 3263 Vineyard #85 | 0.15mi | 3/2.0 (+1) | 1,308 (+14%) | 23mo | $285,000 | $218 | 45 |
Match score weights: distance 35% · size 25% · config 20% · recency 20%. Top-matched comps best support the ARV.
Projected returns pro-forma
-3.0% appreciation · 6.04% rent growth · sell at horizon
- IRR
- 57.9%
- Equity multiple
- 3.68×
- Total profit
- $93,947
- Equity at exit
- $18,638
- IRR
- 63.8%
- Equity multiple
- 8.42×
- Total profit
- $259,711
- Equity at exit
- $10,808
Cash invested: $35,000 (down + closing). Projections, not guarantees.
Landlord ↔ Tenant lean methodology
- Overall (STATE)
- 18 Strongly Tenant-Friendly
- State California
- 18 Strongly Tenant-Friendly · D+13
- County
- — inherits STATE
- City
- — inherits STATE
ZIP-level market 94566
- Rents YoY
- 6.0%
- Active inventory
- 152
- Price-to-rent
- 3.3×
Monthly cashflow live
- Estimated rent
- $3,164 high interval (Pro) →
- Mortgage (P&I)
- −$656
- Tax est. 1.5%
- −$156 /mo · $1,875/yr
- Insurance
- −$52
- HOA
- −$0
- Vacancy / Maint / Mgmt
- −$664
- Net cashflow
- $1,636
Break-even live
UW: 25.0% down · 7.5% · 30yr · 1.5% tax · 5.0% vac · 8.0% maint · 8.0% mgmt
Financing live
Cash to close
- Down payment
- $31,250
- Closing costs
- $3,750
- Reserves months
- —
- Total cash needed
- —
Loan-product check · same deal, 3 products live
Conventional
25% down · 7.5% · 30yr
- Down + closing
- —
- Monthly P&I
- —
- Monthly cashflow
- —
- DSCR
- —
- Eligible?
- —
Personal DTI + credit; lowest rate.
DSCR
20% down · 8.5% · 30yr
- Down + closing
- —
- Monthly P&I
- —
- Monthly cashflow
- —
- DSCR
- —
- Eligible?
- —
No personal income docs; deal must DSCR.
Hard money
10% down · 12.0% · 12mo
- Down + closing
- —
- Monthly P&I
- —
- Monthly cashflow
- —
- DSCR
- —
- Eligible?
- —
Short-term bridge; refi at stabilization.
Rent comps 8 comps
| Address | Beds | Baths | Sqft | Rent | $/sqft | DOM | Units | Dist |
|---|---|---|---|---|---|---|---|---|
| 749 Palomino Dr Unit C Pleasanton, CA | 2.0 | 1.5 | 1130 | $3,250 | $2.88 | 43d | 1 | 0.58mi |
| 835 Palomino Dr Unit 2 Pleasanton, CA | 2.0 | 1.5 | 1080 | $2,850 | $2.64 | 20d | 1 | 0.60mi |
| 3819 Vineyard Ave Pleasanton, CA | 1.0–3.0 | 1.0–1.5 | 863 | $2,940 | $3.40 | 1d | 14 | 0.70mi |
| 3847 Vineyard Ave Pleasanton, CA | 2.0 | 2.0 | 900 | $2,700 | $3.00 | 16d | 1 | 0.74mi |
| 242 Birch Creek Dr Pleasanton, CA | 2.0 | 2.5 | 1221 | $3,100 | $2.54 | 43d | 1 | 0.75mi |
| 3955 Vineyard Ave Pleasanton, CA | 1.0–2.0 | 1.0–1.5 | 829 | $3,436 | $4.14 | 1d | 5 | 0.86mi |
| 4059 Vineyard Ave Pleasanton, CA | 3.0 | 2.0 | 1300 | $3,850 | $2.96 | 24d | 1 | 0.93mi |
| 1539 Trimingham Dr Pleasanton, CA | 2.0 | 2.0 | 1369 | $3,600 | $2.63 | 2d | 1 | 1.20mi |
Listing history 20 events
-
2026-06-18days on market $125,000 Active 102 DOM
-
2026-06-17days on market $125,000 Active 101 DOM
-
2026-06-16days on market $125,000 Active 100 DOM
-
2026-06-15days on market $125,000 Active 99 DOM
-
2026-06-13days on market $125,000 Active 97 DOM
-
2026-06-13days on market $125,000 Active 96 DOM
-
2026-06-09days on market $125,000 Active 93 DOM
-
2026-06-08days on market $125,000 Active 92 DOM
-
2026-06-07days on market $125,000 Active 91 DOM
-
2026-06-04days on market $125,000 Active 88 DOM
-
2026-06-03days on market $125,000 Active 87 DOM
-
2026-06-02days on market $125,000 Active 86 DOM
-
2026-06-01days on market $125,000 Active 85 DOM
-
2026-05-31days on market $125,000 Active 84 DOM
-
2026-03-08$125,000 Active 59-char remark
Show marketing remark (59 chars)
Well-maintained home in the very desirable Hacienda MH Park
-
1996-12-17soldstatus $50,000 112-char remark
Show marketing remark (112 chars)
PRICED TO SELL/CHECK YOUR COMPS/NEW CARPET CLEAR TERMITE REPORT/INCLUDES REFRIG- WASHER-DRYER/NO NEED TO PREVIEW
-
1996-12-17soldstatus $50,000
Show marketing remark (112 chars)
PRICED TO SELL/CHECK YOUR COMPS/NEW CARPET CLEAR TERMITE REPORT/INCLUDES REFRIG- WASHER-DRYER/NO NEED TO PREVIEW
-
1996-11-08historical 112-char remark
Show marketing remark (112 chars)
PRICED TO SELL/CHECK YOUR COMPS/NEW CARPET CLEAR TERMITE REPORT/INCLUDES REFRIG- WASHER-DRYER/NO NEED TO PREVIEW
-
1996-09-25$55,000 112-char remark
Show marketing remark (112 chars)
PRICED TO SELL/CHECK YOUR COMPS/NEW CARPET CLEAR TERMITE REPORT/INCLUDES REFRIG- WASHER-DRYER/NO NEED TO PREVIEW
-
1996-09-25$55,000
Show marketing remark (112 chars)
PRICED TO SELL/CHECK YOUR COMPS/NEW CARPET CLEAR TERMITE REPORT/INCLUDES REFRIG- WASHER-DRYER/NO NEED TO PREVIEW
ⓘ Source: listings_history table (triggers on properties + properties_extension) + one-shot
backfill from property_details.listing_events for pre-trigger history.
Climate risk First Street
- Flood 1/10 Low FEMA zone X (unshaded) · 0% chance over 30 yrs
- Wildfire 6/10 Major
- Heat 4/10 Moderate 7 d/yr ≥97°F today · 14 d/yr by 30 yrs out
- Wind 1/10 Low
- Air quality 9/10 Extreme 19 unhealthy d/yr today · 21 by 30 yrs out
Nearby sold comps map
Loading sold comps map…
Walkable amenities ~0.75 mi
Loading nearby amenities…
Taxation est. · year 1
- Rental income
- $37,969
- − Mortgage interest
- −$7,002
- − Property taxes
- −$1,875
- − Insurance
- −$625
- − Repairs & maintenance
- −$3,037
- − Management
- −$3,037
- − Depreciation
- −$3,636
- Taxable income
- $18,755
- Est. tax owed @ 24.0%
- −$4,501
- After-tax cash flow
- $15,128/yr
For passive investors: Depreciation is non-cash, so a rental often shows a tax loss while cash-flowing — sheltering income. Rental losses are passive: they offset passive income freely, and up to $25,000/yr can offset ordinary (W-2) income if you actively participate and your MAGI is under $100k (phasing out to $0 by $150k); unused losses carry forward. On sale, claimed depreciation is recaptured at up to 25%, and gains may owe capital-gains tax (a 1031 exchange can defer both). Figures are a year-1 estimate at your 24.0% rate — not tax advice; consult a CPA.
Schools (NCES district)
- District
- Pleasanton Unified
- NCES district ID
- 0600020
- Math proficiency
- 75% ▼ -1.00%
- Reading proficiency
- 79% ▼ -1.00%
- Median HH income
- $123,770
- Composite
- 73.12/100
- National rank
- #351
- State rank
- #43 of 1400 in CA
Livability — Pleasanton
- Score
- 84/100
- State rank
- #17
- US rank
- #655
Category grades
Schools grade is shown separately in the Schools card above.
Census & demographics
- Census place
- Pleasanton, CA
- County
- Alameda County · 1,614,355 people
- City population
- 78,550
- Metro
- San Francisco-Oakland-Berkeley, CA
- Population (ZIP)
- 44,222
- Household income
- $191,155
- Rent vs Own
- Severe rent burden
- 1190.0
Population outlook (Alameda County) Hauer SSP2
- Today (2025)
- 1,928,884 people
- By 2030
- 2,069,146 · +7.3%
- By 2040
- 2,338,405 · +21.2%
- By 2050
- 2,586,608 · +34.1%
- By 2075
- 3,061,911 · +58.7%
- By 2100
- 3,234,133 · +67.7%
Race, ethnicity, and origin ACS 2023
- Neighborhood character
- Diverse neighborhood (Simpson 0.66)
- Race & ethnicity
- White 42% Asian 38% Hispanic / Latino 13% Two or more races 10%
- Hispanic origin (detail)
- Mexican 9%
- Common ancestry
- Italian 3% Russian 3% Romanian 2%
- Foreign-born
- 33% · China, Canada, South Korea
- Languages at home
- 59% English-only · Other Indo-European 10% Chinese 10% Spanish 8%
Political lean MEDSL · Alameda
- 2024 margin
- Solid D (+53.6) · D 74.6% · R 21.0% · Other 4.4%
- 2008→2024 swing
- -5.9pp toward R · 2008: 59.5pp · 2024: 53.6pp
- All cycles
- 2024: D+53.6 2020: D+62.5 2016: D+64.4 2012: D+59.8 2008: D+59.5
Not yet ingested
- Civics
- —
Market trends
- HPI YoY
- ▼ -841.68%
- Current HPI
- 308.8324
- Rent YoY
- ▲ 6.04%
- Metro
- San Francisco-Oakland-Berkeley, CA
- State GDP YoY
- ▲ 3.21%
- F500 in state
- 116
Industry mix (Fortune 500 HQ in CA)
| Industry | F500 HQs | Revenue |
|---|---|---|
| Technology | 27 | $1,492B |
|
||
| Financial Services | 3 | $174B |
|
||
| Retail | 3 | $44B |
|
||
| Insurance | 3 | $26B |
|
||
| Media / Entertainment | 2 | $115B |
|
||
| Pharmaceuticals / Biotech | 2 | $62B |
|
||
Price history
+127.3% since first listed6 events — show timeline
- 2026-03-08 Listed $125,000 bridgeMLS, Bay East AOR, or Contra Costa AOR
- 1996-12-17 Sold (MLS) $50,000 bridgeMLS, Bay East AOR, or Contra Costa AOR
- 1996-12-17 Sold (MLS) $50,000 bridgeMLS, Bay East AOR, or Contra Costa AOR
- 1996-11-08 Listing Removed — bridgeMLS, Bay East AOR, or Contra Costa AOR
- 1996-09-25 Listed $55,000 bridgeMLS, Bay East AOR, or Contra Costa AOR
- 1996-09-25 Listed $55,000 bridgeMLS, Bay East AOR, or Contra Costa AOR
Cash-flow waterfall
monthlySold comps — $/sqft
last 12 mo · ≤1 miLoading sold comps…