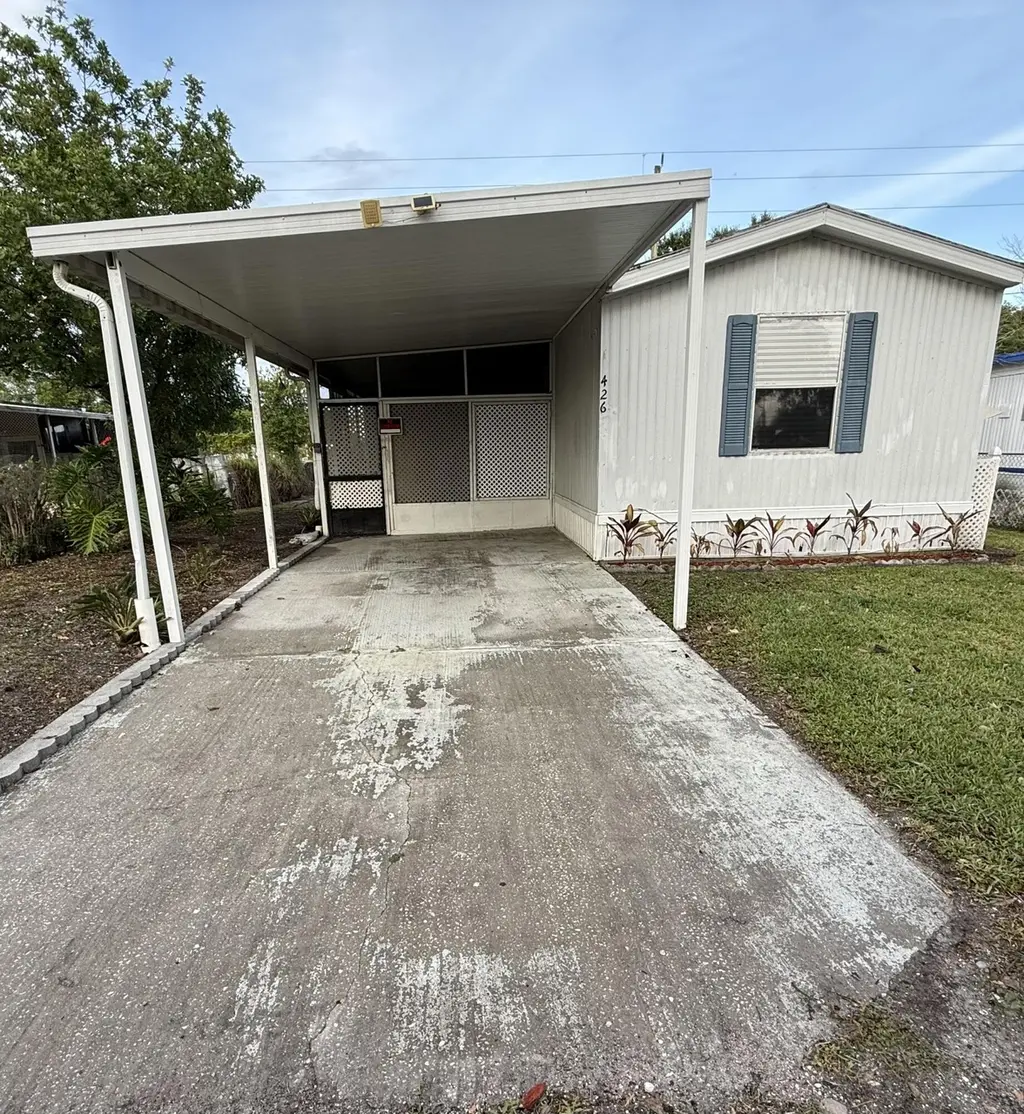
426 NE 31st Ter · Cypress Quarters, FL
Flood risk 1/10 · Minimal
- FEMA flood zone
- X (unshaded)
- Chance of flooding over 30 yrs
- 0.0%
- Est. flood insurance / yr
- $507 – $1,088
Fire risk 5/10 · Moderate
- Est. fire insurance / yr
- $947 – $1,759
Heat risk 9/10 · Severe
- Hot days now (above 108°F)
- 7 days/yr
- Hot days in 30 yrs
- 24 days/yr
Wind risk 10/10 · Severe
- Chance of severe wind over 30 yrs
- 99.0%
Air-quality risk 2/10 · Minimal
- Unhealthy air days now
- 1 days/yr
- Unhealthy air days in 30 yrs
- 2 days/yr
Risk factors via First Street. Map © Google.
Why this score? — see what drove the C- grade
The composite is a weighted blend of 9 inputs, each scored 0–100. Each bar is that input's sub-score; the figure is the points it added to the 100-point composite (weight × sub-score).
- Cash flow +25.2/30.0
- DSCR +8.3/10.0
- 1% rule +6.4/10.0
- Schools +3.6/10.0
- Livability +3.1/5.0
- Rent growth +2.5/5.0
- Condition / age +2.5/5.0
- ARV discount +0.0/15.0
- Appreciation +0.0/10.0
$115,000
🖨 Deal sheet (PDF) 📄 Offer letter ✓ Due diligence
Listing remarks
3/2 Mobile Home on Fenced lot. Cash Only, as-is sale. Great Opportunity for investors or buyers looking to add value. Bring your Vision! NO HOA. NO Lot Rent.
Key facts
- 5,133 sq ft lot
- Parking
- Built 1993
Property features AI
Finance
- Other: Pets allowed with no restrictions
Exterior
- Parking: Attached carport (1 covered space) and driveway; 1 open parking space
- Security: Smoke detectors
- Utilities: Well water; Septic tank; Water available
- Home design: Mobile home; One story; Resale condition; Faces west
- Construction: Wood siding; Modular construction; Aluminum roof; Built as single-story; Total living area reported as 784
- Exterior features: No waterfront
Interior
- Kitchen: Electric range; Microwave; Refrigerator
- Bedrooms: 3 main-level bedrooms
- Flooring: Laminate flooring
- Bathrooms: 2 full bathrooms (main level)
- Heating & cooling: Central heating; Central air; Ceiling fans
- Interior features: Split bedroom layout
- Laundry & utility: Laundry inside
Neighborhood map
What this means for you Summary
Snapshot
- This is a 2-bed/1.0-bath manufactured listed at $115k.
Deal economics
- At list price, monthly cash flow is $259 ($3k/yr) — positive.
- The deal already cash-flows at list — no discount required.
- Meets the 1% rule at list price ($1k rent vs $115k).
- Recommended offer: $112k (3.0% below list) — sets the bar for market timing.
Location & tenants
- Location reads 62/100 on livability (#760 in FL) — a middle-class / working-renter tenant base. Strengths: crime A+, cost of living A+, housing A-; Watch: amenities F, commute F, employment F.
- Okeechobee (town): math 44% / reading 42% proficiency, ranked #58 of 73 in FL (top 80%) — families likely to look elsewhere, expect single-tenant / working-renter base with shorter leases; 72% free/reduced lunch — lower-income household profile, screen leases tightly.
- Zoned schools: Everglades Elementary School (math 53% / reading 52%, grade C-, #976 of 2,144 statewide, top 46%, 760 students, 76% FRL); Osceola Middle School (math 53% / reading 36%, grade D, #320 of 571 statewide, top 57%, 753 students, 67% FRL); Okeechobee High School (math 30% / reading 42%, grade F, #359 of 667 statewide, top 55%, 1,692 students, 62% FRL) — zoned schools at 68% FRL track the district average.
- Market conditions: 405 active listings in the ZIP; 18 units permitted in Okeechobee County in 2024 (0 in 5+ unit buildings).
Forward outlook
- Local home prices are declining (-3.0%/yr); year-one equity from $795 of loan paydown is wiped out by about $3k of value loss. Plan a longer hold.
- Okeechobee County population projected at -21% by 2050 — secular population decline; favor cash flow + early exit over multi-decade hold.
Negotiation context
- It's been on market 58 days — a 3% lower offer ($112k) is reasonable based on typical stale-listing flexibility.
- Current owner paid $55k; list at $115k implies a 109% gain — meaningful room to come down on a strong offer.
Risks & watch-outs
- Climate carrying-cost: severe wind risk, 99% chance of damaging wind over 30y; moderate wildfire risk; extreme-heat days projected 7→24/yr by 2055 (HVAC capex compounding) — expect insurance premiums to compound above CPI over the hold.
Questions for the listing agent
- It's been on market 58 days. Have you received any prior offers? Is the seller open to a 3% concession, seller financing, or rate buy-down credit?
- Is there a deadline driving the sale (1031 exchange, divorce, estate, relocation)? That informs how much negotiation room exists.
- Schools are F-rated, which usually means shorter tenancies and higher turnover. Who's the typical renter profile here, and what's been the actual vacancy rate?
- What's the average days-on-market for RENTAL listings here right now (not sales)? A rising rental-DOM trend means longer vacancies and softer asking-rent achievability than the comps imply.
- What's the recent tenant-quality profile in this submarket — average credit score on applications, eviction rate, late-payment / NSF rate, and stable-employment percentage? A property-management company in the area should have these aggregated.
- How much new for-sale + rental construction is in the pipeline within 1–3 miles? Heavy new supply typically softens prices + rents 12–24 months out; constrained supply supports both.
Investment metrics
- 1% rule
- 1.14% ✓
- Cap rate
- 9.00%
- Cash-on-cash
- 9.66%
- DSCR
- 1.43
- GRM
- 7.3
CMA / ARV
- ARV (on-the-fly)
- $81,536
- Comps found
- 1
Show comp detail 1 sale within ~0.75 mi
| Address | Dist | Beds/Ba | Sqft | Sold | Price | $/sf | Match |
|---|---|---|---|---|---|---|---|
| 1072 NE 29th Ter | 0.43mi | 2/1.0 | 672 (-14%) | 9mo | $70,000 | $104 | 49 |
Match score weights: distance 35% · size 25% · config 20% · recency 20%. Top-matched comps best support the ARV.
Projected returns pro-forma
-3.0% appreciation · 3.0% rent growth · sell at horizon
- IRR
- -1.7%
- Equity multiple
- 0.93×
- Total profit
- $-2,119
- Equity at exit
- $17,147
- IRR
- 8.0%
- Equity multiple
- 1.60×
- Total profit
- $19,448
- Equity at exit
- $9,943
Cash invested: $32,200 (down + closing). Projections, not guarantees.
Landlord ↔ Tenant lean methodology
- Overall (STATE)
- 87 Strongly Landlord-Friendly
- State Florida
- 87 Strongly Landlord-Friendly · R+3
- County
- — inherits STATE
- City
- — inherits STATE
ZIP-level market 34974
- Home prices YoY
- -15.6%
- Active inventory
- 405
- Price-to-rent
- 7.3×
Monthly cashflow live
- Estimated rent
- $1,312 medium interval (Pro) →
- Mortgage (P&I)
- −$603
- Tax from tax record
- −$126 /mo · $1,517/yr
- Insurance
- −$48
- HOA
- −$0
- Vacancy / Maint / Mgmt
- −$276
- Net cashflow
- $259
Break-even live
Sensitivity live
| Price | -10% $324 | -5% $292 | +0% $259 | +5% $227 | +10% $194 |
|---|---|---|---|---|---|
| Rent | -10% $156 | -5% $207 | +0% $259 | +5% $311 | +10% $363 |
| Rate | -1.0pp $317 | -0.5pp $288 | base $259 | +0.5pp $229 | +1.0pp $199 |
UW: 25.0% down · 7.5% · 30yr · 1.5% tax · 5.0% vac · 8.0% maint · 8.0% mgmt
Financing live
Cash to close
- Down payment
- $28,750
- Closing costs
- $3,450
- Reserves months
- —
- Total cash needed
- —
Loan-product check · same deal, 3 products live
Conventional
25% down · 7.5% · 30yr
- Down + closing
- —
- Monthly P&I
- —
- Monthly cashflow
- —
- DSCR
- —
- Eligible?
- —
Personal DTI + credit; lowest rate.
DSCR
20% down · 8.5% · 30yr
- Down + closing
- —
- Monthly P&I
- —
- Monthly cashflow
- —
- DSCR
- —
- Eligible?
- —
No personal income docs; deal must DSCR.
Hard money
10% down · 12.0% · 12mo
- Down + closing
- —
- Monthly P&I
- —
- Monthly cashflow
- —
- DSCR
- —
- Eligible?
- —
Short-term bridge; refi at stabilization.
Listing history 20 events
-
2026-06-22days on market $115,000 Active 58 DOM
-
2026-06-19days on market $115,000 Active 56 DOM
-
2026-06-18days on market $115,000 Active 55 DOM
-
2026-06-17days on market $115,000 Active 54 DOM
-
2026-06-16days on market $115,000 Active 53 DOM
-
2026-06-15days on market $115,000 Active 52 DOM
-
2026-06-14days on market $115,000 Active 50 DOM
-
2026-06-10days on market $115,000 Active 47 DOM
-
2026-06-09days on market $115,000 Active 46 DOM
-
2026-06-08days on market $115,000 Active 45 DOM
-
2026-06-07days on market $115,000 Active 44 DOM
-
2026-06-05days on market $115,000 Active 41 DOM
-
2026-06-03days on market $115,000 Active 40 DOM
-
2026-06-02days on market $115,000 Active 39 DOM
-
2026-06-01days on market $115,000 Active 38 DOM
-
2026-05-31days on market $115,000 Active 37 DOM
-
2026-05-30days on market $115,000 Active 36 DOM
-
2026-04-24$115,000 Active
-
2006-09-19soldstatus $55,000
-
2004-03-30soldstatus $38,000
ⓘ Source: listings_history table (triggers on properties + properties_extension) + one-shot
backfill from property_details.listing_events for pre-trigger history.
Tax reassessment forecast FL · Resets to sale price
- Current annual tax
- $1,517 · $126/mo
- Projected year-2 tax
- $1,517 · $126/mo
- Expected delta
- $0/yr ($0/mo · 0.0%)
ⓘ Screening estimate from a state-policy table — verify with the county assessor before closing.
Climate risk First Street
- Flood 1/10 Low FEMA zone X (unshaded) · 0% chance over 30 yrs
- Wildfire 5/10 Major
- Heat 9/10 Extreme 7 d/yr ≥108°F today · 24 d/yr by 30 yrs out
- Wind 10/10 Extreme 99% chance of damaging wind over 30 yrs
- Air quality 2/10 Low 1 unhealthy d/yr today · 2 by 30 yrs out
Nearby sold comps map
Loading sold comps map…
Walkable amenities ~0.75 mi
Loading nearby amenities…
Taxation est. · year 1
- Rental income
- $15,746
- − Mortgage interest
- −$6,442
- − Property taxes
- −$1,517
- − Insurance
- −$575
- − Repairs & maintenance
- −$1,260
- − Management
- −$1,260
- − Depreciation
- −$3,345
- Taxable income
- $1,347
- Est. tax owed @ 24.0%
- −$323
- After-tax cash flow
- $2,787/yr
For passive investors: Depreciation is non-cash, so a rental often shows a tax loss while cash-flowing — sheltering income. Rental losses are passive: they offset passive income freely, and up to $25,000/yr can offset ordinary (W-2) income if you actively participate and your MAGI is under $100k (phasing out to $0 by $150k); unused losses carry forward. On sale, claimed depreciation is recaptured at up to 25%, and gains may owe capital-gains tax (a 1031 exchange can defer both). Figures are a year-1 estimate at your 24.0% rate — not tax advice; consult a CPA.
Schools (NCES district)
- District
- Okeechobee
- NCES district ID
- 1201410
- Math proficiency
- 44% ▼ -12.00%
- Reading proficiency
- 42% ▼ -4.00%
- Median HH income
- $36,710
- Composite
- 35.73/100
- National rank
- #4855
- State rank
- #58 of 73 in FL
Livability — Cypress Quarters
- Score
- 62/100
- State rank
- #760
- US rank
- #16791
Category grades
Schools grade is shown separately in the Schools card above.
Census & demographics
- County
- Okeechobee County · 23,975 people
- Metro
- Okeechobee, FL
- Population (ZIP)
- 23,975
- Household income
- $53,013
- Rent vs Own
- Severe rent burden
- 399.0
Population outlook (Okeechobee County) Hauer SSP2
- Today (2025)
- 37,273 people
- By 2030
- 35,885 · -3.7%
- By 2040
- 32,931 · -11.6%
- By 2050
- 29,433 · -21.0%
- By 2075
- 19,607 · -47.4%
- By 2100
- 11,814 · -68.3%
Race, ethnicity, and origin ACS 2023
- Neighborhood character
- Predominantly White (74%)
- Race & ethnicity
- White 74% Hispanic / Latino 19% Two or more races 8% Asian 2% Black 2% Native American 1%
- Hispanic origin (detail)
- Mexican 12% Puerto Rican 1% Cuban 2%
- Common ancestry
- Lithuanian 2% Iranian 2% Italian 2%
- Foreign-born
- 11% · Canada, Jamaica
- Languages at home
- 81% English-only · Spanish 16% French/Haitian/Cajun 1% Other Indo-European 1%
Political lean MEDSL · Okeechobee
- 2024 margin
- Solid R (+53.8) · D 22.9% · R 76.7%
- 2008→2024 swing
- -34.6pp toward R · 2008: -19.2pp · 2024: -53.8pp
- All cycles
- 2024: R+53.8 2020: R+44.4 2016: R+39.5 2012: R+20.0 2008: R+19.2
Not yet ingested
- Civics
- —
Market trends
- HPI YoY
- ▼ -64.47%
- Current HPI
- 348.6692
- Rent YoY
- —
- Metro
- Okeechobee, FL
- State GDP YoY
- ▲ 3.28%
- F500 in state
- 36
Industry mix (Fortune 500 HQ in FL)
| Industry | F500 HQs | Revenue |
|---|---|---|
| Industrial Technology | 2 | $29B |
|
||
| Insurance | 2 | $17B |
|
||
| Retail | 1 | $60B |
|
||
| Technology Distribution | 1 | $58B |
|
||
| Homebuilding | 1 | $35B |
|
||
| Technology Manufacturing | 1 | $35B |
|
||
Price history
+202.6% since first listed3 events — show timeline
- 2026-04-24 Listed $115,000 Beaches MLS
- 2006-09-19 Sold (Public Records) $55,000 Public Records
- 2004-03-30 Sold (Public Records) $38,000 Public Records
Property tax history
+6.9%/yrLatest (2025): $1,517 · +5.2% YoY. Source: county tax records.
Cash-flow waterfall
monthlySold comps — $/sqft
last 12 mo · ≤1 miLoading sold comps…