 Multi-family
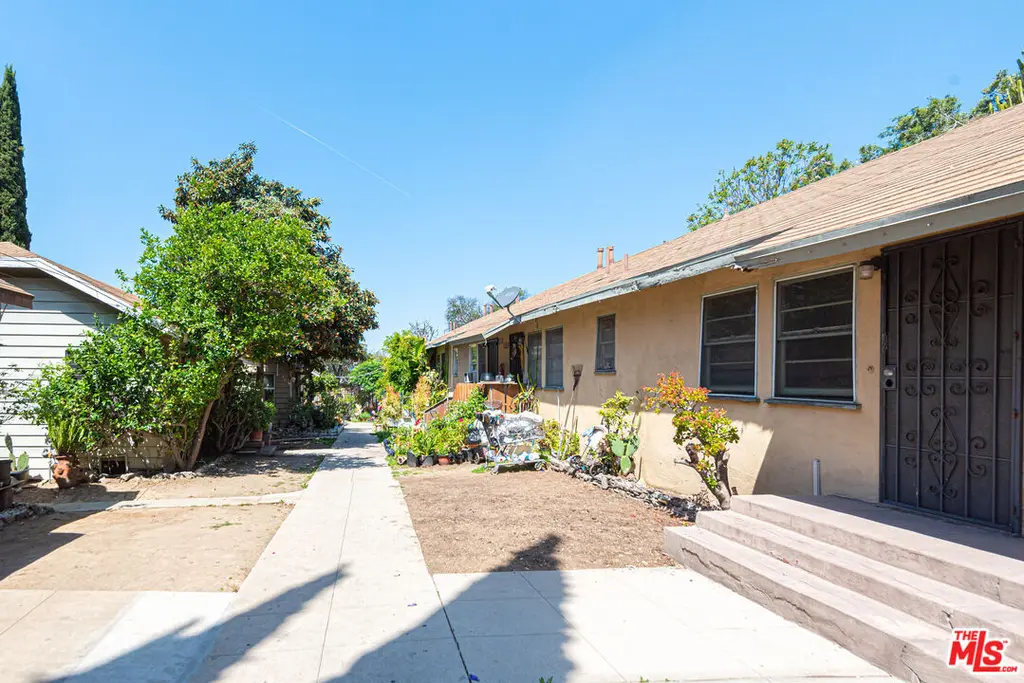
1305 Laveta Ter · Los Angeles, CA
Flood risk 1/10 · Minimal
- FEMA flood zone
- X (unshaded)
- Chance of flooding over 30 yrs
- 0.0%
- Est. flood insurance / yr
- $507 – $1,088
Fire risk 1/10 · Minimal
- Est. fire insurance / yr
- $659 – $1,223
Heat risk 6/10 · Moderate
- Hot days now (above 94°F)
- 7 days/yr
- Hot days in 30 yrs
- 21 days/yr
Wind risk 1/10 · Minimal
- Chance of severe wind over 30 yrs
- —
Air-quality risk 5/10 · Moderate
- Unhealthy air days now
- 8 days/yr
- Unhealthy air days in 30 yrs
- 8 days/yr
Risk factors via First Street. Map © Google.
Why this score? — see what drove the C+ grade
The composite is a weighted blend of 9 inputs, each scored 0–100. Each bar is that input's sub-score; the figure is the points it added to the 100-point composite (weight × sub-score).
- Cash flow +30.0/30.0
- 1% rule +10.0/10.0
- DSCR +10.0/10.0
- Schools +3.6/10.0
- Livability +3.4/5.0
- Rent growth +2.5/5.0
- Condition / age +2.5/5.0
- ARV discount +0.0/15.0
- Appreciation +0.0/10.0
$2,590,000
🖨 Deal sheet (PDF) 📄 Offer letter ✓ Due diligence
Multi-family units
County records classify this as Multi-Family (5+ Unit). Listing-text estimate: 1 unit. estimate disagrees with records
5+ unit building — per-unit beds/baths from public records are typically unavailable; the breakdown below (if shown) is an estimate from the listing text.
Listing remarks MLS
We are proud to present 1303-1305 Laveta Terrace, a two-parcel, 10-unit investment offering in the Echo Park neighborhood of Los Angeles comprising a nine-unit apartment complex and a detached two-story single-family residence with a private pool, each on its own legally separate lot. The apartment complex at 1305 Laveta Terrace traces its origins to six individual wood-frame bungalows constructed in 1921, each built under its own city permit as a standalone one-story dwelling. Over the following decades these six structures were consolidated into a nine unit apartment configuration across four buildings, housing six studios and three one-bedroom/one-bathroom units with 4,279 square feet of rentable area on a 26,106-square-foot lot. The detached residence at 1303 Laveta Terrace was built in 1968 as a two-story, Type V single-family home with 1,385 square feet, three bedrooms, three bathrooms, central heat and air conditioning, and a private pool on its own 11,059-squarefoot lot (APN 5419-028-030). The combined site totals approximately 37,165 square feet (0.85 acres) with 5,660 square feet of net rentable area across all units. All apartment units are individually metered for gas and electricity, and each has in-unit washer and dryer connections. The offering presents two distinct value-add opportunities within a single transaction. The apartment building delivers approximately 77% rent upside across seven occupied units with vacancy decontrol supporting rent-to-market resets upon turnover, while two vacant apartment units and the detached house represent immediate lease-up income. The house at 1303, with an estimated market rent of approximately $5,800 per month supported by recent single-family sales on the same block exceeding $2.2 million and $3.4 million, offers a new owner the flexibility to lease at market, operate as a short-term rental, or hold as an owner-occupied residence while managing the adjacent apartment building. Together, the properties deliver a combined pro forma gross of approximately $24,685 per month. The two parcels are legally separate and independently transferable for the first time since 1968, giving a buyer structural flexibility to hold, dispose, or develop each lot on its own terms. This is a lender-owned REO disposition with clear title, offering a streamlined acquisition with no seller emotion, no 1031 exchange timeline, and no partnership approval process. The combination of significant rent upside on the apartment side, a vacant and move-in-ready house with pool on a separate legal parcel, meaningful development density beyond the existing 10 units, and documented structural investment at the house positions this property to attract a broad range of value-add investors, developers, and long-term holders in one of LA's most sought-after eastside neighborhoods.
Key facts
- Legally separate lot
- Private pool
- 0.85 acre lot
Tags
Neighborhood map
What this means for you Summary
Snapshot
- This is a 1-bed/1.0-bath multifamily listed at $2.59M.
Deal economics
- At list price, monthly cash flow is $22k ($263k/yr) — positive.
- The deal already cash-flows at list — no discount required.
- Meets the 1% rule at list price ($49k rent vs $2.59M).
- Recommended offer: $2.43M (6.0% below list) — sets the bar for market timing.
- Cap rate 16.5% vs local median 2.1% in Los Angeles — top-decile yield for the area; either an underpriced asset or a hidden risk that comps aren't pricing in. Stress-test before assuming the spread holds.
Location & tenants
- Location reads 68/100 on livability (#273 in CA) — a middle-class / working-renter tenant base. Strengths: amenities A+, commute A+, employment B; Watch: health & safety C-, schools D+, crime F.
- Los Angeles Unified (urban): math 29% / reading 54% proficiency, ranked #223 of 517 in CA (top 43%) — families likely to look elsewhere, expect single-tenant / working-renter base with shorter leases; 67% free/reduced lunch — lower-income household profile, screen leases tightly.
- Market conditions: Rents soft (-0.0%/yr); 179 active listings in the ZIP; 40 comparable units currently listed for rent nearby; rentals at typical pace (median 15d on market — plan ~3-4 weeks tenant-placement turnaround); solid renter incomes; 19,697 units permitted in Los Angeles County in 2024 (9,426 in 5+ unit buildings).
- At $48,837/mo this rent would consume 671% of the median local household income ($87k/yr) (locally 4974% of renters already pay >50% of income on rent) — very limited rent-growth headroom before tenants either downsize or default.
Forward outlook
- Local home prices are declining (-3.0%/yr); year-one equity from $18k of loan paydown is wiped out by about $78k of value loss. Plan a longer hold.
- Los Angeles County population projected at +9% by 2050 — modest demand growth; plan on rents tracking national, not racing it.
- At projected returns (-3.0% appreciation + 0.0% rent growth), your $725k cash investment doubles in ~4 years — after that, you're playing with house money.
Negotiation context
- It's been on market 62 days — a 6% lower offer ($2.43M) is reasonable based on typical stale-listing flexibility.
- 2 sale attempts since 23y ago with the ask held roughly flat each time — persistent listings suggest the price (not the market) is what's stuck; bring a comps-based counter.
Risks & watch-outs
- Watch-outs: built in 1921 — expect roof / HVAC / electrical / plumbing capex.
- Climate carrying-cost: extreme-heat days projected 7→21/yr by 2055 (HVAC capex compounding) — expect insurance premiums to compound above CPI over the hold.
Questions for the listing agent
- It's been on market 62 days. Have you received any prior offers? Is the seller open to a 6% concession, seller financing, or rate buy-down credit?
- Built in 1921 — when were the roof, HVAC, electrical panel, plumbing, and water heater last replaced?
- Why hasn't it sold? Are there any deal-killer items the seller is aware of (foundation, flood, title, zoning, code violations)?
- Is there a deadline driving the sale (1031 exchange, divorce, estate, relocation)? That informs how much negotiation room exists.
- Schools are D-rated, which usually means shorter tenancies and higher turnover. Who's the typical renter profile here, and what's been the actual vacancy rate?
- Crime grade is F in this area — have there been break-ins, vandalism, or insurance claims at this property in the last 3 years? What carrier currently insures it and at what premium?
- What's the average days-on-market for RENTAL listings here right now (not sales)? A rising rental-DOM trend means longer vacancies and softer asking-rent achievability than the comps imply.
- What's the recent tenant-quality profile in this submarket — average credit score on applications, eviction rate, late-payment / NSF rate, and stable-employment percentage? A property-management company in the area should have these aggregated.
- How much new apartment / multifamily construction is in the pipeline within 1–3 miles? Heavy new supply (>2% of stock underway) typically softens rents 12–24 months out; light construction supports rent growth.
Investment metrics
- 1% rule
- 1.89% ✓
- Cap rate
- 16.46%
- Cash-on-cash
- 36.31%
- DSCR
- 2.62
- GRM
- 4.4
CMA / ARV
- ARV (median comp)
- $1,752,447
- List price
- $2,590,000
- Delta
- 47.79%
- Verdict
- OVERPRICED
- Comps
- 20 within 1.0 mi
Projected returns pro-forma
-3.0% appreciation · 0.0% rent growth · sell at horizon
- IRR
- 28.7%
- Equity multiple
- 2.15×
- Total profit
- $834,852
- Equity at exit
- $386,177
- IRR
- 34.4%
- Equity multiple
- 3.72×
- Total profit
- $1,973,471
- Equity at exit
- $223,936
Cash invested: $725,200 (down + closing). Projections, not guarantees.
Landlord ↔ Tenant lean methodology
- Overall (CITY)
- 0 Strongly Tenant-Friendly
- State California
- 18 Strongly Tenant-Friendly · D+13
- County
- — inherits STATE
- City Los Angeles
- 0 Strongly Tenant-Friendly · D+22
ZIP-level market 90026
- Rents YoY
- -0.0%
- Active inventory
- 179
- Price-to-rent
- 44.2×
Monthly cashflow live
- Estimated rent
- $48,837 high interval (Pro) →
- Mortgage (P&I)
- −$13,582
- Tax from tax record
- −$1,975 /mo · $23,695/yr
- Insurance
- −$1,079
- HOA
- −$0
- Vacancy / Maint / Mgmt
- −$10,256
- Net cashflow
- $21,945
Break-even live
Sensitivity live
| Price | -10% $23,411 | -5% $22,678 | +0% $21,945 | +5% $21,212 | +10% $20,479 |
|---|---|---|---|---|---|
| Rent | -10% $18,087 | -5% $20,016 | +0% $21,945 | +5% $23,874 | +10% $25,803 |
| Rate | -1.0pp $23,250 | -0.5pp $22,604 | base $21,945 | +0.5pp $21,274 | +1.0pp $20,591 |
10-unit breakdown (identical units grouped — click to expand)
| Units | Beds | Baths | Est. rent |
|---|---|---|---|
| 10× units | 6 | 12 | $48,840 |
| #1 | 6 | 12 | $4,884 |
| #2 | 6 | 12 | $4,884 |
| #3 | 6 | 12 | $4,884 |
| #4 | 6 | 12 | $4,884 |
| #5 | 6 | 12 | $4,884 |
| #6 | 6 | 12 | $4,884 |
| #7 | 6 | 12 | $4,884 |
| #8 | 6 | 12 | $4,884 |
| #9 | 6 | 12 | $4,884 |
| #10 | 6 | 12 | $4,884 |
| Total (10 units) | $48,837 | ||
UW: 25.0% down · 7.5% · 30yr · 1.5% tax · 5.0% vac · 8.0% maint · 8.0% mgmt
Financing live
Cash to close
- Down payment
- $647,500
- Closing costs
- $77,700
- Reserves months
- —
- Total cash needed
- —
Loan-product check · same deal, 3 products live
Conventional
25% down · 7.5% · 30yr
- Down + closing
- —
- Monthly P&I
- —
- Monthly cashflow
- —
- DSCR
- —
- Eligible?
- —
Personal DTI + credit; lowest rate.
DSCR
20% down · 8.5% · 30yr
- Down + closing
- —
- Monthly P&I
- —
- Monthly cashflow
- —
- DSCR
- —
- Eligible?
- —
No personal income docs; deal must DSCR.
Hard money
10% down · 12.0% · 12mo
- Down + closing
- —
- Monthly P&I
- —
- Monthly cashflow
- —
- DSCR
- —
- Eligible?
- —
Short-term bridge; refi at stabilization.
Rent comps 40 comps
| Address | Beds | Baths | Sqft | Rent | $/sqft | DOM | Units | Dist |
|---|---|---|---|---|---|---|---|---|
| 1416 Fairbanks Pl Los Angeles, CA | 2.0 | 1.0 | 960 | $5,400 | $5.62 | 14d | 1 | 0.06mi |
| 1416 1/2 Echo Park Ave Los Angeles, CA | 1.0 | 1.0 | 700 | $2,395 | $3.42 | 44d | 1 | 0.09mi |
| 1445 Echo Park Ave Unit 1447 Los Angeles, CA | 1.0 | 1.0 | 650 | $2,400 | $3.69 | 5d | 1 | 0.15mi |
| 1461 Sunset Blvd Unit 201 Los Angeles, CA | 1.0 | 1.0 | 600 | $2,195 | $3.66 | 8d | 1 | 0.17mi |
| 1325 Sutherland St Unit 08 Los Angeles, CA | 2.0 | 1.0 | 800 | $3,200 | $4.00 | 11d | 1 | 0.17mi |
| 1040 Laguna Ave Unit 1/2 Los Angeles, CA | 1.0 | 1.0 | 550 | $2,000 | $3.64 | 18d | 1 | 0.18mi |
| 1111 Laveta Ter Los Angeles, CA | 1.0 | 1.0 | 612 | $2,700 | $4.41 | 25d | 1 | 0.19mi |
| 1101 Laveta Ter #4 Los Angeles, CA | 2.0 | 1.5 | 1014 | $3,999 | $3.94 | 12d | 1 | 0.21mi |
| 1428 Sunset Blvd Los Angeles, CA | 1.0 | 1.0 | 950 | $2,695 | $2.84 | 44d | 1 | 0.24mi |
| 1313 Douglas St Unit 1315 Los Angeles, CA | 2.0 | 1.0 | 1000 | $3,295 | $3.29 | 22d | 1 | 0.29mi |
| 1313 Douglas St Unit 1315 Los Angeles, CA | 2.0 | 1.0 | 1000 | $3,295 | $3.29 | 44d | 1 | 0.29mi |
| 1551 Echo Park Ave Los Angeles, CA | 1.0 | 1.0 | 580 | $2,656 | $4.58 | 15d | 3 | 0.30mi |
| 1915 Park Ave Los Angeles, CA | 2.0 | 1.0–2.0 | 743 | $3,888 | $5.23 | 5d | 9 | 0.31mi |
| 1330 Liberty St Unit 5 Los Angeles, CA | 2.0 | 1.0 | 900 | $2,291 | $2.55 | 5d | 1 | 0.32mi |
| 1330 Liberty St Apt 2 Los Angeles, CA | 1.0 | 1.0 | 700 | $1,791 | $2.56 | 20d | 1 | 0.32mi |
| 1330 Liberty St Unit 4 Los Angeles, CA | 1.0 | 1.0 | 700 | $1,995 | $2.85 | 5d | 1 | 0.32mi |
| 1536 Lemoyne St Los Angeles, CA | 1.0 | 1.0 | 850 | $2,750 | $3.24 | 18d | 1 | 0.34mi |
| 1626 Echo Park Ave Los Angeles, CA | 2.0 | 1.0 | 950 | $3,250 | $3.42 | 44d | 1 | 0.37mi |
| 1361 Sunset Blvd Unit SUN05 Los Angeles, CA | — | 1.0 | 600 | $1,400 | $2.33 | 8d | 1 | 0.38mi |
| 1361 Sunset Blvd Unit SUN01 Los Angeles, CA | — | 1.0 | 600 | $1,475 | $2.46 | 5d | 1 | 0.38mi |
| 2022 W Sunset Blvd Los Angeles, CA | 1.0 | 1.0 | 700 | $2,400 | $3.43 | 17d | 1 | 0.38mi |
| 1077 W Kensington Rd #3 Los Angeles, CA | 2.0 | 2.0 | 1056 | $4,000 | $3.79 | 14d | 1 | 0.39mi |
| 1077 W Kensington Rd #3 Los Angeles, CA | 2.0 | 1.5 | 1056 | $4,000 | $3.79 | 22d | 1 | 0.39mi |
| 1900 Berkeley Ave Los Angeles, CA | 1.0 | 1.0 | 800 | $4,100 | $5.12 | 25d | 1 | 0.39mi |
| 1917 Montrose St Los Angeles, CA | 1.0 | 1.0 | 650 | $2,595 | $3.99 | 11d | 1 | 0.42mi |
| 1917 Montrose St Unit 15 Los Angeles, CA | 1.0 | 1.0 | 650 | $2,595 | $3.99 | 8d | 1 | 0.42mi |
| 1030 N Alvarado St Los Angeles, CA | 1.0 | 1.0–1.5 | 1268 | $4,500 | $3.55 | 4d | 1 | 0.43mi |
| 1421 N Alvarado St Los Angeles, CA | 2.0 | 1.5 | 1036 | $4,795 | $4.63 | 8d | 1 | 0.43mi |
| 1267 Vin Scully Ave Unit 5 Los Angeles, CA | — | 1.0 | 600 | $1,750 | $2.92 | 3d | 1 | 0.45mi |
| 1267 Vin Scully Ave Los Angeles, CA | — | 1.0 | 575 | $1,650 | $2.87 | 44d | 1 | 0.45mi |
| 1443 N Alvarado St Los Angeles, CA | — | 1.0 | 550 | $1,795 | $3.26 | 14d | 1 | 0.45mi |
| 1443 N Alvarado St Los Angeles, CA | — | 1.0 | 550 | $1,775 | $3.23 | 44d | 1 | 0.45mi |
| 1701 Clinton St #209 Los Angeles, CA | 2.0 | 1.0 | 950 | $3,000 | $3.16 | 44d | 1 | 0.47mi |
| 1317 Allesandro St Unit 11 Los Angeles, CA | 1.0 | 1.0 | 650 | $2,287 | $3.52 | 14d | 1 | 0.49mi |
| 1801 Morton Ave Los Angeles, CA | 1.0–2.0 | 1.0 | 692 | $2,650 | $3.83 | 2d | 4 | 0.52mi |
| 607 Belmont Ave Los Angeles, CA | 2.0 | 1.0 | 700 | $2,175 | $3.11 | 19d | 1 | 0.53mi |
| 1008 Rosemont Ave Los Angeles, CA | 1.0–2.0 | 1.0 | 900 | $1,803 | $2.00 | 21d | 3 | 0.58mi |
| 1804 Bellevue Ave Los Angeles, CA | 2.0 | 1.0 | 600 | $3,011 | $5.02 | 11d | 1 | 0.58mi |
| 706 N Alvarado St Los Angeles, CA | 1.0 | 1.0 | 606 | $2,295 | $3.79 | 5d | 1 | 0.59mi |
| 2228 Berkeley Ave Unit 2 Los Angeles, CA | 2.0 | 1.5 | 900 | $3,500 | $3.89 | 45d | 1 | 0.60mi |
Listing history 25 events
-
2026-06-18days on market $2,590,000 Active 62 DOM
-
2026-06-17days on market $2,590,000 Active 61 DOM
-
2026-06-16days on market $2,590,000 Active 60 DOM
-
2026-06-15days on market $2,590,000 Active 59 DOM
-
2026-06-13days on market $2,590,000 Active 57 DOM
-
2026-06-09days on market $2,590,000 Active 53 DOM
-
2026-06-08days on market $2,590,000 Active 52 DOM
-
2026-06-07days on market $2,590,000 Active 51 DOM
-
2026-06-04days on market $2,590,000 Active 48 DOM
-
2026-06-03days on market $2,590,000 Active 47 DOM
-
2026-06-02days on market $2,590,000 Active 46 DOM
-
2026-06-01days on market $2,590,000 Active 45 DOM
-
2026-05-31days on market $2,590,000 Active 44 DOM
-
2026-04-06$2,590,000 Active 2845-char remark
Show marketing remark (2845 chars)
We are proud to present 1303-1305 Laveta Terrace, a two-parcel, 10-unit investment offering in the Echo Park neighborhood of Los Angeles comprising a nine-unit apartment complex and a detached two-story single-family residence with a private pool, each on its own legally separate lot. The apartment complex at 1305 Laveta Terrace traces its origins to six individual wood-frame bungalows constructed in 1921, each built under its own city permit as a standalone one-story dwelling. Over the following decades these six structures were consolidated into a nine unit apartment configuration across four buildings, housing six studios and three one-bedroom/one-bathroom units with 4,279 square feet of rentable area on a 26,106-square-foot lot. The detached residence at 1303 Laveta Terrace was built in 1968 as a two-story, Type V single-family home with 1,385 square feet, three bedrooms, three bathrooms, central heat and air conditioning, and a private pool on its own 11,059-squarefoot lot (APN 5419-028-030). The combined site totals approximately 37,165 square feet (0.85 acres) with 5,660 square feet of net rentable area across all units. All apartment units are individually metered for gas and electricity, and each has in-unit washer and dryer connections. The offering presents two distinct value-add opportunities within a single transaction. The apartment building delivers approximately 77% rent upside across seven occupied units with vacancy decontrol supporting rent-to-market resets upon turnover, while two vacant apartment units and the detached house represent immediate lease-up income. The house at 1303, with an estimated market rent of approximately $5,800 per month supported by recent single-family sales on the same block exceeding $2.2 million and $3.4 million, offers a new owner the flexibility to lease at market, operate as a short-term rental, or hold as an owner-occupied residence while managing the adjacent apartment building. Together, the properties deliver a combined pro forma gross of approximately $24,685 per month. The two parcels are legally separate and independently transferable for the first time since 1968, giving a buyer structural flexibility to hold, dispose, or develop each lot on its own terms. This is a lender-owned REO disposition with clear title, offering a streamlined acquisition with no seller emotion, no 1031 exchange timeline, and no partnership approval process. The combination of significant rent upside on the apartment side, a vacant and move-in-ready house with pool on a separate legal parcel, meaningful development density beyond the existing 10 units, and documented structural investment at the house positions this property to attract a broad range of value-add investors, developers, and long-term holders in one of LA's most sought-after eastside neighborhoods.
-
2026-03-09soldstatus $3,000,000
-
2014-12-03soldstatus $2,000,000
-
2003-08-11soldstatus $1,000,500 400-char remark
Show marketing remark (400 chars)
SPECTACULAR REAL ESTATE COMPOUND ON A HILL IN HISTORIC SUNSET HEIGHTS. 2 BDRM. 2 BTH, HOUSE, GUEST QUARTERS, KOI POND, POOL, WOOD DECK, VEG. GARD, WITH ENDLESS CITY VIEWS. AT BOTTOM OF HILL 9 BUNGALOW APTS. THAT PROVIDE $53K OF INCOME A YR TO HELP WITH MORTGAGE. OWNER SPENT 200+ K IN UPGRADES AND IS 80% RENOVATED. SEARCH RECORDS FOR LEGALITY OF STRUCTURES. CALL AGENT FOR BROCHURE & SHOWINGS.
-
2003-08-11soldstatus $1,000,500
Show marketing remark (400 chars)
SPECTACULAR REAL ESTATE COMPOUND ON A HILL IN HISTORIC SUNSET HEIGHTS. 2 BDRM. 2 BTH, HOUSE, GUEST QUARTERS, KOI POND, POOL, WOOD DECK, VEG. GARD, WITH ENDLESS CITY VIEWS. AT BOTTOM OF HILL 9 BUNGALOW APTS. THAT PROVIDE $53K OF INCOME A YR TO HELP WITH MORTGAGE. OWNER SPENT 200+ K IN UPGRADES AND IS 80% RENOVATED. SEARCH RECORDS FOR LEGALITY OF STRUCTURES. CALL AGENT FOR BROCHURE & SHOWINGS.
-
2003-05-19historical 400-char remark
Show marketing remark (400 chars)
SPECTACULAR REAL ESTATE COMPOUND ON A HILL IN HISTORIC SUNSET HEIGHTS. 2 BDRM. 2 BTH, HOUSE, GUEST QUARTERS, KOI POND, POOL, WOOD DECK, VEG. GARD, WITH ENDLESS CITY VIEWS. AT BOTTOM OF HILL 9 BUNGALOW APTS. THAT PROVIDE $53K OF INCOME A YR TO HELP WITH MORTGAGE. OWNER SPENT 200+ K IN UPGRADES AND IS 80% RENOVATED. SEARCH RECORDS FOR LEGALITY OF STRUCTURES. CALL AGENT FOR BROCHURE & SHOWINGS.
-
2003-05-02$969,969 400-char remark
Show marketing remark (400 chars)
SPECTACULAR REAL ESTATE COMPOUND ON A HILL IN HISTORIC SUNSET HEIGHTS. 2 BDRM. 2 BTH, HOUSE, GUEST QUARTERS, KOI POND, POOL, WOOD DECK, VEG. GARD, WITH ENDLESS CITY VIEWS. AT BOTTOM OF HILL 9 BUNGALOW APTS. THAT PROVIDE $53K OF INCOME A YR TO HELP WITH MORTGAGE. OWNER SPENT 200+ K IN UPGRADES AND IS 80% RENOVATED. SEARCH RECORDS FOR LEGALITY OF STRUCTURES. CALL AGENT FOR BROCHURE & SHOWINGS.
-
2000-06-30soldstatus $450,000
-
1997-02-27soldstatus $404,166
-
1990-05-17soldstatus $385,000
-
1989-05-30soldstatus $385,000
-
1975-10-22soldstatus $26,000
ⓘ Source: listings_history table (triggers on properties + properties_extension) + one-shot
backfill from property_details.listing_events for pre-trigger history.
Tax reassessment forecast CA · Resets to sale price
- Current annual tax
- $23,695 · $1,975/mo
- Projected year-2 tax
- $23,695 · $1,975/mo
- Expected delta
- $0/yr ($0/mo · 0.0%)
ⓘ Screening estimate from a state-policy table — verify with the county assessor before closing.
Climate risk First Street
- Flood 1/10 Low FEMA zone X (unshaded) · 0% chance over 30 yrs
- Wildfire 1/10 Low
- Heat 6/10 Major 7 d/yr ≥94°F today · 21 d/yr by 30 yrs out
- Wind 1/10 Low
- Air quality 5/10 Major 8 unhealthy d/yr today · 8 by 30 yrs out
Nearby sold comps map
Loading sold comps map…
Walkable amenities ~0.75 mi
Loading nearby amenities…
Taxation est. · year 1
- Rental income
- $586,044
- − Mortgage interest
- −$145,080
- − Property taxes
- −$23,695
- − Insurance
- −$12,950
- − Repairs & maintenance
- −$46,884
- − Management
- −$46,884
- − Depreciation
- −$75,345
- Taxable income
- $235,206
- Est. tax owed @ 24.0%
- −$56,450
- After-tax cash flow
- $206,893/yr
For passive investors: Depreciation is non-cash, so a rental often shows a tax loss while cash-flowing — sheltering income. Rental losses are passive: they offset passive income freely, and up to $25,000/yr can offset ordinary (W-2) income if you actively participate and your MAGI is under $100k (phasing out to $0 by $150k); unused losses carry forward. On sale, claimed depreciation is recaptured at up to 25%, and gains may owe capital-gains tax (a 1031 exchange can defer both). Figures are a year-1 estimate at your 24.0% rate — not tax advice; consult a CPA.
Schools (NCES district)
- District
- Los Angeles Unified
- NCES district ID
- 0622710
- Math proficiency
- 29% ▼ -4.00%
- Reading proficiency
- 54% ▲ 10.00%
- Median HH income
- $50,403
- Composite
- 35.67/100
- National rank
- #4875
- State rank
- #223 of 517 in CA
Livability — Los Angeles
- Score
- 68/100
- State rank
- #273
- US rank
- #9237
Category grades
Schools grade is shown separately in the Schools card above.
Census & demographics
- Census place
- Los Angeles, CA
- County
- Los Angeles County · 9,444,647 people
- City population
- 3,838,149
- Metro
- Los Angeles-Long Beach-Anaheim, CA
- Population (ZIP)
- 62,692
- Household income
- $87,334
- Rent vs Own
- Severe rent burden
- 4974.0
Population outlook (Los Angeles County) Hauer SSP2
- Today (2025)
- 10,940,515 people
- By 2030
- 11,256,481 · +2.9%
- By 2040
- 11,729,929 · +7.2%
- By 2050
- 11,948,407 · +9.2%
- By 2075
- 11,818,114 · +8.0%
- By 2100
- 10,842,928 · -0.9%
Race, ethnicity, and origin ACS 2023
- Neighborhood character
- Diverse neighborhood (Simpson 0.67)
- Race & ethnicity
- Hispanic / Latino 46% White 31% Asian 13% Two or more races 13% Black 4% Native American 1%
- Hispanic origin (detail)
- Mexican 26%
- Common ancestry
- Lithuanian 2% Italian 2% Romanian 1%
- Foreign-born
- 34% · Canada, China, South Korea
- Languages at home
- 47% English-only · Spanish 39% Tagalog/Filipino 5% Chinese 2%
Political lean MEDSL · Los Angeles
- 2024 margin
- Solid D (+32.9) · D 64.8% · R 31.9% · Other 3.3%
- 2008→2024 swing
- -7.4pp toward R · 2008: 40.4pp · 2024: 32.9pp
- All cycles
- 2024: D+32.9 2020: D+44.2 2016: D+48.0 2012: D+40.0 2008: D+40.4
Not yet ingested
- Civics
- —
Market trends
- HPI YoY
- ▼ -1087.70%
- Current HPI
- 456.3465
- Rent YoY
- ▬ -0.01%
- Metro
- Los Angeles-Long Beach-Anaheim, CA
- State GDP YoY
- ▲ 3.21%
- F500 in state
- 116
Industry mix (Fortune 500 HQ in CA)
| Industry | F500 HQs | Revenue |
|---|---|---|
| Technology | 27 | $1,492B |
|
||
| Financial Services | 3 | $174B |
|
||
| Retail | 3 | $44B |
|
||
| Insurance | 3 | $26B |
|
||
| Media / Entertainment | 2 | $115B |
|
||
| Pharmaceuticals / Biotech | 2 | $62B |
|
||
Price history
+9861.5% since first listed12 events — show timeline
- 2026-04-06 Listed $2,590,000 TheMLS
- 2026-03-09 Sold (Public Records) $3,000,000 Public Records
- 2014-12-03 Sold (Public Records) $2,000,000 Public Records
- 2003-08-11 Sold (Public Records) $1,000,500 Public Records
- 2003-08-11 Sold (MLS) $1,000,500 TheMLS
- 2003-05-19 Delisted — TheMLS
- 2003-05-02 Listed $969,969 TheMLS
- 2000-06-30 Sold (Public Records) $450,000 Public Records
- 1997-02-27 Sold (Public Records) $404,166 Public Records
- 1990-05-17 Sold (Public Records) $385,000 Public Records
- 1989-05-30 Sold (Public Records) $385,000 Public Records
- 1975-10-22 Sold (Public Records) $26,000 Public Records
Property tax history
+5.1%/yrLatest (2025): $23,695 · +1.3% YoY. Source: county tax records.
Cash-flow waterfall
monthlySold comps — $/sqft
last 12 mo · ≤1 miLoading sold comps…