 Multi-family
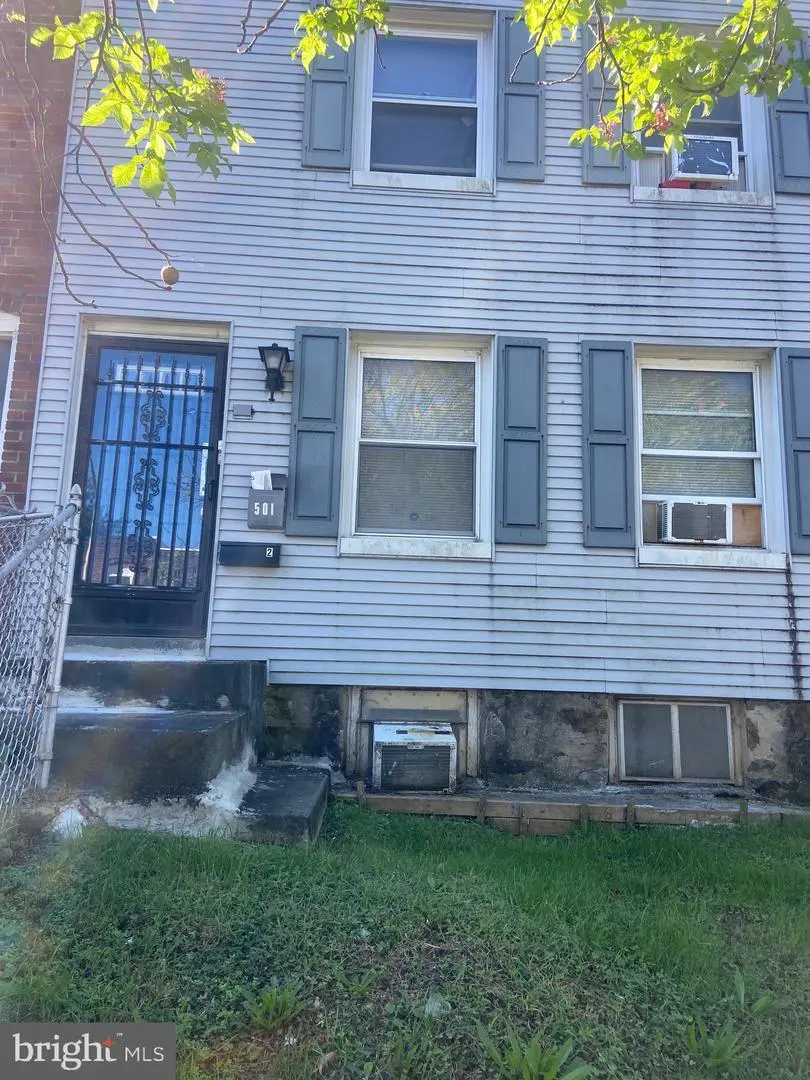
501 Baltic Ave · Baltimore, MD
Flood risk 1/10 · Minimal
- FEMA flood zone
- X (unshaded)
- Chance of flooding over 30 yrs
- 0.0%
- Est. flood insurance / yr
- $473 – $860
Fire risk 1/10 · Minimal
- Est. fire insurance / yr
- $755 – $1,403
Heat risk 8/10 · Major
- Hot days now (above 102°F)
- 7 days/yr
- Hot days in 30 yrs
- 15 days/yr
Wind risk 6/10 · Moderate
- Chance of severe wind over 30 yrs
- 27.0%
Air-quality risk 4/10 · Minor
- Unhealthy air days now
- 5 days/yr
- Unhealthy air days in 30 yrs
- 7 days/yr
Risk factors via First Street. Map © Google.
Why this score? — see what drove the C- grade
The composite is a weighted blend of 9 inputs, each scored 0–100. Each bar is that input's sub-score; the figure is the points it added to the 100-point composite (weight × sub-score).
- Cash flow +20.1/30.0
- ARV discount +7.5/15.0
- DSCR +6.4/10.0
- 1% rule +5.4/10.0
- Livability +3.8/5.0
- Rent growth +3.5/5.0
- Condition / age +2.5/5.0
- Schools +1.0/10.0
- Appreciation +0.0/10.0
$219,999
🖨 Deal sheet 📄 Offer letter ✓ Due diligence
Multi-family units
County records classify this as Multi-Family (2-4 Unit). Listing-text estimate: 1 unit. estimate disagrees with records
Listing remarks MLS
Great opportunity!!! Townhouse on a corner lot. Fully occupied, two units with separate entrances. Unit One - Two bedroom apartment with a one year lease. Unit Two - One bedroom apartment with a long term month-to-month tenant.
Key facts
- End of group
- Major renovation
- Ideal for commuters
Tags
Property features AI
Finance
- Other: Ground rent paid annually
- Financial info: Property assessed values listed (excluded monetary details per instructions); No rent control
Exterior
- Parking: On-street parking
- Utilities: Public water; Public sewer; Electric 120/240V service available; Natural gas available; Cable TV available; Phone service available
- Home design: Semi-detached property; Three total levels; Fee simple ownership; Estimated major remodel in 2025
- Construction: Brick construction; Other-type foundation; Roof condition unknown; Estimated year built
- Exterior features: Above-grade and below-grade structures; Public water and sewer available; Cable and phone available
Interior
- Kitchen: Dishwasher; Disposal; Microwave; Refrigerator
- Bedrooms: One 1-bedroom unit; One 2-bedroom unit; One vacant unit
- Heating & cooling: Forced air heating (natural gas); Window cooling units (electric)
- Interior features: Brick and masonry walls with drywall finishes; Very good overall condition; Building winterized
- Laundry & utility: Washer; Dryer; 60+ gallon hot water tank (natural gas and electric options listed)
Neighborhood map
What this means for you Summary
Snapshot
- This is a 3-bed/2.5-bath multifamily listed at $220k.
Deal economics
- At list price, monthly cash flow is $275 ($3k/yr) — positive.
- The deal already cash-flows at list — no discount required.
- Meets the 1% rule at list price ($2k rent vs $220k).
- Cap rate 7.8% vs local median 6.0% in Baltimore — top-decile yield for the area; either an underpriced asset or a hidden risk that comps aren't pricing in. Stress-test before assuming the spread holds.
Location & tenants
- Location reads 76/100 on livability (#90 in MD, #3,396 nationally) — a middle-class / working-renter tenant base. Strengths: amenities A+, commute A+, housing A+; Watch: schools D, crime F.
- Baltimore City Public Schools (urban): math 7% / reading 16% proficiency, ranked #24 of 24 in MD (top 100%) — low school quality limits family demand, transient renter base, plan for 1-2y turnover; 79% free/reduced lunch — lower-income household profile, screen leases tightly.
- Market conditions: Rents rising fast (+4.1%/yr); 165 active listings in the ZIP; 30 comparable units currently listed for rent nearby; rentals at typical pace (median 24d on market — plan ~3-4 weeks tenant-placement turnaround); 1,273 units permitted in Baltimore city in 2024 (1,104 in 5+ unit buildings).
- At $2,280/mo this rent would consume 51% of the median local household income ($54k/yr) (locally 1440% of renters already pay >50% of income on rent) — very limited rent-growth headroom before tenants either downsize or default.
Forward outlook
- Local home prices are declining (-3.0%/yr); year-one equity from $2k of loan paydown is wiped out by about $7k of value loss. Plan a longer hold.
- Baltimore County population projected to shrink 4% by 2050 — rents likely to lag national; underwrite the cash flow, not the appreciation.
Negotiation context
- Only 10 days on market — expect competitive offers; lowballing is unlikely to land.
- 6 sale attempts since 6y ago with the ask held roughly flat each time — persistent listings suggest the price (not the market) is what's stuck; bring a comps-based counter.
- Current owner paid $165k; 33% above their basis — modest negotiation headroom, anchor on the comps not their cost.
Risks & watch-outs
- Watch-outs: built in 1945 — expect roof / HVAC / electrical / plumbing capex.
- Climate carrying-cost: major wind risk, 27% chance of damaging wind over 30y; extreme-heat days projected 7→15/yr by 2055 (HVAC capex compounding) — expect insurance premiums to compound above CPI over the hold.
Questions for the listing agent
- Built in 1945 — when were the roof, HVAC, electrical panel, plumbing, and water heater last replaced?
- Is there a deadline driving the sale (1031 exchange, divorce, estate, relocation)? That informs how much negotiation room exists.
- Schools are D-rated, which usually means shorter tenancies and higher turnover. Who's the typical renter profile here, and what's been the actual vacancy rate?
- Crime grade is F in this area — have there been break-ins, vandalism, or insurance claims at this property in the last 3 years? What carrier currently insures it and at what premium?
- What's the average days-on-market for RENTAL listings here right now (not sales)? A rising rental-DOM trend means longer vacancies and softer asking-rent achievability than the comps imply.
- What's the recent tenant-quality profile in this submarket — average credit score on applications, eviction rate, late-payment / NSF rate, and stable-employment percentage? A property-management company in the area should have these aggregated.
- How much new apartment / multifamily construction is in the pipeline within 1–3 miles? Heavy new supply (>2% of stock underway) typically softens rents 12–24 months out; light construction supports rent growth.
Investment metrics
- 1% rule
- 1.04% ✓
- Cap rate
- 7.79%
- Cash-on-cash
- 5.36%
- DSCR
- 1.24
- GRM
- 8.0
CMA / ARV
- ARV (on-the-fly)
- $134,576
- Comps found
- 12
Show comp detail 12 sales within ~0.75 mi
| Address | Dist | Beds/Ba | Sqft | Sold | Price | $/sf | Match |
|---|---|---|---|---|---|---|---|
| 500 Baltic Ave | 0.02mi | 2/— (-1) | 1,284 (-1%) | 1mo | $220,000 | $171 | 92 |
| 3423 6th | 0.09mi | 2/— (-1) | 1,294 (0%) | 4mo | $135,000 | $104 | 88 |
| 510 Arsan Ave | 0.03mi | 2/— (-1) | 1,294 (0%) | 11mo | $175,000 | $135 | 84 |
| 613 Baltic Ave | 0.13mi | 2/— (-1) | 1,294 (0%) | 11mo | $105,000 | $81 | 79 |
| 3609 Brooklyn Ave | 0.38mi | 4/— (+1) | 1,400 (+8%) | 2mo | $158,000 | $113 | 61 |
| 4132 Audrey Ave | 0.70mi | 3/— | 1,130 (-13%) | 5mo | $150,000 | $133 | 42 |
| 3800 Potee St | 0.58mi | 4/— (+1) | 1,428 (+10%) | 11mo | $116,900 | $82 | 41 |
| 3804 Potee St | 0.59mi | 4/— (+1) | 1,428 (+10%) | 13mo | $64,900 | $45 | 40 |
| 46 Talbott St | 0.62mi | 4/— (+1) | 1,428 (+10%) | 11mo | $118,000 | $83 | 39 |
| 811 Stoll St | 0.64mi | 2/— (-1) | 1,116 (-14%) | 6mo | $135,000 | $121 | 37 |
| 3804 Leadenhall St | 0.67mi | 4/— (+1) | 1,428 (+10%) | 11mo | $118,000 | $83 | 37 |
| 3806 Leadenhall St | 0.68mi | 4/— (+1) | 1,428 (+10%) | 11mo | $118,000 | $83 | 37 |
Match score weights: distance 35% · size 25% · config 20% · recency 20%. Top-matched comps best support the ARV.
Projected returns pro-forma
-3.0% appreciation · 4.08% rent growth · sell at horizon
- IRR
- -6.8%
- Equity multiple
- 0.75×
- Total profit
- $-15,582
- Equity at exit
- $32,803
- IRR
- 4.2%
- Equity multiple
- 1.32×
- Total profit
- $19,656
- Equity at exit
- $19,021
Cash invested: $61,600 (down + closing). Projections, not guarantees.
Landlord ↔ Tenant lean methodology
- Overall (CITY)
- 12 Strongly Tenant-Friendly
- State Maryland
- 27 Tenant-Leaning · D+14
- County
- — inherits STATE
- City Baltimore
- 12 Strongly Tenant-Friendly · D+58
ZIP-level market 21225
- Home prices YoY
- -31.9%
- Rents YoY
- 4.1%
- Active inventory
- 165
- Price-to-rent
- 15.7×
Monthly cashflow live
- Estimated rent
- $2,280 high interval (Pro) →
- Mortgage (P&I)
- −$1,154
- Tax from tax record
- −$281 /mo · $3,368/yr
- Insurance
- −$92
- HOA
- −$0
- Vacancy / Maint / Mgmt
- −$479
- Net cashflow
- $275
Break-even live
2-unit breakdown (identical units grouped — click to expand)
| Units | Beds | Baths | Est. rent |
|---|---|---|---|
| 1× unit | 2 | 1 | $1,171 |
| 1× unit | 1 | 1 | $1,110 |
| Total (2 units) | $2,280 | ||
UW: 25.0% down · 7.5% · 30yr · 1.5% tax · 5.0% vac · 8.0% maint · 8.0% mgmt
Financing live
Cash to close
- Down payment
- $55,000
- Closing costs
- $6,600
- Reserves months
- —
- Total cash needed
- —
Loan-product check · same deal, 3 products live
Conventional
25% down · 7.5% · 30yr
- Down + closing
- —
- Monthly P&I
- —
- Monthly cashflow
- —
- DSCR
- —
- Eligible?
- —
Personal DTI + credit; lowest rate.
DSCR
20% down · 8.5% · 30yr
- Down + closing
- —
- Monthly P&I
- —
- Monthly cashflow
- —
- DSCR
- —
- Eligible?
- —
No personal income docs; deal must DSCR.
Hard money
10% down · 12.0% · 12mo
- Down + closing
- —
- Monthly P&I
- —
- Monthly cashflow
- —
- DSCR
- —
- Eligible?
- —
Short-term bridge; refi at stabilization.
Rent comps 30 comps
| Address | Beds | Baths | Sqft | Rent | $/sqft | DOM | Units | Dist |
|---|---|---|---|---|---|---|---|---|
| 3528 6th St Brooklyn, MD | 2.0 | 2.5 | 1060 | $1,500 | $1.42 | 17d | 1 | 0.16mi |
| 3513 Horton Ave Brooklyn, MD | 3.0 | 1.0 | 1020 | $1,600 | $1.57 | 17d | 1 | 0.18mi |
| 3544 4th St Brooklyn, MD | 4.0 | 2.5 | 1800 | $1,940 | $1.08 | 23d | 1 | 0.20mi |
| 3569 4th St Brooklyn, MD | 2.0 | 1.5 | 1256 | $1,200 | $0.96 | 17d | 1 | 0.23mi |
| 507 Washburn Ave Brooklyn, MD | 3.0 | 1.5 | 1024 | $2,500 | $2.44 | 23d | 1 | 0.41mi |
| 507 Washburn Ave Brooklyn, MD | 3.0 | 1.5 | 1024 | $2,500 | $2.44 | 20d | 1 | 0.41mi |
| 507 Washburn Ave Brooklyn, MD | 3.0 | 1.5 | 1024 | $2,500 | $2.44 | 4d | 1 | 0.41mi |
| 3822 6th St Brooklyn, MD | 3.0 | 3.0 | 1580 | $1,850 | $1.17 | 23d | 1 | 0.45mi |
| 3840 8th St Brooklyn, MD | 3.0 | 1.5 | 1088 | $1,606 | $1.48 | 4d | 1 | 0.50mi |
| 3826 10th St Unit Entire House Baltimore, MD | 3.0 | 2.0 | 1110 | $2,400 | $2.16 | 23d | 1 | 0.62mi |
| 3828 10th St Brooklyn, MD | 3.0 | 2.0 | 1215 | $2,350 | $1.93 | 43d | 1 | 0.62mi |
| 49 Talbott St Brooklyn, MD | 2.0 | 1.0 | 1300 | $1,300 | $1.00 | 23d | 1 | 0.65mi |
| 3816 W Bay Ave Unit 1 Baltimore, MD | 2.0 | 1.0 | 1364 | $1,155 | $0.85 | 3d | 1 | 0.68mi |
| 1305 E Patapsco Ave Brooklyn, MD | 3.0 | 1.5 | 930 | $1,650 | $1.77 | 4d | 1 | 0.73mi |
| 4206 Audrey Ave Brooklyn, MD | 3.0 | 3.0 | 1104 | $1,950 | $1.77 | 23d | 1 | 0.73mi |
| 4206 Audrey Ave Brooklyn, MD | 2.0 | 2.0 | 1104 | $1,275 | $1.15 | 43d | 1 | 0.73mi |
| 4201 Audrey Ave Unit 1 Brooklyn, MD | 2.0 | 1.0 | 1400 | $1,350 | $0.96 | 23d | 1 | 0.74mi |
| 4400 4th St Unit BASEMENT Baltimore, MD | 2.0 | 1.0 | 925 | $1,350 | $1.46 | 43d | 1 | 0.80mi |
| 1353 Cambria St Brooklyn, MD | 3.0 | 2.0 | 986 | $1,600 | $1.62 | 17d | 1 | 0.80mi |
| 202 W Edgevale Rd Unit A Baltimore, MD | 3.0 | 1.0 | 1824 | $1,650 | $0.90 | 5d | 1 | 0.82mi |
| 217 W Edgevale Rd Brooklyn, MD | 3.0 | 1.5 | 992 | $1,800 | $1.81 | 23d | 1 | 0.87mi |
| 1517 Sycamore St Curtis Bay, MD | 3.0 | 1.5 | 1210 | $1,999 | $1.65 | 23d | 1 | 0.94mi |
| 130 Reedbird Ave Brooklyn, MD | 2.0 | 1.0 | 1152 | $1,700 | $1.48 | 23d | 1 | 0.98mi |
| 303 Arden Rd W Brooklyn, MD | 3.0 | 2.0 | 1388 | $2,500 | $1.80 | 17d | 1 | 1.00mi |
| 4216 Prudence St Curtis Bay, MD | 4.0 | 3.0 | 1116 | $2,100 | $1.88 | 43d | 1 | 1.06mi |
| 5215 Wasena Ave Brooklyn, MD | 3.0 | 1.0 | 1030 | $1,650 | $1.60 | 43d | 1 | 1.09mi |
| 732 Old Riverside Rd Brooklyn, MD | 3.0 | 2.5 | 1570 | $1,900 | $1.21 | 43d | 1 | 1.16mi |
| 1411 Filbert St Unit 2 Baltimore, MD | 2.0 | 1.0 | 1428 | $1,300 | $0.91 | 43d | 1 | 1.19mi |
| 607 Cheraton Rd Brooklyn, MD | 3.0 | 3.0 | 1200 | $1,750 | $1.46 | 14d | 1 | 1.40mi |
| 2454 Terra Firma Rd Brooklyn, MD | 3.0 | 1.0 | 1024 | $1,650 | $1.61 | 14d | 1 | 1.48mi |
Listing history 7 events
-
2026-06-18days on market $219,999 Active 10 DOM
-
2026-06-17days on market $219,999 Active 9 DOM
-
2026-06-16days on market $219,999 Active 8 DOM
-
2026-06-15days on market $219,999 Active 7 DOM
-
2026-06-13days on market $219,999 Active 5 DOM
-
2026-06-08remarks 699-char remark
-
2026-06-08$219,999 Active 1 DOM
ⓘ Source: listings_history table (triggers on properties + properties_extension) + one-shot
backfill from property_details.listing_events for pre-trigger history.
Tax reassessment forecast MD · Partial reset (capped growth)
- Current annual tax
- $3,368 · $281/mo
- Projected year-2 tax
- $3,368 · $281/mo
- Expected delta
- $0/yr ($0/mo · 0.0%)
ⓘ Screening estimate from a state-policy table — verify with the county assessor before closing.
Climate risk First Street
- Flood 1/10 Low FEMA zone X (unshaded) · 0% chance over 30 yrs
- Wildfire 1/10 Low
- Heat 8/10 Severe 7 d/yr ≥102°F today · 15 d/yr by 30 yrs out
- Wind 6/10 Major 27% chance of damaging wind over 30 yrs
- Air quality 4/10 Moderate 5 unhealthy d/yr today · 7 by 30 yrs out
Nearby sold comps map
Loading sold comps map…
Walkable amenities ~0.75 mi
Loading nearby amenities…
Taxation est. · year 1
- Rental income
- $27,360
- − Mortgage interest
- −$12,323
- − Property taxes
- −$3,368
- − Insurance
- −$1,100
- − Repairs & maintenance
- −$2,189
- − Management
- −$2,189
- − Depreciation
- −$6,400
- Taxable loss
- −$209
- Est. tax savings @ 24.0%
- +$50
- After-tax cash flow
- $3,352/yr
For passive investors: Depreciation is non-cash, so a rental often shows a tax loss while cash-flowing — sheltering income. Rental losses are passive: they offset passive income freely, and up to $25,000/yr can offset ordinary (W-2) income if you actively participate and your MAGI is under $100k (phasing out to $0 by $150k); unused losses carry forward. On sale, claimed depreciation is recaptured at up to 25%, and gains may owe capital-gains tax (a 1031 exchange can defer both). Figures are a year-1 estimate at your 24.0% rate — not tax advice; consult a CPA.
Schools (NCES district)
- District
- Baltimore City Public Schools
- NCES district ID
- 2400090
- Math proficiency
- 7% ▼ -9.00%
- Reading proficiency
- 16% ▼ -5.00%
- Median HH income
- $42,108
- Composite
- 10.08/100
- National rank
- #9805
- State rank
- #24 of 24 in MD
Livability — Baltimore
- Score
- 76/100
- State rank
- #90
- US rank
- #3396
Category grades
Schools grade is shown separately in the Schools card above.
Census & demographics
- Census place
- Baltimore, MD
- County
- Anne Arundel County · 535,653 people
- City population
- 588,727
- Metro
- Baltimore-Columbia-Towson, MD
- Population (ZIP)
- 34,062
- Household income
- $54,020
- Rent vs Own
- Severe rent burden
- 1440.0
Population outlook (Baltimore County) Hauer SSP2
- Today (2025)
- 624,249 people
- By 2030
- 621,541 · -0.4%
- By 2040
- 609,756 · -2.3%
- By 2050
- 597,249 · -4.3%
- By 2075
- 552,236 · -11.5%
- By 2100
- 513,934 · -17.7%
Race, ethnicity, and origin ACS 2023
- Neighborhood character
- Diverse neighborhood (Simpson 0.68)
- Race & ethnicity
- Black 42% White 32% Hispanic / Latino 20% Two or more races 8% Native American 3% Asian 2%
- Hispanic origin (detail)
- Mexican 5% Puerto Rican 1%
- Common ancestry
- Romanian 2% Lithuanian 1% Iranian 1%
- Foreign-born
- 12% · Canada, China
- Languages at home
- 81% English-only · Spanish 16% Other Indo-European 1% French/Haitian/Cajun 1%
Political lean MEDSL · Baltimore
- 2024 margin
- Solid D (+73.0) · D 85.2% · R 12.2% · Other 2.6%
- 2008→2024 swing
- -2.5pp toward R · 2008: 75.5pp · 2024: 73.0pp
- All cycles
- 2024: D+73.0 2020: D+76.6 2016: D+74.6 2012: D+76.4 2008: D+75.5
Not yet ingested
- Civics
- —
Market trends
- HPI YoY
- ▼ -119.44%
- Current HPI
- 254.5089
- Rent YoY
- ▲ 4.08%
- Metro
- Baltimore-Columbia-Towson, MD
- State GDP YoY
- ▲ 2.97%
- F500 in state
- 12
Industry mix (Fortune 500 HQ in MD)
| Industry | F500 HQs | Revenue |
|---|---|---|
| Aerospace / Defense | 1 | $71B |
|
||
| Utilities | 1 | $25B |
|
||
| Hotels | 1 | $24B |
|
||
| Consumer Goods | 1 | $7B |
|
||
| Real Estate | 1 | $6B |
|
||
| Chemicals | 1 | $2B |
|
||
Price history
+122.4% since first listed17 events — show timeline
- 2026-06-08 Listed $219,999 BRIGHT MLS
- 2025-11-18 Listing Removed — BRIGHT MLS
- 2025-10-10 Listed $235,000 BRIGHT MLS
- 2025-10-03 Coming Soon — BRIGHT MLS
- 2022-10-28 Sold (Public Records) $165,000 Public Records
- 2022-08-02 Sold (MLS) $165,000 BRIGHT MLS
- 2022-06-10 Pending — BRIGHT MLS
- 2022-06-10 Pending — BRIGHT MLS
- 2022-06-10 Listing Removed — BRIGHT MLS
- 2022-06-06 Listed $165,000 BRIGHT MLS
- 2022-05-31 Listed $165,000 BRIGHT MLS
- 2020-12-31 Sold (MLS) $90,000 BRIGHT MLS
- 2020-09-18 Pending — BRIGHT MLS
- 2020-09-10 Price Changed $89,900 BRIGHT MLS
- 2020-08-05 Relisted — BRIGHT MLS
- 2020-08-04 Listing Removed — BRIGHT MLS
- 2020-08-03 Listed $98,900 BRIGHT MLS
Property tax history
+6.1%/yrLatest (2025): $3,368 · +34.3% YoY. Source: county tax records.
Cash-flow waterfall
monthlySold comps — $/sqft
last 12 mo · ≤1 miLoading sold comps…