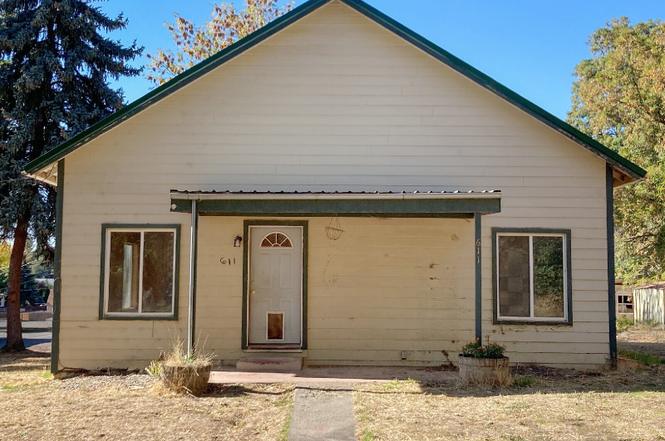
611 N Front · Dayton, WA
Flood risk 1/10 · Minimal
- FEMA flood zone
- X
- Chance of flooding over 30 yrs
- 0.0%
- Est. flood insurance / yr
- $473 – $860
Fire risk 3/10 · Minor
- Est. fire insurance / yr
- $604 – $1,122
Heat risk 4/10 · Minor
- Hot days now (above 95°F)
- 7 days/yr
- Hot days in 30 yrs
- 16 days/yr
Wind risk 1/10 · Minimal
- Chance of severe wind over 30 yrs
- —
Air-quality risk 6/10 · Moderate
- Unhealthy air days now
- 8 days/yr
- Unhealthy air days in 30 yrs
- 9 days/yr
Risk factors via First Street. Map © Google.
Why this score? — see what drove the C- grade
The composite is a weighted blend of 9 inputs, each scored 0–100. Each bar is that input's sub-score; the figure is the points it added to the 100-point composite (weight × sub-score).
- ARV discount +15.0/15.0
- Cash flow +14.2/30.0
- Schools +5.3/10.0
- DSCR +4.3/10.0
- Livability +4.0/5.0
- 1% rule +3.9/10.0
- Rent growth +2.5/5.0
- Condition / age +2.5/5.0
- Appreciation +0.0/10.0
$158,500
🖨 Deal sheet (PDF) 📄 Offer letter ✓ Due diligence
Listing remarks
Dayton, Washington is calling you! Charming 1930s home on nearly Half an acre – Fixer opportunity! Bring your tools and vision! This three-bedroom home sits on a spacious 0.49-acre lot at the end of a quiet dead-end street in Dayton. Built in 1930, the home retains its original character and offers a great foundation for renovation or investment. Features include breakfast nook, a covered front porch, partial basement for storage or workshop space, and plenty of room to expand, garden, or build a shop. Peaceful location just minutes from downtown Dayton amenities. This is your chance to create value and restore this classic home to its full potential!
Key facts
- Breakfast nook
- Covered front porch
- 1930s home
Tags
Neighborhood map
What this means for you Summary
Snapshot
- This is a 3-bed/1.0-bath single-family listed at $158k.
Deal economics
- At list price, monthly cash flow is $27 ($322/yr) — positive.
- The deal already cash-flows at list — no discount required.
- To meet the 1% rule (rent ≥ 1% of price), the offer needs to be $141k (11.3% below list).
- Recommended offer: $141k (11.3% below list) — sets the bar for 1% rule.
- Cap rate 6.5% vs local median 2.1% in Dayton — top-decile yield for the area; either an underpriced asset or a hidden risk that comps aren't pricing in. Stress-test before assuming the spread holds.
Location & tenants
- Location reads 80/100 on livability (#86 in WA, #1,643 nationally) — a professional / high-income tenant draw. Strengths: cost of living A+, housing A+, health & safety A+; Watch: amenities D, commute F.
- Dayton School District (town): math 54% / reading 67% proficiency, ranked #66 of 291 in WA (top 23%) — acceptable for families but not a draw, mixed tenant base, ~2y average lease.
- Zoned schools: Dayton Elementary School (193 students, 52% FRL); Dayton Middle School (89 students, 52% FRL); Dayton High School (108 students, 57% FRL).
- Market conditions: 61 active listings in the ZIP; 1 comparable units currently listed for rent nearby; 2 units permitted in Columbia County in 2024 (0 in 5+ unit buildings).
Forward outlook
- Local home prices are declining (-3.0%/yr); year-one equity from $1k of loan paydown is wiped out by about $5k of value loss. Plan a longer hold.
- Columbia County population projected at -20% by 2050 — secular population decline; favor cash flow + early exit over multi-decade hold.
Negotiation context
- It's been on market 64 days — a 6% lower offer ($149k) is reasonable based on typical stale-listing flexibility.
- 3 sale attempts; this cycle's ask has dropped $11k (7%) from the opening price — seller is motivated, your offer sets the floor, not the list.
Risks & watch-outs
- Watch-outs: built in 1930 — expect roof / HVAC / electrical / plumbing capex.
Questions for the listing agent
- It's been on market 64 days. Have you received any prior offers? Is the seller open to a 11% concession, seller financing, or rate buy-down credit?
- Built in 1930 — when were the roof, HVAC, electrical panel, plumbing, and water heater last replaced?
- Why hasn't it sold? Are there any deal-killer items the seller is aware of (foundation, flood, title, zoning, code violations)?
- Is there a deadline driving the sale (1031 exchange, divorce, estate, relocation)? That informs how much negotiation room exists.
- Schools are B-rated — typically a magnet for longer-tenancy family renters. What's the average tenant stay here, and is there a school-zone premium baked into asking?
- What's the average days-on-market for RENTAL listings here right now (not sales)? A rising rental-DOM trend means longer vacancies and softer asking-rent achievability than the comps imply.
- What's the recent tenant-quality profile in this submarket — average credit score on applications, eviction rate, late-payment / NSF rate, and stable-employment percentage? A property-management company in the area should have these aggregated.
- How much new for-sale + rental construction is in the pipeline within 1–3 miles? Heavy new supply typically softens prices + rents 12–24 months out; constrained supply supports both.
Investment metrics
- 1% rule
- 0.89% ✗
- Cap rate
- 6.50%
- Cash-on-cash
- 0.72%
- DSCR
- 1.03
- GRM
- 9.4
CMA / ARV
- ARV (on-the-fly)
- $232,704
- Comps found
- 12
Show comp detail 12 sales within ~0.75 mi
| Address | Dist | Beds/Ba | Sqft | Sold | Price | $/sf | Match |
|---|---|---|---|---|---|---|---|
| 216 E Dayton Ave E | 0.16mi | 3/1.0 | 1,140 (-1%) | 6mo | $265,000 | $232 | 86 |
| 211 E Commercial St | 0.32mi | 2/1.0 (-1) | 1,152 (0%) | 2mo | $150,000 | $130 | 79 |
| 614 N Willow St | 0.13mi | 2/1.0 (-1) | 1,193 (+4%) | 10mo | $343,000 | $288 | 74 |
| 213 W Main St | 0.40mi | 3/1.0 | 1,172 (+2%) | 10mo | $275,000 | $235 | 70 |
| 521 E Washington Ave | 0.45mi | 2/1.0 (-1) | 1,136 (-1%) | 8mo | $240,000 | $211 | 65 |
| 212 E Washington Ave | 0.29mi | 3/1.5 | 1,256 (+9%) | 8mo | $205,000 | $163 | 63 |
| 125 W Patit Ave | 0.20mi | 3/1.0 | 1,314 (+14%) | 15mo | $265,000 | $202 | 55 |
| 514 E Washington Ave | 0.47mi | 3/1.0 | 1,220 (+6%) | 16mo | $175,000 | $143 | 55 |
| 528 E Main St | 0.55mi | 2/2.0 (-1) | 1,238 (+8%) | 9mo | $137,500 | $111 | 46 |
| 405 E Park St | 0.67mi | 2/2.0 (-1) | 1,227 (+6%) | 7mo | $205,000 | $167 | 43 |
| 507 S 3rd St | 0.70mi | 2/1.0 (-1) | 1,233 (+7%) | 10mo | $230,000 | $187 | 42 |
| 308 E Spring St | 0.55mi | 2/2.0 (-1) | 1,004 (-13%) | 5mo | $220,000 | $219 | 40 |
Match score weights: distance 35% · size 25% · config 20% · recency 20%. Top-matched comps best support the ARV.
Projected returns pro-forma
-3.0% appreciation · 3.0% rent growth · sell at horizon
- IRR
- -15.1%
- Equity multiple
- 0.46×
- Total profit
- $-23,962
- Equity at exit
- $23,633
- IRR
- -6.5%
- Equity multiple
- 0.58×
- Total profit
- $-18,608
- Equity at exit
- $13,704
Cash invested: $44,380 (down + closing). Projections, not guarantees.
Landlord ↔ Tenant lean methodology
- Overall (STATE)
- 28 Tenant-Leaning
- State Washington
- 28 Tenant-Leaning · D+8
- County
- — inherits STATE
- City
- — inherits STATE
ZIP-level market 99328
- Active inventory
- 61
- Price-to-rent
- 9.4×
Monthly cashflow live
- Estimated rent
- $1,406 medium interval (Pro) →
- Mortgage (P&I)
- −$831
- Tax from tax record
- −$187 /mo · $2,245/yr
- Insurance
- −$66
- HOA
- −$0
- Vacancy / Maint / Mgmt
- −$295
- Net cashflow
- $27
Break-even live
Sensitivity live
| Price | -10% $117 | -5% $72 | +0% $27 | +5% $-18 | +10% $-63 |
|---|---|---|---|---|---|
| Rent | -10% $-84 | -5% $-29 | +0% $27 | +5% $82 | +10% $138 |
| Rate | -1.0pp $107 | -0.5pp $67 | base $27 | +0.5pp $-14 | +1.0pp $-56 |
UW: 25.0% down · 7.5% · 30yr · 1.5% tax · 5.0% vac · 8.0% maint · 8.0% mgmt
Financing live
Cash to close
- Down payment
- $39,625
- Closing costs
- $4,755
- Reserves months
- —
- Total cash needed
- —
Loan-product check · same deal, 3 products live
Conventional
25% down · 7.5% · 30yr
- Down + closing
- —
- Monthly P&I
- —
- Monthly cashflow
- —
- DSCR
- —
- Eligible?
- —
Personal DTI + credit; lowest rate.
DSCR
20% down · 8.5% · 30yr
- Down + closing
- —
- Monthly P&I
- —
- Monthly cashflow
- —
- DSCR
- —
- Eligible?
- —
No personal income docs; deal must DSCR.
Hard money
10% down · 12.0% · 12mo
- Down + closing
- —
- Monthly P&I
- —
- Monthly cashflow
- —
- DSCR
- —
- Eligible?
- —
Short-term bridge; refi at stabilization.
Rent comps 1 comps
| Address | Beds | Baths | Sqft | Rent | $/sqft | DOM | Units | Dist |
|---|---|---|---|---|---|---|---|---|
| 700 S 5th St Dayton, WA | 2.0–4.0 | 1.0–2.0 | 992 | $1,406 | $1.42 | 45d | 1 | 0.88mi |
Listing history 10 events
-
2026-03-31soldstatus $150,000 Closed
-
2026-02-20status Pending
-
2026-02-02status Active
-
2025-12-25status Pending
-
2025-12-20status Pending
-
2025-11-15price $158,500
-
2025-11-15price $158,500
-
2025-10-22$169,900 Active
-
2025-10-22$169,900 Active
-
2013-08-07soldstatus $133,875
ⓘ Source: listings_history table (triggers on properties + properties_extension) + one-shot
backfill from property_details.listing_events for pre-trigger history.
Tax reassessment forecast WA · Resets to sale price
- Current annual tax
- $2,245 · $187/mo
- Projected year-2 tax
- $2,245 · $187/mo
- Expected delta
- $0/yr ($0/mo · 0.0%)
ⓘ Screening estimate from a state-policy table — verify with the county assessor before closing.
Climate risk First Street
- Flood 1/10 Low FEMA zone X · 0% chance over 30 yrs
- Wildfire 3/10 Moderate
- Heat 4/10 Moderate 7 d/yr ≥95°F today · 16 d/yr by 30 yrs out
- Wind 1/10 Low
- Air quality 6/10 Major 8 unhealthy d/yr today · 9 by 30 yrs out
Nearby sold comps map
Loading sold comps map…
Walkable amenities ~0.75 mi
Loading nearby amenities…
Taxation est. · year 1
- Rental income
- $16,878
- − Mortgage interest
- −$8,878
- − Property taxes
- −$2,245
- − Insurance
- −$792
- − Repairs & maintenance
- −$1,350
- − Management
- −$1,350
- − Depreciation
- −$4,611
- Taxable loss
- −$2,349
- Est. tax savings @ 24.0%
- +$564
- After-tax cash flow
- $886/yr
For passive investors: Depreciation is non-cash, so a rental often shows a tax loss while cash-flowing — sheltering income. Rental losses are passive: they offset passive income freely, and up to $25,000/yr can offset ordinary (W-2) income if you actively participate and your MAGI is under $100k (phasing out to $0 by $150k); unused losses carry forward. On sale, claimed depreciation is recaptured at up to 25%, and gains may owe capital-gains tax (a 1031 exchange can defer both). Figures are a year-1 estimate at your 24.0% rate — not tax advice; consult a CPA.
Schools (NCES district)
- District
- Dayton School District
- NCES district ID
- 5302040
- Math proficiency
- 54% ▲ 4.00%
- Reading proficiency
- 67% ▲ 8.00%
- Median HH income
- $44,609
- Composite
- 52.54/100
- National rank
- #3380
- State rank
- #66 of 291 in WA
Livability — Dayton
- Score
- 80/100
- State rank
- #86
- US rank
- #1643
Category grades
Schools grade is shown separately in the Schools card above.
Census & demographics
- Census place
- Dayton, WA
- Population (ZIP)
- 3,595
Population outlook (Columbia County) Hauer SSP2
- Today (2025)
- 3,651 people
- By 2030
- 3,482 · -4.6%
- By 2040
- 3,159 · -13.5%
- By 2050
- 2,931 · -19.7%
- By 2075
- 2,817 · -22.8%
- By 2100
- 2,964 · -18.8%
Race, ethnicity, and origin ACS 2023
- Neighborhood character
- Predominantly White (81%)
- Race & ethnicity
- White 81% Two or more races 14% Hispanic / Latino 9%
- Hispanic origin (detail)
- Mexican 8%
- Common ancestry
- Italian 3% Slovak 3% Iranian 3%
- Foreign-born
- 3% · Canada
- Languages at home
- 92% English-only · Spanish 6% Other Asian/Pacific 2% Other Indo-European 1%
Political lean MEDSL · Columbia
- 2024 margin
- Solid R (+43.5) · D 26.7% · R 70.2% · Other 3.1%
- 2008→2024 swing
- -7.0pp toward R · 2008: -36.5pp · 2024: -43.5pp
- All cycles
- 2024: R+43.5 2020: R+43.5 2016: R+44.6 2012: R+41.0 2008: R+36.5
Not yet ingested
- Civics
- —
Market trends
- HPI YoY
- ▼ -156.27%
- Current HPI
- 177.3211
- Rent YoY
- —
- Metro
- —
- State GDP YoY
- ▲ 4.65%
- F500 in state
- 22
Industry mix (Fortune 500 HQ in WA)
| Industry | F500 HQs | Revenue |
|---|---|---|
| Retail | 2 | $269B |
|
||
| Technology / Retail | 1 | $638B |
|
||
| Technology | 1 | $245B |
|
||
| Telecommunications | 1 | $38B |
|
||
| Food / Beverage | 1 | $36B |
|
||
| Automotive / Trucks | 1 | $34B |
|
||
Price history
+12.0% since first listed10 events — show timeline
- 2026-03-31 Sold (MLS) $150,000 NWMLS as Distributed by MLS Grid
- 2026-02-20 Pending — NWMLS as Distributed by MLS Grid
- 2026-02-02 Relisted — NWMLS as Distributed by MLS Grid
- 2025-12-25 Pending — RMLS
- 2025-12-20 Pending — NWMLS as Distributed by MLS Grid
- 2025-11-15 Price Changed $158,500 RMLS
- 2025-11-15 Price Changed $158,500 NWMLS as Distributed by MLS Grid
- 2025-10-22 Listed $169,900 RMLS
- 2025-10-22 Listed $169,900 NWMLS as Distributed by MLS Grid
- 2013-08-07 Sold (Public Records) $133,875 Public Records
Property tax history
+5.2%/yrLatest (2026): $2,245 · +27.1% YoY. Source: county tax records.
Cash-flow waterfall
monthlySold comps — $/sqft
last 12 mo · ≤1 miLoading sold comps…