 Duplex
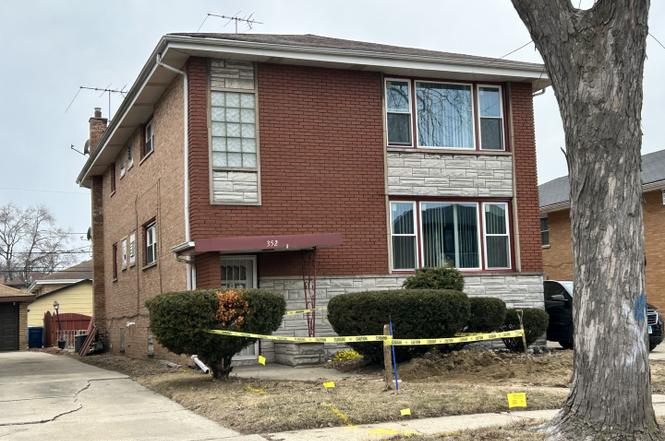
352 Crandon Ave · Calumet City, IL
Flood risk 1/10 · Minimal
- FEMA flood zone
- X (unshaded)
- Chance of flooding over 30 yrs
- 0.0%
- Est. flood insurance / yr
- $473 – $860
Fire risk 1/10 · Minimal
- Est. fire insurance / yr
- $804 – $1,492
Heat risk 3/10 · Minor
- Hot days now (above 101°F)
- 7 days/yr
- Hot days in 30 yrs
- 15 days/yr
Wind risk 2/10 · Minimal
- Chance of severe wind over 30 yrs
- 0.0%
Air-quality risk 4/10 · Minor
- Unhealthy air days now
- 4 days/yr
- Unhealthy air days in 30 yrs
- 5 days/yr
Risk factors via First Street. Map © Google.
Why this score? — see what drove the B- grade
The composite is a weighted blend of 9 inputs, each scored 0–100. Each bar is that input's sub-score; the figure is the points it added to the 100-point composite (weight × sub-score).
- Cash flow +30.0/30.0
- DSCR +10.0/10.0
- 1% rule +9.4/10.0
- ARV discount +7.5/15.0
- Rent growth +4.0/5.0
- Livability +3.6/5.0
- Condition / age +2.2/5.0
- Schools +0.7/10.0
- Appreciation +0.0/10.0
$275,000
🖨 Deal sheet (PDF) 📄 Offer letter ✓ Due diligence
Multi-family units
County records classify this as Multi-Family (2-4 Unit). Listing-text estimate: 2 units. confirmed
Listing remarks
Great for investors or owner occupants. Don't miss this solid brick Calumet City 2 unit building, offering space and functionality. Each unit offers 3 bedrooms and 1.5 baths. Hardwood floors Throughout. Kitchens in both units offer Oak Cabinets in first floor unit with double countertop and backsplashes. New windows throughout. First floor has enclosed porch with French barn doors. Second floor balcony. Ceiling fans. Full bathroom in the basement. 2.5 Car Detached Garage. Property is being sold As-Is. Multiple offers received. Please submit highest and best by 5:00 Monday May 4th.
Key facts
- Oak cabinets
- Backsplashes
- French barn doors
Tags
Property features AI
Finance
- Other: Property contains two units (3-bedroom units) — suitable for multi-family ownership; Lease information: both units show lease expiration dates (listed as December 1, 1999) and security deposit noted as 0 for Unit 1; Parcel number available
- Financial info: Special service area: No; Tax exemptions listed: Homeowner, Senior, Senior Freeze
Exterior
- Parking: Detached garage with 2 garage spaces (2 total parking spaces)
- Utilities: Public water; Public sewer
- Home design: Two- to four-unit building (2 units); Fee simple ownership; Built 51–60 years ago; Not rebuilt or rehabbed; Zoned MULTI
- Construction: Brick construction; Built before 1978
- Exterior features: Balcony; Curbs, sidewalks, street lights, and paved streets
Interior
- Kitchen: Stove; Refrigerator
- Bedrooms: 6 bedrooms total; Each unit contains a 3-bedroom layout (first-floor 3 BR unit; second-floor 3 BR unit)
- Bathrooms: 3 full bathrooms; 2 half bathrooms; Each unit has 1 full and 1 half bathroom
- Heating & cooling: Natural gas heating
- Interior features: 10 total rooms; Partially finished full basement; Ceiling fan(s); Sump pump; Balcony
- Laundry & utility: Tenant pays electric, gas, and heat for units
Neighborhood map
What this means for you Summary
Snapshot
- This is a 2 × 3.0-bed/1.5-bath units multifamily listed at $275k. Condition is rated fair.
Deal economics
- At list price, monthly cash flow is $1k ($15k/yr) — positive. Per door: $609/mo.
- The deal already cash-flows at list — no discount required.
- Meets the 1% rule at list price ($4k rent vs $275k).
- Recommended offer: $267k (3.0% below list) — sets the bar for market timing.
- Cap rate 11.6% vs local median 8.3% in Calumet City — top-decile yield for the area; either an underpriced asset or a hidden risk that comps aren't pricing in. Stress-test before assuming the spread holds.
Location & tenants
- Location reads 71/100 on livability (#330 in IL) — a middle-class / working-renter tenant base. Strengths: commute A+, cost of living A+, housing A+; Watch: employment C-, schools F, crime D-.
- Thornton Twp Hsd 205 (suburban): math 7% / reading 8% proficiency, ranked #594 of 620 in IL (top 96%) — low school quality limits family demand, transient renter base, plan for 1-2y turnover.
- Market conditions: Rents rising fast (+6.2%/yr); 196 active listings in the ZIP; 6,272 units permitted in Cook County in 2024 (4,658 in 5+ unit buildings).
- At $3,947/mo this rent would consume 86% of the median local household income ($55k/yr) (locally 2415% of renters already pay >50% of income on rent) — very limited rent-growth headroom before tenants either downsize or default.
Forward outlook
- Local home prices are declining (-3.0%/yr); year-one equity from $2k of loan paydown is wiped out by about $8k of value loss. Plan a longer hold.
- At projected returns (-3.0% appreciation + 6.2% rent growth), your $77k cash investment doubles in ~6 years — after that, you're playing with house money.
Negotiation context
- It's been on market 50 days — a 3% lower offer ($267k) is reasonable based on typical stale-listing flexibility.
Questions for the listing agent
- It's been on market 50 days. Have you received any prior offers? Is the seller open to a 3% concession, seller financing, or rate buy-down credit?
- Can we see the unit-by-unit rent roll, current vacancy, and any below-market leases? What's the average tenancy length?
- What capital expenditures (roof, boiler, parking lot, exteriors) have been made in the last 5 years, and what's planned in the next 2?
- Have any recent inspections been done? Can we get a copy of the seller's disclosures and any deferred-maintenance estimates?
- Built in 1972 — when were the roof, HVAC, electrical panel, plumbing, and water heater last replaced?
- Is there a deadline driving the sale (1031 exchange, divorce, estate, relocation)? That informs how much negotiation room exists.
- Schools are F-rated, which usually means shorter tenancies and higher turnover. Who's the typical renter profile here, and what's been the actual vacancy rate?
- Crime grade is D in this area — have there been break-ins, vandalism, or insurance claims at this property in the last 3 years? What carrier currently insures it and at what premium?
- What's the average days-on-market for RENTAL listings here right now (not sales)? A rising rental-DOM trend means longer vacancies and softer asking-rent achievability than the comps imply.
- What's the recent tenant-quality profile in this submarket — average credit score on applications, eviction rate, late-payment / NSF rate, and stable-employment percentage? A property-management company in the area should have these aggregated.
- How much new apartment / multifamily construction is in the pipeline within 1–3 miles? Heavy new supply (>2% of stock underway) typically softens rents 12–24 months out; light construction supports rent growth.
Investment metrics
- 1% rule
- 1.44% ✓
- Cap rate
- 11.61%
- Cash-on-cash
- 18.98%
- DSCR
- 1.84
- GRM
- 5.8
CMA / ARV
No comps found within radius.
Show comp detail 12 sales within ~0.75 mi
| Address | Dist | Beds/Ba | Sqft | Sold | Price | $/sf | Match |
|---|---|---|---|---|---|---|---|
| 353 Luella Ave | 0.03mi | 5/2.5 (-1) | — | 10mo | $300,000 | — | 71 |
| 375 Madison Ave | 0.41mi | 6/3.0 | — | 4mo | $163,000 | — | 66 |
| 1641 Patricia Pl | 0.38mi | 5/3.0 (-1) | — | 2mo | $276,500 | — | 63 |
| 454 Madison Ave | 0.50mi | 6/4.0 | — | 2mo | $300,000 | — | 58 |
| 412 Prairie Ave | 0.52mi | 6/4.0 | — | 4mo | $280,000 | — | 56 |
| 430 Madison Ave | 0.48mi | 6/3.0 | — | 12mo | $250,000 | — | 55 |
| 1645 Patricia Pl | 0.38mi | 7/5.0 (+1) | — | 3mo | $242,000 | — | 54 |
| 518 Jeffery Ave | 0.54mi | 6/4.0 | — | 13mo | $219,000 | — | 48 |
| 74 Yates Ave | 0.46mi | 7/5.0 (+1) | — | 8mo | $260,000 | — | 47 |
| 1616 Memorial Dr | 0.53mi | 7/4.0 (+1) | — | 9mo | $335,000 | — | 46 |
| 89 Oglesby Ave | 0.40mi | 7/5.0 (+1) | — | 12mo | $357,000 | — | 46 |
| 382 Prairie Ave | 0.50mi | 7/5.0 (+1) | — | 9mo | $300,000 | — | 44 |
Match score weights: distance 35% · size 25% · config 20% · recency 20%. Top-matched comps best support the ARV.
Projected returns pro-forma
-3.0% appreciation · 6.17% rent growth · sell at horizon
- IRR
- 14.4%
- Equity multiple
- 1.60×
- Total profit
- $46,040
- Equity at exit
- $41,003
- IRR
- 25.4%
- Equity multiple
- 3.56×
- Total profit
- $197,084
- Equity at exit
- $23,777
Cash invested: $77,000 (down + closing). Projections, not guarantees.
Landlord ↔ Tenant lean methodology
- Overall (STATE)
- 43 Moderately Tenant-Leaning
- State Illinois
- 43 Moderately Tenant-Leaning · D+7
- County
- — inherits STATE
- City
- — inherits STATE
ZIP-level market 60409
- Home prices YoY
- -27.6%
- Rents YoY
- 6.2%
- Active inventory
- 196
- Price-to-rent
- 11.6×
Monthly cashflow live
- Estimated rent
- $3,947 high interval (Pro) →
- Mortgage (P&I)
- −$1,442
- Tax est. 1.5%
- −$344 /mo · $4,125/yr
- Insurance
- −$115
- HOA
- −$0
- Vacancy / Maint / Mgmt
- −$829
- Net cashflow
- $1,218
Break-even live
Sensitivity live
| Price | -10% $1,408 | -5% $1,313 | +0% $1,218 | +5% $1,123 | +10% $1,028 |
|---|---|---|---|---|---|
| Rent | -10% $906 | -5% $1,062 | +0% $1,218 | +5% $1,374 | +10% $1,529 |
| Rate | -1.0pp $1,356 | -0.5pp $1,288 | base $1,218 | +0.5pp $1,146 | +1.0pp $1,074 |
2-unit breakdown (identical units grouped — click to expand)
| Units | Beds | Baths | Est. rent |
|---|---|---|---|
| 2× units | 3.0 | 1.5 | $3,946 |
| #1 | 3.0 | 1.5 | $1,973 |
| #2 | 3.0 | 1.5 | $1,973 |
| Total (2 units) | $3,947 | ||
UW: 25.0% down · 7.5% · 30yr · 1.5% tax · 5.0% vac · 8.0% maint · 8.0% mgmt
Financing live
Cash to close
- Down payment
- $68,750
- Closing costs
- $8,250
- Reserves months
- —
- Total cash needed
- —
Loan-product check · same deal, 3 products live
Conventional
25% down · 7.5% · 30yr
- Down + closing
- —
- Monthly P&I
- —
- Monthly cashflow
- —
- DSCR
- —
- Eligible?
- —
Personal DTI + credit; lowest rate.
DSCR
20% down · 8.5% · 30yr
- Down + closing
- —
- Monthly P&I
- —
- Monthly cashflow
- —
- DSCR
- —
- Eligible?
- —
No personal income docs; deal must DSCR.
Hard money
10% down · 12.0% · 12mo
- Down + closing
- —
- Monthly P&I
- —
- Monthly cashflow
- —
- DSCR
- —
- Eligible?
- —
Short-term bridge; refi at stabilization.
Listing history 15 events
-
2026-06-17status $275,000 Pending 50 DOM
-
2026-06-16days on market $275,000 Contingent - Continue to Show 50 DOM
-
2026-06-15days on market $275,000 Contingent - Continue to Show 49 DOM
-
2026-06-13days on market $275,000 Contingent - Continue to Show 47 DOM
-
2026-06-13days on market $275,000 Contingent - Continue to Show 46 DOM
-
2026-06-09days on market $275,000 Contingent - Continue to Show 43 DOM
-
2026-06-08days on market $275,000 Contingent - Continue to Show 42 DOM
-
2026-06-07days on market $275,000 Contingent - Continue to Show 41 DOM
-
2026-06-04days on market $275,000 Contingent - Continue to Show 38 DOM
-
2026-06-03days on market $275,000 Contingent - Continue to Show 37 DOM
-
2026-06-02days on market $275,000 Contingent - Continue to Show 36 DOM
-
2026-06-01days on market $275,000 Contingent - Continue to Show 35 DOM
-
2026-05-31days on market $275,000 Contingent - Continue to Show 34 DOM
-
2026-05-12historical Contingent - Continue to Show
-
2026-04-26$275,000 Active
ⓘ Source: listings_history table (triggers on properties + properties_extension) + one-shot
backfill from property_details.listing_events for pre-trigger history.
Climate risk First Street
- Flood 1/10 Low FEMA zone X (unshaded) · 0% chance over 30 yrs
- Wildfire 1/10 Low
- Heat 3/10 Moderate 7 d/yr ≥101°F today · 15 d/yr by 30 yrs out
- Wind 2/10 Low 0% chance of damaging wind over 30 yrs
- Air quality 4/10 Moderate 4 unhealthy d/yr today · 5 by 30 yrs out
Nearby sold comps map
Loading sold comps map…
Walkable amenities ~0.75 mi
Loading nearby amenities…
Taxation est. · year 1
- Rental income
- $47,364
- − Mortgage interest
- −$15,404
- − Property taxes
- −$4,125
- − Insurance
- −$1,375
- − Repairs & maintenance
- −$3,789
- − Management
- −$3,789
- − Depreciation
- −$8,000
- Taxable income
- $10,881
- Est. tax owed @ 24.0%
- −$2,612
- After-tax cash flow
- $12,000/yr
For passive investors: Depreciation is non-cash, so a rental often shows a tax loss while cash-flowing — sheltering income. Rental losses are passive: they offset passive income freely, and up to $25,000/yr can offset ordinary (W-2) income if you actively participate and your MAGI is under $100k (phasing out to $0 by $150k); unused losses carry forward. On sale, claimed depreciation is recaptured at up to 25%, and gains may owe capital-gains tax (a 1031 exchange can defer both). Figures are a year-1 estimate at your 24.0% rate — not tax advice; consult a CPA.
Condition & rehab AI · 12 photos
This 2-unit property requires moderate renovations, including painting, flooring, and kitchen updates, to improve its condition and value.
Repairs flagged
- Major Kitchen cabinets — No photos of kitchen
- Minor Paint touch-ups — Paint appears worn in some areas
Value-add opportunities
- Both Painting — Enhances curb appeal and interior aesthetics
- Both New flooring — Improves living space and adds value
- Both Kitchen renovation — Modernizes the space and adds value
Renovation cost estimate screening
| Repair item | Severity | Est. cost |
|---|---|---|
| Kitchen cabinets · No photos of kitchen | Major | $15,000–50,000 |
| Paint touch-ups · Paint appears worn in some areas | Minor | $500–3,000 |
| Total estimated repair cost · 2 items | $15,500–53,000 |
Value-add ROI direction
- Both Painting — Enhances curb appeal and interior aesthetics ↑
- Both New flooring — Improves living space and adds value ↑
- Both Kitchen renovation — Modernizes the space and adds value ↑
ⓘ Cost ranges are severity-bucket heuristics (US national rule-of-thumb). Get contractor quotes + a written scope before underwriting a rehab budget.
Schools (NCES district)
- District
- Thornton Twp Hsd 205
- NCES district ID
- 1738970
- Math proficiency
- 7% ▬ 0.00%
- Reading proficiency
- 8% ▼ -2.00%
- Median HH income
- $43,392
- Composite
- 6.92/100
- National rank
- #9976
- State rank
- #594 of 620 in IL
Livability — Calumet City
- Score
- 71/100
- State rank
- #330
- US rank
- #6552
Category grades
Schools grade is shown separately in the Schools card above.
Census & demographics
- Census place
- Calumet City, IL
- County
- Cook County · 4,486,803 people
- City population
- 35,100
- Metro
- Chicago-Naperville-Elgin, IL-IN-WI
- Population (ZIP)
- 35,100
- Household income
- $55,369
- Rent vs Own
- Severe rent burden
- 2415.0
Population outlook (Cook County) Hauer SSP2
- Today (2025)
- 5,347,519 people
- By 2030
- 5,357,703 · +0.2%
- By 2040
- 5,324,924 · -0.4%
- By 2050
- 5,230,762 · -2.2%
- By 2075
- 4,785,735 · -10.5%
- By 2100
- 4,188,836 · -21.7%
Race, ethnicity, and origin ACS 2023
- Neighborhood character
- Predominantly Black (74%)
- Race & ethnicity
- Black 74% Hispanic / Latino 15% White 7% Two or more races 4%
- Hispanic origin (detail)
- Mexican 14%
- Common ancestry
- Romanian 2%
- Foreign-born
- 9% · Canada
- Languages at home
- 83% English-only · Spanish 14%
Political lean MEDSL · Cook
- 2024 margin
- Solid D (+42.0) · D 70.4% · R 28.4% · Other 1.2%
- 2008→2024 swing
- -11.4pp toward R · 2008: 53.4pp · 2024: 42.0pp
- All cycles
- 2024: D+42.0 2020: D+50.3 2016: D+53.0 2012: D+49.4 2008: D+53.4
Not yet ingested
- Civics
- —
Market trends
- HPI YoY
- ▼ -75.01%
- Current HPI
- 197.2137
- Rent YoY
- ▲ 6.17%
- Metro
- Chicago-Naperville-Elgin, IL-IN-WI
- State GDP YoY
- ▲ 1.59%
- F500 in state
- 60
Industry mix (Fortune 500 HQ in IL)
| Industry | F500 HQs | Revenue |
|---|---|---|
| Insurance | 4 | $201B |
|
||
| Consumer Goods | 4 | $87B |
|
||
| Industrial Machinery | 3 | $64B |
|
||
| Healthcare | 2 | $55B |
|
||
| Retail / Pharmacy | 1 | $148B |
|
||
| Agriculture / Food | 1 | $86B |
|
||
Price history
2 events — show timeline
- 2026-05-12 Contingent — MRED as Distributed by MLS Grid
- 2026-04-26 Listed $275,000 MRED as Distributed by MLS Grid
Cash-flow waterfall
monthlySold comps — $/sqft
last 12 mo · ≤1 miLoading sold comps…