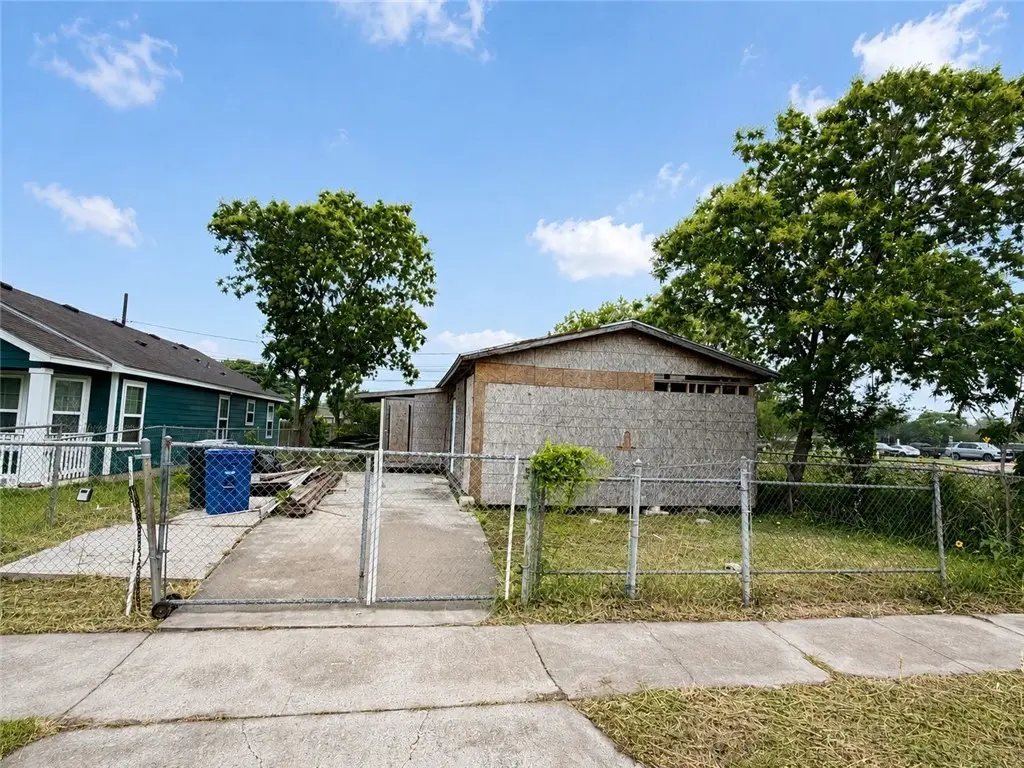
2821 Nogales St · Corpus Christi, TX
Flood risk 4/10 · Minor
- FEMA flood zone
- X (unshaded)
- Chance of flooding over 30 yrs
- 0.2%
- Est. flood insurance / yr
- $507 – $1,088
Fire risk 1/10 · Minimal
- Est. fire insurance / yr
- $1,222 – $2,270
Heat risk 10/10 · Severe
- Hot days now (above 107°F)
- 7 days/yr
- Hot days in 30 yrs
- 26 days/yr
Wind risk 9/10 · Severe
- Chance of severe wind over 30 yrs
- 99.0%
Air-quality risk 1/10 · Minimal
- Unhealthy air days now
- 0 days/yr
- Unhealthy air days in 30 yrs
- 0 days/yr
Risk factors via First Street. Map © Google.
Why this score? — see what drove the B grade
The composite is a weighted blend of 9 inputs, each scored 0–100. Each bar is that input's sub-score; the figure is the points it added to the 100-point composite (weight × sub-score).
- Cash flow +30.0/30.0
- 1% rule +10.0/10.0
- DSCR +10.0/10.0
- ARV discount +7.5/15.0
- Appreciation +5.7/10.0
- Livability +3.9/5.0
- Schools +2.8/10.0
- Rent growth +2.5/5.0
- Condition / age +2.5/5.0
$55,000
🖨 Deal sheet 📄 Offer letter ✓ Due diligence
Listing remarks MLS
Great investment property! 2bed/1 bath/ 2 living areas.
Key facts
- 4,008 sq ft lot
- Built 1947
- Listed 42 days
Property features AI
Finance
- Other: Lot size approximately 0.09 acres
- Financial info: No financial details provided
- HOA & community: Short-term rentals allowed
Exterior
- Parking: On-street parking
- Security: No security features listed
- Utilities: Public water available; Public sewer available
- Home design: Single-story home; Entry level not specified; Facing direction not specified; Single-story (total 1)
- Construction: Wood siding exterior; Shingle roof; Pillar/post/pier foundation; Built year not specified
- Exterior features: Chain link fencing; No additional exterior features listed
Interior
- Kitchen: No kitchen appliances or features listed
- Bedrooms: No bedroom details provided
- Flooring: No flooring information provided
- Bathrooms: 2 full bathrooms
- Heating & cooling: No heating or cooling information provided
- Interior features: No notable interior features listed
- Laundry & utility: No laundry details provided
Neighborhood map
What this means for you Summary
Snapshot
- This is a 3-bed/2.0-bath single-family listed at $55k.
Deal economics
- At list price, monthly cash flow is $495 ($6k/yr) — positive.
- The deal already cash-flows at list — no discount required.
- Meets the 1% rule at list price ($1k rent vs $55k).
- Recommended offer: $53k (3.0% below list) — sets the bar for market timing.
- Cap rate 17.1% vs local median 3.6% in Corpus Christi — top-decile yield for the area; either an underpriced asset or a hidden risk that comps aren't pricing in. Stress-test before assuming the spread holds.
Location & tenants
- Location reads 78/100 on livability (#66 in TX, #2,404 nationally) — a middle-class / working-renter tenant base. Strengths: commute A+, cost of living A+, housing A+; Watch: crime F.
- Corpus Christi ISD (urban): math 31% / reading 35% proficiency, ranked #562 of 826 in TX (top 68%) — families likely to look elsewhere, expect single-tenant / working-renter base with shorter leases; 63% free/reduced lunch — lower-income household profile, screen leases tightly.
- Market conditions: 74 active listings in the ZIP; 17 comparable units currently listed for rent nearby; rentals at typical pace (median 21d on market — plan ~3-4 weeks tenant-placement turnaround); 47% of comp listings sitting > 30 days — soft ceiling on asking rent; lower-income renter base — watch delinquency; 1,397 units permitted in Nueces County in 2024 (47 in 5+ unit buildings).
- This rent runs 36% of the median local income ($38k/yr) — at the standard rent-burdened threshold; future hikes will face affordability resistance.
Forward outlook
- In year one you build about $1k of equity ($380 loan paydown + $781 appreciation (1.4% local appreciation)).
- Nueces County population projected at +36% by 2050 — long-run rental-demand tailwind backs the buy-and-hold thesis.
- At projected returns (1.4% appreciation + 3.0% rent growth), your $15k cash investment doubles in ~3 years — after that, you're playing with house money.
Negotiation context
- It's been on market 42 days — a 3% lower offer ($53k) is reasonable based on typical stale-listing flexibility.
- 4 sale attempts since 4y ago with the ask held roughly flat each time — persistent listings suggest the price (not the market) is what's stuck; bring a comps-based counter.
Risks & watch-outs
- Watch-outs: built in 1947 — expect roof / HVAC / electrical / plumbing capex.
- Climate carrying-cost: severe wind risk, 99% chance of damaging wind over 30y; extreme-heat days projected 7→26/yr by 2055 (HVAC capex compounding) — expect insurance premiums to compound above CPI over the hold.
Questions for the listing agent
- It's been on market 42 days. Have you received any prior offers? Is the seller open to a 3% concession, seller financing, or rate buy-down credit?
- Built in 1947 — when were the roof, HVAC, electrical panel, plumbing, and water heater last replaced?
- Is there a deadline driving the sale (1031 exchange, divorce, estate, relocation)? That informs how much negotiation room exists.
- Crime grade is F in this area — have there been break-ins, vandalism, or insurance claims at this property in the last 3 years? What carrier currently insures it and at what premium?
- What's the average days-on-market for RENTAL listings here right now (not sales)? A rising rental-DOM trend means longer vacancies and softer asking-rent achievability than the comps imply.
- What's the recent tenant-quality profile in this submarket — average credit score on applications, eviction rate, late-payment / NSF rate, and stable-employment percentage? A property-management company in the area should have these aggregated.
- How much new for-sale + rental construction is in the pipeline within 1–3 miles? Heavy new supply typically softens prices + rents 12–24 months out; constrained supply supports both.
Investment metrics
- 1% rule
- 2.08% ✓
- Cap rate
- 17.10%
- Cash-on-cash
- 38.58%
- DSCR
- 2.72
- GRM
- 4.0
CMA / ARV
- ARV (median comp)
- $127,880
- List price
- $55,000
- Delta
- -56.99%
- Verdict
- UNDERPRICED
- Comps
- 20 within 1.0 mi
Show comp detail 12 sales within ~0.75 mi
| Address | Dist | Beds/Ba | Sqft | Sold | Price | $/sf | Match |
|---|---|---|---|---|---|---|---|
| 3306 Elgin St | 0.21mi | 3/1.0 | 901 (-6%) | 4mo | $133,500 | $148 | 74 |
| 2530 Dunbar St | 0.41mi | 3/2.0 | 992 (+4%) | 2mo | $79,900 | $81 | 72 |
| 3037 Macarthur St | 0.42mi | 2/1.0 (-1) | 960 (+1%) | 0mo | $50,000 | $52 | 70 |
| 2639 Soledad St | 0.23mi | 3/1.0 | 952 (-0%) | 20mo | $76,000 | $80 | 68 |
| 3033 Elgin St | 0.18mi | 3/1.0 | 1,058 (+11%) | 5mo | $149,900 | $142 | 65 |
| 3650 Braniff St | 0.51mi | 3/1.0 | 986 (+3%) | 2mo | $69,900 | $71 | 65 |
| 2921 Sabinas St | 0.29mi | 2/1.0 (-1) | 1,044 (+9%) | 2mo | $69,999 | $67 | 60 |
| 2225 Presa St | 0.51mi | 2/1.0 (-1) | 924 (-3%) | 8mo | $53,500 | $58 | 55 |
| 2742 Guadalupe | 0.09mi | 2/1.0 (-1) | 867 (-9%) | 20mo | $135,000 | $156 | 54 |
| 2838 Greenwood Dr | 0.43mi | 2/2.0 (-1) | 1,058 (+11%) | 3mo | $158,000 | $149 | 54 |
| 3073 Reyna St | 0.63mi | 3/2.0 | 1,036 (+9%) | 8mo | $110,000 | $106 | 49 |
| 2745 Ada St | 0.24mi | 3/1.0 | 1,097 (+15%) | 16mo | $149,000 | $136 | 46 |
Match score weights: distance 35% · size 25% · config 20% · recency 20%. Top-matched comps best support the ARV.
Projected returns pro-forma
1.42% appreciation · 3.0% rent growth · sell at horizon
- IRR
- 41.8%
- Equity multiple
- 3.19×
- Total profit
- $33,741
- Equity at exit
- $19,990
- IRR
- 43.3%
- Equity multiple
- 6.32×
- Total profit
- $81,887
- Equity at exit
- $27,530
Cash invested: $15,400 (down + closing). Projections, not guarantees.
Landlord ↔ Tenant lean methodology
- Overall (STATE)
- 87 Strongly Landlord-Friendly
- State Texas
- 87 Strongly Landlord-Friendly · R+5
- County
- — inherits STATE
- City
- — inherits STATE
ZIP-level market 78405
- Home prices YoY
- 1.3%
- Active inventory
- 74
- Price-to-rent
- 4.0×
Monthly cashflow live
- Estimated rent
- $1,143 high interval (Pro) →
- Mortgage (P&I)
- −$288
- Tax from tax record
- −$97 /mo · $1,161/yr
- Insurance
- −$23
- HOA
- −$0
- Vacancy / Maint / Mgmt
- −$240
- Net cashflow
- $495
Break-even live
UW: 25.0% down · 7.5% · 30yr · 1.5% tax · 5.0% vac · 8.0% maint · 8.0% mgmt
Financing live
Cash to close
- Down payment
- $13,750
- Closing costs
- $1,650
- Reserves months
- —
- Total cash needed
- —
Loan-product check · same deal, 3 products live
Conventional
25% down · 7.5% · 30yr
- Down + closing
- —
- Monthly P&I
- —
- Monthly cashflow
- —
- DSCR
- —
- Eligible?
- —
Personal DTI + credit; lowest rate.
DSCR
20% down · 8.5% · 30yr
- Down + closing
- —
- Monthly P&I
- —
- Monthly cashflow
- —
- DSCR
- —
- Eligible?
- —
No personal income docs; deal must DSCR.
Hard money
10% down · 12.0% · 12mo
- Down + closing
- —
- Monthly P&I
- —
- Monthly cashflow
- —
- DSCR
- —
- Eligible?
- —
Short-term bridge; refi at stabilization.
Rent comps 17 comps
| Address | Beds | Baths | Sqft | Rent | $/sqft | DOM | Units | Dist |
|---|---|---|---|---|---|---|---|---|
| 3150 Elgin St Corpus Christi, TX | 2.0 | 1.0 | 616 | $925 | $1.50 | 43d | 1 | 0.13mi |
| 2522 Cleo St Corpus Christi, TX | 3.0 | 1.0 | 992 | $1,350 | $1.36 | 13d | 1 | 0.81mi |
| 2402 Segrest St Corpus Christi, TX | 2.0 | 1.0 | 1120 | $825 | $0.74 | 21d | 1 | 0.89mi |
| 1114 25th St Corpus Christi, TX | 1.0–2.0 | 1.0 | 712 | $1,050 | $1.47 | 13d | 6 | 1.04mi |
| 2937 Ruth St Corpus Christi, TX | 2.0 | 1.0 | 676 | $950 | $1.41 | 43d | 1 | 1.05mi |
| 2333 Riggan St Corpus Christi, TX | 2.0 | 1.0 | 856 | $1,250 | $1.46 | 43d | 1 | 1.11mi |
| 2106 Harvard St Corpus Christi, TX | 3.0 | 1.0 | 912 | $1,225 | $1.34 | 43d | 1 | 1.16mi |
| 2122 Harvard St Corpus Christi, TX | 2.0 | 1.0 | 858 | $1,250 | $1.46 | 13d | 1 | 1.19mi |
| 1525 S 19th St Unit B Corpus Christi, TX | 3.0 | 2.0 | 1062 | $2,100 | $1.98 | 13d | 1 | 1.20mi |
| 3115 Agnes St Corpus Christi, TX | 2.0 | 1.0 | 428 | $828 | $1.93 | 43d | 3 | 1.27mi |
| 200 Clemmer St Unit A Corpus Christi, TX | 3.0 | 1.0 | 950 | $1,199 | $1.26 | 43d | 1 | 1.30mi |
| 1628 18th St Corpus Christi, TX | 2.0 | 1.0 | 1112 | $1,000 | $0.90 | 43d | 1 | 1.33mi |
| 4326 Vestal St Corpus Christi, TX | 3.0 | 1.0 | 984 | $1,125 | $1.14 | 13d | 1 | 1.33mi |
| 1458 W Point Rd Corpus Christi, TX | 2.0–3.0 | 1.0 | 777 | $980 | $1.26 | 13d | 2 | 1.36mi |
| 1802 Morgan Ave Unit 1802 Corpus Christi, TX | 2.0 | 1.0 | 850 | $1,250 | $1.47 | 21d | 1 | 1.41mi |
| 1201 York Ave Corpus Christi, TX | 3.0 | 1.0 | 888 | $1,550 | $1.75 | 21d | 1 | 1.46mi |
| 4313 Molina Dr Corpus Christi, TX | 2.0 | 1.0 | 904 | $1,250 | $1.38 | 43d | 1 | 1.50mi |
Listing history 28 events
-
2026-06-18days on market $55,000 Active 42 DOM
-
2026-06-17days on market $55,000 Active 41 DOM
-
2026-06-16days on market $55,000 Active 40 DOM
-
2026-06-15days on market $55,000 Active 39 DOM
-
2026-06-14days on market $55,000 Active 37 DOM
-
2026-06-10days on market $55,000 Active 34 DOM
-
2026-06-09days on market $55,000 Active 33 DOM
-
2026-06-08days on market $55,000 Active 32 DOM
-
2026-06-07days on market $55,000 Active 31 DOM
-
2026-06-05days on market $55,000 Active 28 DOM
-
2026-06-03days on market $55,000 Active 27 DOM
-
2026-06-02days on market $55,000 Active 26 DOM
-
2026-06-01days on market $55,000 Active 25 DOM
-
2026-05-31days on market $55,000 Active 24 DOM
-
2026-05-30days on market $55,000 Active 23 DOM
-
2026-05-06$55,000 Active 402-char remark
-
2026-03-08price $62,500
-
2026-01-31$65,000 Active
-
2026-01-26historical
-
2026-01-12price $65,000
-
2025-11-08$75,000 Active
-
2022-05-24historical
Show marketing remark (55 chars)
Great investment property! 2bed/1 bath/ 2 living areas.
-
2022-05-23soldstatus
-
2022-05-20soldstatus Closed
Show marketing remark (55 chars)
Great investment property! 2bed/1 bath/ 2 living areas.
-
2022-05-06status Pending
Show marketing remark (55 chars)
Great investment property! 2bed/1 bath/ 2 living areas.
-
2022-04-28historical Active Under Contract
Show marketing remark (55 chars)
Great investment property! 2bed/1 bath/ 2 living areas.
-
2022-04-21$50,000 Active
Show marketing remark (55 chars)
Great investment property! 2bed/1 bath/ 2 living areas.
-
2021-12-16soldstatus
ⓘ Source: listings_history table (triggers on properties + properties_extension) + one-shot
backfill from property_details.listing_events for pre-trigger history.
Tax reassessment forecast TX · Resets to sale price
- Current annual tax
- $1,161 · $97/mo
- Projected year-2 tax
- $1,161 · $97/mo
- Expected delta
- $0/yr ($0/mo · 0.0%)
ⓘ Screening estimate from a state-policy table — verify with the county assessor before closing.
Climate risk First Street
- Flood 4/10 Moderate FEMA zone X (unshaded) · 20% chance over 30 yrs
- Wildfire 1/10 Low
- Heat 10/10 Extreme 7 d/yr ≥107°F today · 26 d/yr by 30 yrs out
- Wind 9/10 Extreme 99% chance of damaging wind over 30 yrs
- Air quality 1/10 Low 0 unhealthy d/yr today · 0 by 30 yrs out
Nearby sold comps map
Loading sold comps map…
Walkable amenities ~0.75 mi
Loading nearby amenities…
Taxation est. · year 1
- Rental income
- $13,720
- − Mortgage interest
- −$3,081
- − Property taxes
- −$1,161
- − Insurance
- −$275
- − Repairs & maintenance
- −$1,098
- − Management
- −$1,098
- − Depreciation
- −$1,600
- Taxable income
- $5,408
- Est. tax owed @ 24.0%
- −$1,298
- After-tax cash flow
- $4,644/yr
For passive investors: Depreciation is non-cash, so a rental often shows a tax loss while cash-flowing — sheltering income. Rental losses are passive: they offset passive income freely, and up to $25,000/yr can offset ordinary (W-2) income if you actively participate and your MAGI is under $100k (phasing out to $0 by $150k); unused losses carry forward. On sale, claimed depreciation is recaptured at up to 25%, and gains may owe capital-gains tax (a 1031 exchange can defer both). Figures are a year-1 estimate at your 24.0% rate — not tax advice; consult a CPA.
Schools (NCES district)
- District
- Corpus Christi ISD
- NCES district ID
- 4815270
- Math proficiency
- 31% ▼ -18.00%
- Reading proficiency
- 35% ▼ -7.00%
- Median HH income
- $45,672
- Composite
- 28.27/100
- National rank
- #6793
- State rank
- #562 of 826 in TX
Livability — Corpus Christi
- Score
- 78/100
- State rank
- #66
- US rank
- #2404
Category grades
Schools grade is shown separately in the Schools card above.
Census & demographics
- Census place
- Corpus Christi, TX
- County
- Nueces County · 296,836 people
- City population
- 296,836
- Metro
- Corpus Christi, TX
- Population (ZIP)
- 14,602
- Household income
- $38,294
- Rent vs Own
- Severe rent burden
- 867.0
Population outlook (Nueces County) Hauer SSP2
- Today (2025)
- 418,037 people
- By 2030
- 447,123 · +7.0%
- By 2040
- 505,911 · +21.0%
- By 2050
- 567,522 · +35.8%
- By 2075
- 729,686 · +74.6%
- By 2100
- 847,087 · +102.6%
Race, ethnicity, and origin ACS 2023
- Neighborhood character
- Predominantly Hispanic (91%)
- Race & ethnicity
- Hispanic / Latino 91% Two or more races 48% Black 4% White 4%
- Hispanic origin (detail)
- Mexican 83%
- Foreign-born
- 18% · Canada
- Languages at home
- 52% English-only · Spanish 48%
Political lean MEDSL · Nueces
- 2024 margin
- R (+11.5) · D 43.8% · R 55.3%
- 2008→2024 swing
- -7.1pp toward R · 2008: -4.4pp · 2024: -11.5pp
- All cycles
- 2024: R+11.5 2020: R+2.9 2016: R+1.5 2012: R+3.2 2008: R+4.4
Not yet ingested
- Civics
- —
Market trends
- HPI YoY
- ▲ 1.42%
- Current HPI
- 113.2227
- Rent YoY
- —
- Metro
- Corpus Christi, TX
- State GDP YoY
- ▲ 3.95%
- F500 in state
- 110
Industry mix (Fortune 500 HQ in TX)
| Industry | F500 HQs | Revenue |
|---|---|---|
| Energy | 16 | $1,198B |
|
||
| Technology | 5 | $198B |
|
||
| Engineering / Construction | 4 | $72B |
|
||
| Energy Services | 3 | $60B |
|
||
| Utilities | 3 | $41B |
|
||
| Healthcare | 2 | $330B |
|
||
Price history
+10.0% since first listed13 events — show timeline
- 2026-05-06 Listed $55,000 CBMLS
- 2026-03-08 Price Changed $62,500 CBMLS
- 2026-01-31 Listed $65,000 CBMLS
- 2026-01-26 Delisted — CBMLS
- 2026-01-12 Price Changed $65,000 CBMLS
- 2025-11-08 Listed $75,000 CBMLS
- 2022-05-24 Delisted — CBMLS
- 2022-05-23 Sold (Public Records) — Public Records
- 2022-05-20 Sold (MLS) — CBMLS
- 2022-05-06 Pending — CBMLS
- 2022-04-28 Contingent — CBMLS
- 2022-04-21 Listed $50,000 CBMLS
- 2021-12-16 Sold (Public Records) — Public Records
Property tax history
+1.4%/yrLatest (2025): $1,161 · -41.1% YoY. Source: county tax records.
Cash-flow waterfall
monthlySold comps — $/sqft
last 12 mo · ≤1 miLoading sold comps…