 Triplex
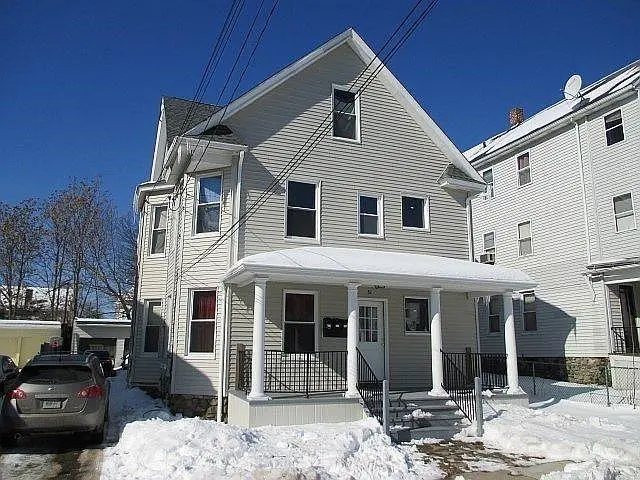
51 Edson Ave · Waterbury, CT
Flood risk 1/10 · Minimal
- FEMA flood zone
- X (unshaded)
- Chance of flooding over 30 yrs
- 0.0%
- Est. flood insurance / yr
- $473 – $860
Fire risk 3/10 · Minor
- Est. fire insurance / yr
- $829 – $1,539
Heat risk 5/10 · Moderate
- Hot days now (above 96°F)
- 7 days/yr
- Hot days in 30 yrs
- 15 days/yr
Wind risk 6/10 · Moderate
- Chance of severe wind over 30 yrs
- 27.0%
Air-quality risk 3/10 · Minor
- Unhealthy air days now
- 2 days/yr
- Unhealthy air days in 30 yrs
- 3 days/yr
Risk factors via First Street. Map © Google.
Why this score? — see what drove the D+ grade
The composite is a weighted blend of 9 inputs, each scored 0–100. Each bar is that input's sub-score; the figure is the points it added to the 100-point composite (weight × sub-score).
- Cash flow +19.2/30.0
- 1% rule +6.2/10.0
- DSCR +6.0/10.0
- Livability +4.0/5.0
- Rent growth +3.3/5.0
- Condition / age +2.5/5.0
- ARV discount +2.4/15.0
- Schools +1.5/10.0
- Appreciation +0.0/10.0
$450,000
🖨 Deal sheet (PDF) 📄 Offer letter ✓ Due diligence
Multi-family units
County records classify this as Multi-Family (2-4 Unit). Listing-text estimate: 3 units. confirmed
Listing remarks MLS
3 FAMILY IN THE EAST END OF WATREBURY. FULLY RENTED WITH LONG TERM TENANTS AND ONE UNIT VACANT. ALL SEPERATE UTILITIES. 4 CAR GARAGE FULLY RENTED AT $475 PER MONTH. GENEROUS SIZED ROOMS OFFER ABUNDANT LIVING SPACE. TENANTS ARE VERY HAPPY THERE. CLOSE TO SHOPPING. RESTAURANTS AND A PARK. ALSO CLOSE TO HIGHWAYS. HOUSE WAS TOTALY RENOVATERD WITHIN THE LAST 10 YEARS. FAIRLY NEW ROOF AND NEW WINDOWS. EXCELLENT INVESTMENT PROPERTY. .
Key facts
- 4 garage spots
- Built 1915
- Listed 149 days
Neighborhood map
What this means for you Summary
Snapshot
- This is a 3 × 3-bed/1.0-bath units multifamily listed at $450k.
Deal economics
- At list price, monthly cash flow is $483 ($6k/yr) — positive. Per door: $161/mo.
- The deal already cash-flows at list — no discount required.
- Meets the 1% rule at list price ($5k rent vs $450k).
- Recommended offer: $396k (12.0% below list) — sets the bar for market timing.
- Cap rate 7.6% vs local median 3.5% in Waterbury — top-decile yield for the area; either an underpriced asset or a hidden risk that comps aren't pricing in. Stress-test before assuming the spread holds.
Location & tenants
- Location reads 79/100 on livability (#32 in CT, #2,205 nationally) — a middle-class / working-renter tenant base. Strengths: commute A+, cost of living A+, housing A+; Watch: crime D, employment D.
- Waterbury School District (suburban): math 12% / reading 23% proficiency, ranked #148 of 153 in CT (top 97%) — low school quality limits family demand, transient renter base, plan for 1-2y turnover; 73% free/reduced lunch — lower-income household profile, screen leases tightly.
- Zoned schools: H. S. Chase School (math 15% / reading 21%, grade F, #456 of 553 statewide, top 83%, 629 students, 73% FRL); Michael F. Wallace Middle School (math 13% / reading 28%, grade F, #160 of 175 statewide, top 91%, 1,062 students, 86% FRL); Crosby High School (math 2% / reading 17%, grade F, #187 of 194 statewide, top 96%, 1,400 students, 84% FRL).
- Market conditions: Rents rising (+3.4%/yr); 82 active listings in the ZIP; 1 comparable units currently listed for rent nearby; 502 units permitted in Naugatuck Valley Planning Region in 2024 (171 in 5+ unit buildings).
- At $5,040/mo this rent would consume 112% of the median local household income ($54k/yr) (locally 1690% of renters already pay >50% of income on rent) — very limited rent-growth headroom before tenants either downsize or default.
Forward outlook
- Local home prices are declining (-3.0%/yr); year-one equity from $3k of loan paydown is wiped out by about $14k of value loss. Plan a longer hold.
Negotiation context
- It's been on market 149 days — a 12% lower offer ($396k) is reasonable based on typical stale-listing flexibility.
- 9 sale attempts since 6y ago with the ask held roughly flat each time — persistent listings suggest the price (not the market) is what's stuck; bring a comps-based counter.
- Current owner paid $250k; list at $450k implies a 80% gain — meaningful room to come down on a strong offer.
Risks & watch-outs
- Watch-outs: property tax is 2.5% of price; built in 1915 — expect roof / HVAC / electrical / plumbing capex.
- Climate carrying-cost: major wind risk, 27% chance of damaging wind over 30y; extreme-heat days projected 7→15/yr by 2055 (HVAC capex compounding) — expect insurance premiums to compound above CPI over the hold.
Questions for the listing agent
- It's been on market 149 days. Have you received any prior offers? Is the seller open to a 12% concession, seller financing, or rate buy-down credit?
- Can we see the unit-by-unit rent roll, current vacancy, and any below-market leases? What's the average tenancy length?
- What capital expenditures (roof, boiler, parking lot, exteriors) have been made in the last 5 years, and what's planned in the next 2?
- Built in 1915 — when were the roof, HVAC, electrical panel, plumbing, and water heater last replaced?
- Property tax is high relative to price — has the assessment been appealed recently, and will the sale trigger a re-assessment?
- Why hasn't it sold? Are there any deal-killer items the seller is aware of (foundation, flood, title, zoning, code violations)?
- Is there a deadline driving the sale (1031 exchange, divorce, estate, relocation)? That informs how much negotiation room exists.
- Schools are D-rated, which usually means shorter tenancies and higher turnover. Who's the typical renter profile here, and what's been the actual vacancy rate?
- Crime grade is D in this area — have there been break-ins, vandalism, or insurance claims at this property in the last 3 years? What carrier currently insures it and at what premium?
- The area grade is low — what's the realistic commute time and amenity access for the typical tenant pool here? Any planned neighborhood developments (good or bad) we should know about?
- What's the average days-on-market for RENTAL listings here right now (not sales)? A rising rental-DOM trend means longer vacancies and softer asking-rent achievability than the comps imply.
- What's the recent tenant-quality profile in this submarket — average credit score on applications, eviction rate, late-payment / NSF rate, and stable-employment percentage? A property-management company in the area should have these aggregated.
- How much new apartment / multifamily construction is in the pipeline within 1–3 miles? Heavy new supply (>2% of stock underway) typically softens rents 12–24 months out; light construction supports rent growth.
Investment metrics
- 1% rule
- 1.12% ✓
- Cap rate
- 7.58%
- Cash-on-cash
- 4.60%
- DSCR
- 1.20
- GRM
- 7.4
CMA / ARV
- ARV (median comp)
- $404,280
- List price
- $450,000
- Delta
- 11.31%
- Verdict
- OVERPRICED
- Comps
- 20 within 1.0 mi
Show comp detail 10 sales within ~0.75 mi
| Address | Dist | Beds/Ba | Sqft | Sold | Price | $/sf | Match |
|---|---|---|---|---|---|---|---|
| 31 Eastwood Ave | 0.11mi | 6/3.0 | 2,952 (+2%) | 3mo | $465,000 | $158 | 90 |
| 37 Eastwood Ave | 0.10mi | 6/3.0 | 3,057 (+5%) | 9mo | $350,000 | $114 | 79 |
| 68 Englewood Ave | 0.21mi | 6/3.0 | 3,024 (+4%) | 7mo | $420,000 | $139 | 77 |
| 68 Meriden Rd | 0.16mi | 6/3.0 | 3,150 (+8%) | 13mo | $310,000 | $98 | 68 |
| 22 Knoll St | 0.21mi | 6/3.0 | 3,241 (+12%) | 4mo | $515,000 | $159 | 67 |
| 225 Meriden Rd | 0.28mi | 5/2.0 (-1) | 2,686 (-8%) | 2mo | $380,000 | $141 | 64 |
| 18 Eastwood Ave | 0.13mi | 6/3.0 | 2,616 (-10%) | 18mo | $415,000 | $159 | 62 |
| 14 Niagara St | 0.38mi | 6/3.0 | 3,156 (+8%) | 18mo | $390,000 | $124 | 53 |
| 91 Alma St | 0.17mi | 7/— (+1) | 3,198 (+10%) | 23mo | $415,000 | $130 | 51 |
| 24 Cedar Ave | 0.72mi | 6/3.5 | 3,060 (+5%) | 20mo | $420,000 | $137 | 39 |
Match score weights: distance 35% · size 25% · config 20% · recency 20%. Top-matched comps best support the ARV.
Projected returns pro-forma
-3.0% appreciation · 3.37% rent growth · sell at horizon
- IRR
- -8.6%
- Equity multiple
- 0.68×
- Total profit
- $-39,974
- Equity at exit
- $67,096
- IRR
- 1.5%
- Equity multiple
- 1.11×
- Total profit
- $13,848
- Equity at exit
- $38,908
Cash invested: $126,000 (down + closing). Projections, not guarantees.
Landlord ↔ Tenant lean methodology
- Overall (STATE)
- 27 Tenant-Leaning
- State Connecticut
- 27 Tenant-Leaning · D+7
- County
- — inherits STATE
- City
- — inherits STATE
ZIP-level market 06705
- Home prices YoY
- -11.0%
- Rents YoY
- 3.4%
- Active inventory
- 82
- Price-to-rent
- 22.3×
Monthly cashflow live
- Estimated rent
- $5,040 high interval (Pro) →
- Mortgage (P&I)
- −$2,360
- Tax from tax record
- −$952 /mo · $11,418/yr
- Insurance
- −$188
- HOA
- −$0
- Vacancy / Maint / Mgmt
- −$1,058
- Net cashflow
- $483
Break-even live
Sensitivity live
| Price | -10% $737 | -5% $610 | +0% $483 | +5% $355 | +10% $228 |
|---|---|---|---|---|---|
| Rent | -10% $85 | -5% $284 | +0% $483 | +5% $682 | +10% $881 |
| Rate | -1.0pp $709 | -0.5pp $597 | base $483 | +0.5pp $366 | +1.0pp $248 |
3-unit breakdown (identical units grouped — click to expand)
| Units | Beds | Baths | Est. rent |
|---|---|---|---|
| 3× units | 3 | 1 | $5,040 |
| #1 | 3 | 1 | $1,680 |
| #2 | 3 | 1 | $1,680 |
| #3 | 3 | 1 | $1,680 |
| Total (3 units) | $5,040 | ||
UW: 25.0% down · 7.5% · 30yr · 1.5% tax · 5.0% vac · 8.0% maint · 8.0% mgmt
Financing live
Cash to close
- Down payment
- $112,500
- Closing costs
- $13,500
- Reserves months
- —
- Total cash needed
- —
Loan-product check · same deal, 3 products live
Conventional
25% down · 7.5% · 30yr
- Down + closing
- —
- Monthly P&I
- —
- Monthly cashflow
- —
- DSCR
- —
- Eligible?
- —
Personal DTI + credit; lowest rate.
DSCR
20% down · 8.5% · 30yr
- Down + closing
- —
- Monthly P&I
- —
- Monthly cashflow
- —
- DSCR
- —
- Eligible?
- —
No personal income docs; deal must DSCR.
Hard money
10% down · 12.0% · 12mo
- Down + closing
- —
- Monthly P&I
- —
- Monthly cashflow
- —
- DSCR
- —
- Eligible?
- —
Short-term bridge; refi at stabilization.
Rent comps 1 comps
| Address | Beds | Baths | Sqft | Rent | $/sqft | DOM | Units | Dist |
|---|---|---|---|---|---|---|---|---|
| 14 Niagara St Waterbury, CT | 6.0 | 3.0 | 3156 | $1,700 | $0.54 | 5d | 1 | 0.38mi |
Listing history 42 events
-
2026-06-21days on market $450,000 Active 149 DOM
-
2026-06-18days on market $450,000 Active 146 DOM
-
2026-06-17days on market $450,000 Active 145 DOM
-
2026-06-16days on market $450,000 Active 144 DOM
-
2026-06-15days on market $450,000 Active 143 DOM
-
2026-06-14days on market $450,000 Active 141 DOM
-
2026-06-13days on market $450,000 Active 140 DOM
-
2026-06-10days on market $450,000 Active 138 DOM
-
2026-06-09days on market $450,000 Active 137 DOM
-
2026-06-08days on market $450,000 Active 136 DOM
-
2026-06-07days on market $450,000 Active 135 DOM
-
2026-06-05days on market $450,000 Active 132 DOM
-
2026-06-03days on market $450,000 Active 131 DOM
-
2026-06-03days on market $450,000 Active 130 DOM
-
2026-06-01days on market $450,000 Active 129 DOM
-
2026-05-31days on market $450,000 Active 128 DOM
-
2026-01-19$450,000 Active 431-char remark
Show marketing remark (431 chars)
3 FAMILY IN THE EAST END OF WATREBURY. FULLY RENTED WITH LONG TERM TENANTS AND ONE UNIT VACANT. ALL SEPERATE UTILITIES. 4 CAR GARAGE FULLY RENTED AT $475 PER MONTH. GENEROUS SIZED ROOMS OFFER ABUNDANT LIVING SPACE. TENANTS ARE VERY HAPPY THERE. CLOSE TO SHOPPING. RESTAURANTS AND A PARK. ALSO CLOSE TO HIGHWAYS. HOUSE WAS TOTALY RENOVATERD WITHIN THE LAST 10 YEARS. FAIRLY NEW ROOF AND NEW WINDOWS. EXCELLENT INVESTMENT PROPERTY. .
-
2023-02-01soldstatus $250,000
-
2023-01-30soldstatus $250,000 Closed 410-char remark
Show marketing remark (410 chars)
3 FAMILY IN THE EAST END OF WATREBURY. FULLY RENTED WITH LONG TERM TENANTS. ALL SEPERATE UTILITIES. 4 CAR GARAGE FULLY RENTED AT $400 PER MONTH. GENEROUS SIZED ROOMS OFFER ABUNDANT LIVING SPACE. TENANTS ARE VERY HAPPY THERE. CLOSE TO SHOPPING. RESTAURANTS AND A PARK. ALSO CLOSE TO HIGHWAYS. HOUSE WAS TOTALY RENOVATERD WITHIN THE LAST 10 YEARS. FAIRLY NEW ROOF AND NEW WINDOWS. EXCELLENT INVESTMENT PROPERTY..
-
2023-01-10status Under Contract 410-char remark
Show marketing remark (410 chars)
3 FAMILY IN THE EAST END OF WATREBURY. FULLY RENTED WITH LONG TERM TENANTS. ALL SEPERATE UTILITIES. 4 CAR GARAGE FULLY RENTED AT $400 PER MONTH. GENEROUS SIZED ROOMS OFFER ABUNDANT LIVING SPACE. TENANTS ARE VERY HAPPY THERE. CLOSE TO SHOPPING. RESTAURANTS AND A PARK. ALSO CLOSE TO HIGHWAYS. HOUSE WAS TOTALY RENOVATERD WITHIN THE LAST 10 YEARS. FAIRLY NEW ROOF AND NEW WINDOWS. EXCELLENT INVESTMENT PROPERTY..
-
2022-08-23historical Under Contract - Continue to Show 410-char remark
Show marketing remark (410 chars)
3 FAMILY IN THE EAST END OF WATREBURY. FULLY RENTED WITH LONG TERM TENANTS. ALL SEPERATE UTILITIES. 4 CAR GARAGE FULLY RENTED AT $400 PER MONTH. GENEROUS SIZED ROOMS OFFER ABUNDANT LIVING SPACE. TENANTS ARE VERY HAPPY THERE. CLOSE TO SHOPPING. RESTAURANTS AND A PARK. ALSO CLOSE TO HIGHWAYS. HOUSE WAS TOTALY RENOVATERD WITHIN THE LAST 10 YEARS. FAIRLY NEW ROOF AND NEW WINDOWS. EXCELLENT INVESTMENT PROPERTY..
-
2022-08-10$250,000 Active 410-char remark
Show marketing remark (410 chars)
3 FAMILY IN THE EAST END OF WATREBURY. FULLY RENTED WITH LONG TERM TENANTS. ALL SEPERATE UTILITIES. 4 CAR GARAGE FULLY RENTED AT $400 PER MONTH. GENEROUS SIZED ROOMS OFFER ABUNDANT LIVING SPACE. TENANTS ARE VERY HAPPY THERE. CLOSE TO SHOPPING. RESTAURANTS AND A PARK. ALSO CLOSE TO HIGHWAYS. HOUSE WAS TOTALY RENOVATERD WITHIN THE LAST 10 YEARS. FAIRLY NEW ROOF AND NEW WINDOWS. EXCELLENT INVESTMENT PROPERTY..
-
2022-01-04historical
-
2021-12-13price $250,000
-
2021-11-24status Active
-
2021-11-18historical Under Contract - Continue to Show
-
2021-11-16$260,000 Active
-
2021-11-10historical
-
2021-10-25price $199,000
-
2021-10-07$220,000 Active
-
2021-06-08historical
-
2021-04-27price $199,000
-
2021-03-17$219,900 Active
-
2020-09-16historical
-
2020-07-31historical
-
2020-06-14price $179,900
-
2020-06-05status Active
-
2020-05-30$189,000 Active
-
2020-05-28historical
-
2020-05-22$379,000 Active
-
1988-05-23soldstatus $165,900
-
1987-05-26soldstatus $145,000
ⓘ Source: listings_history table (triggers on properties + properties_extension) + one-shot
backfill from property_details.listing_events for pre-trigger history.
Tax reassessment forecast CT · Partial reset (capped growth)
- Current annual tax
- $11,418 · $952/mo
- Projected year-2 tax
- $11,418 · $952/mo
- Expected delta
- $0/yr ($0/mo · 0.0%)
ⓘ Screening estimate from a state-policy table — verify with the county assessor before closing.
Climate risk First Street
- Flood 1/10 Low FEMA zone X (unshaded) · 0% chance over 30 yrs
- Wildfire 3/10 Moderate
- Heat 5/10 Major 7 d/yr ≥96°F today · 15 d/yr by 30 yrs out
- Wind 6/10 Major 27% chance of damaging wind over 30 yrs
- Air quality 3/10 Moderate 2 unhealthy d/yr today · 3 by 30 yrs out
Nearby sold comps map
Loading sold comps map…
Walkable amenities ~0.75 mi
Loading nearby amenities…
Taxation est. · year 1
- Rental income
- $60,480
- − Mortgage interest
- −$25,207
- − Property taxes
- −$11,418
- − Insurance
- −$2,250
- − Repairs & maintenance
- −$4,838
- − Management
- −$4,838
- − Depreciation
- −$13,091
- Taxable loss
- −$1,163
- Est. tax savings @ 24.0%
- +$279
- After-tax cash flow
- $6,072/yr
For passive investors: Depreciation is non-cash, so a rental often shows a tax loss while cash-flowing — sheltering income. Rental losses are passive: they offset passive income freely, and up to $25,000/yr can offset ordinary (W-2) income if you actively participate and your MAGI is under $100k (phasing out to $0 by $150k); unused losses carry forward. On sale, claimed depreciation is recaptured at up to 25%, and gains may owe capital-gains tax (a 1031 exchange can defer both). Figures are a year-1 estimate at your 24.0% rate — not tax advice; consult a CPA.
Schools (NCES district)
- District
- Waterbury School District
- NCES district ID
- 0904830
- Math proficiency
- 12% ▼ -7.00%
- Reading proficiency
- 23% ▼ -8.00%
- Median HH income
- $40,040
- Composite
- 14.85/100
- National rank
- #9380
- State rank
- #148 of 153 in CT
Livability — Waterbury
- Score
- 79/100
- State rank
- #32
- US rank
- #2205
Category grades
Schools grade is shown separately in the Schools card above.
Census & demographics
- Census place
- Waterbury, CT
- County
- New Haven County · 688,236 people
- City population
- 115,012
- Metro
- New Haven-Milford, CT
- Population (ZIP)
- 25,266
- Household income
- $53,954
- Rent vs Own
- Severe rent burden
- 1690.0
Population outlook (Naugatuck Valley County) Hauer SSP2
- By 2040
- 496,846
Race, ethnicity, and origin ACS 2023
- Neighborhood character
- Highly diverse neighborhood (Simpson 0.71)
- Race & ethnicity
- White 34% Hispanic / Latino 34% Black 22% Two or more races 14% Asian 4%
- Hispanic origin (detail)
- Mexican 2% Puerto Rican 22% Dominican 3%
- Common ancestry
- Lithuanian 6% Hispanic 3% Romanian 2%
- Foreign-born
- 19% · Canada, Jamaica, China
- Languages at home
- 66% English-only · Spanish 22% Other Indo-European 6% French/Haitian/Cajun 3%
Political lean MEDSL · Naugatuck Valley
- 2024 margin
- Lean R (+7.4) · D 45.6% · R 53.0% · Other 1.4%
- All cycles
- 2024: R+7.4
Not yet ingested
- Civics
- —
Market trends
- HPI YoY
- ▼ -37.50%
- Current HPI
- 304.4948
- Rent YoY
- ▲ 3.37%
- Metro
- New Haven-Milford, CT
- State GDP YoY
- ▲ 1.06%
- F500 in state
- 38
Industry mix (Fortune 500 HQ in CT)
| Industry | F500 HQs | Revenue |
|---|---|---|
| Industrial Machinery | 4 | $38B |
|
||
| Insurance | 3 | $71B |
|
||
| Financial Services | 2 | $25B |
|
||
| Transportation / Logistics | 2 | $18B |
|
||
| Healthcare | 1 | $247B |
|
||
| Telecommunications | 1 | $55B |
|
||
Price history
+210.3% since first listed26 events — show timeline
- 2026-01-19 Listed $450,000 Fizber.com
- 2023-02-01 Sold (Public Records) $250,000 Public Records
- 2023-01-30 Sold (MLS) $250,000 Smart MLS
- 2023-01-10 Pending — Smart MLS
- 2022-08-23 Contingent — Smart MLS
- 2022-08-10 Listed $250,000 Smart MLS
- 2022-01-04 Listing Removed — Smart MLS
- 2021-12-13 Price Changed $250,000 Smart MLS
- 2021-11-24 Relisted — Smart MLS
- 2021-11-18 Contingent — Smart MLS
- 2021-11-16 Listed $260,000 Smart MLS
- 2021-11-10 Listing Removed — Smart MLS
- 2021-10-25 Price Changed $199,000 Smart MLS
- 2021-10-07 Listed $220,000 Smart MLS
- 2021-06-08 Listing Removed — Smart MLS
- 2021-04-27 Price Changed $199,000 Smart MLS
- 2021-03-17 Listed $219,900 Smart MLS
- 2020-09-16 Listing Removed — Smart MLS
- 2020-07-31 Listing Removed — Smart MLS
- 2020-06-14 Price Changed $179,900 Smart MLS
- 2020-06-05 Relisted — Smart MLS
- 2020-05-30 Listed $189,000 Smart MLS
- 2020-05-28 Listing Removed — Smart MLS
- 2020-05-22 Listed $379,000 Smart MLS
- 1988-05-23 Sold (Public Records) $165,900 Public Records
- 1987-05-26 Sold (Public Records) $145,000 Public Records
Property tax history
+7.4%/yrLatest (2023): $11,418 · +87.3% YoY. Source: county tax records.
Cash-flow waterfall
monthlySold comps — $/sqft
last 12 mo · ≤1 miLoading sold comps…