3496 Murray Hwy · Hardin, KY
Flood risk 1/10 · Minimal
- FEMA flood zone
- X (unshaded)
- Chance of flooding over 30 yrs
- 0.0%
- Est. flood insurance / yr
- $507 – $1,088
Fire risk 3/10 · Minor
- Est. fire insurance / yr
- $839 – $1,559
Heat risk 6/10 · Moderate
- Hot days now (above 109°F)
- 7 days/yr
- Hot days in 30 yrs
- 20 days/yr
Wind risk 3/10 · Minor
- Chance of severe wind over 30 yrs
- 7.0%
Air-quality risk 1/10 · Minimal
- Unhealthy air days now
- 0 days/yr
- Unhealthy air days in 30 yrs
- 0 days/yr
Risk factors via First Street. Map © Google.
Why this score? — see what drove the C- grade
The composite is a weighted blend of 9 inputs, each scored 0–100. Each bar is that input's sub-score; the figure is the points it added to the 100-point composite (weight × sub-score).
- Cash flow +16.0/30.0
- ARV discount +15.0/15.0
- DSCR +4.9/10.0
- 1% rule +4.4/10.0
- Schools +2.9/10.0
- Livability +2.7/5.0
- Rent growth +2.5/5.0
- Condition / age +2.5/5.0
- Appreciation +0.0/10.0
$87,500
🖨 Deal sheet (PDF) 📄 Offer letter ✓ Due diligence
Listing remarks
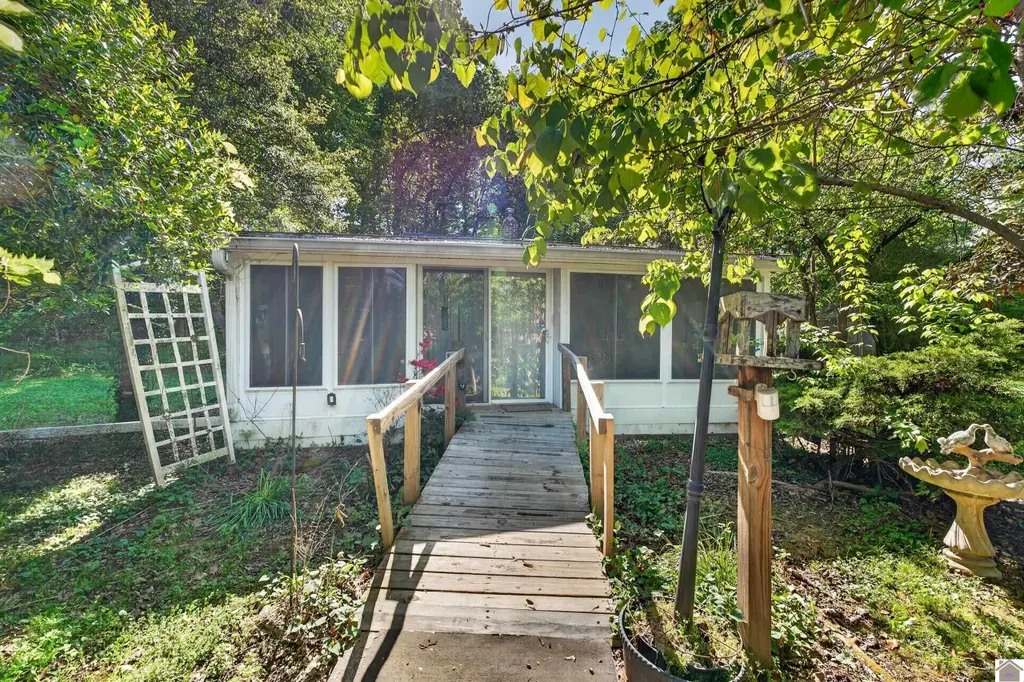
Just minutes from Kentucky Lake, this charming home offers a warm, cottage-style feel the moment you step inside. The heated and cooled four-seasons room is filled with natural light—perfect for morning coffee, relaxing, or showcasing indoor plants. The living room features a natural gas fireplace for cozy heat and a window unit for cooling. The kitchen provides abundant cabinetry, pantry storage, and generous counter space, with microwave and refrigerator included. Two bedrooms are thoughtfully positioned with a spacious laundry room in between, complete with double closets and extra hanging space—ideal for a walk-in closet setup. The bathroom includes a handicap-accessible wal
Key facts
- Four-seasons room
- Covered patio
- Storm shelter
Tags
Property features AI
Exterior
- Parking: Detached, paved carport (2 spaces)
- Utilities: Public water; Public sewer; Natural gas available
- Home design: Single-family residence; 1 story
- Construction: Frame construction with vinyl siding; Shingle and rubber roof; Slab foundation; Built on a 2.02-acre lot
- Exterior features: Covered, screened patio; Outbuilding; Accessible entrance; Level, wooded lot with rolling slope
Interior
- Kitchen: Microwave; Refrigerator; Electric water heater
- Flooring: Carpet; Vinyl
- Bathrooms: 1 full bathroom
- Heating & cooling: Natural gas heating; Window air conditioning units; Ceiling fans
- Interior features: Eat-in kitchen; Pantry; Living room fireplace
- Laundry & utility: Dryer
Neighborhood map
What this means for you Summary
Snapshot
- This is a 2-bed/1.0-bath single-family listed at $88k.
Deal economics
- At list price, monthly cash flow is $43 ($518/yr) — positive.
- The deal already cash-flows at list — no discount required.
- To meet the 1% rule (rent ≥ 1% of price), the offer needs to be $82k (6.3% below list).
- Recommended offer: $82k (6.3% below list) — sets the bar for 1% rule.
Location & tenants
- Location reads 54/100 on livability (#476 in KY) — a working-class tenant base; expect higher turnover. Strengths: cost of living A+, housing A-; Watch: amenities F, commute F, employment F.
- Marshall County (rural): math 29% / reading 38% proficiency, ranked #73 of 165 in KY (top 44%) — families likely to look elsewhere, expect single-tenant / working-renter base with shorter leases.
- Zoned schools: South Marshall Elementary School (math 27% / reading 27%, grade F, #434 of 676 statewide, top 69%, 289 students, 64% FRL); South Marshall Middle (math 21% / reading 39%, grade F, #146 of 217 statewide, top 69%, 462 students, 55% FRL) — zoned schools average 59% FRL vs 43% district-wide (16 pts higher); higher-poverty schools than district average — tighter screening recommended.
- Market conditions: 27 active listings in the ZIP; 121 units permitted in Marshall County in 2024 (5 in 5+ unit buildings).
Forward outlook
- Local home prices are declining (-3.0%/yr); year-one equity from $605 of loan paydown is wiped out by about $3k of value loss. Plan a longer hold.
- Marshall County population projected to shrink 9% by 2050 — rents likely to lag national; underwrite the cash flow, not the appreciation.
Negotiation context
- It's been on market 58 days — a 3% lower offer ($85k) is reasonable based on typical stale-listing flexibility.
Risks & watch-outs
- Climate carrying-cost: extreme-heat days projected 7→20/yr by 2055 (HVAC capex compounding) — expect insurance premiums to compound above CPI over the hold.
Questions for the listing agent
- It's been on market 58 days. Have you received any prior offers? Is the seller open to a 6% concession, seller financing, or rate buy-down credit?
- Built in 1960 — when were the roof, HVAC, electrical panel, plumbing, and water heater last replaced?
- Is there a deadline driving the sale (1031 exchange, divorce, estate, relocation)? That informs how much negotiation room exists.
- Schools are F-rated, which usually means shorter tenancies and higher turnover. Who's the typical renter profile here, and what's been the actual vacancy rate?
- What's the average days-on-market for RENTAL listings here right now (not sales)? A rising rental-DOM trend means longer vacancies and softer asking-rent achievability than the comps imply.
- What's the recent tenant-quality profile in this submarket — average credit score on applications, eviction rate, late-payment / NSF rate, and stable-employment percentage? A property-management company in the area should have these aggregated.
- How much new for-sale + rental construction is in the pipeline within 1–3 miles? Heavy new supply typically softens prices + rents 12–24 months out; constrained supply supports both.
Investment metrics
- 1% rule
- 0.94% ✗
- Cap rate
- 6.88%
- Cash-on-cash
- 2.11%
- DSCR
- 1.09
- GRM
- 8.9
CMA / ARV
- ARV (median comp)
- $116,580
- List price
- $87,500
- Delta
- -24.94%
- Verdict
- UNDERPRICED
- Comps
- 6 within 1.0 mi
Projected returns pro-forma
-3.0% appreciation · 3.0% rent growth · sell at horizon
- IRR
- -12.9%
- Equity multiple
- 0.53×
- Total profit
- $-11,417
- Equity at exit
- $13,047
- IRR
- -3.9%
- Equity multiple
- 0.74×
- Total profit
- $-6,352
- Equity at exit
- $7,565
Cash invested: $24,500 (down + closing). Projections, not guarantees.
Landlord ↔ Tenant lean methodology
- Overall (STATE)
- 83 Strongly Landlord-Friendly
- State Kentucky
- 83 Strongly Landlord-Friendly · R+16
- County
- — inherits STATE
- City
- — inherits STATE
ZIP-level market 42048
- Home prices YoY
- -30.6%
- Active inventory
- 27
- Price-to-rent
- 8.9×
Monthly cashflow live
- Estimated rent
- $820 medium interval (Pro) →
- Mortgage (P&I)
- −$459
- Tax est. 1.5%
- −$109 /mo · $1,312/yr
- Insurance
- −$36
- HOA
- −$0
- Vacancy / Maint / Mgmt
- −$172
- Net cashflow
- $43
Break-even live
Sensitivity live
| Price | -10% $104 | -5% $73 | +0% $43 | +5% $13 | +10% $-17 |
|---|---|---|---|---|---|
| Rent | -10% $-22 | -5% $11 | +0% $43 | +5% $76 | +10% $108 |
| Rate | -1.0pp $87 | -0.5pp $65 | base $43 | +0.5pp $20 | +1.0pp $-3 |
UW: 25.0% down · 7.5% · 30yr · 1.5% tax · 5.0% vac · 8.0% maint · 8.0% mgmt
Financing live
Cash to close
- Down payment
- $21,875
- Closing costs
- $2,625
- Reserves months
- —
- Total cash needed
- —
Loan-product check · same deal, 3 products live
Conventional
25% down · 7.5% · 30yr
- Down + closing
- —
- Monthly P&I
- —
- Monthly cashflow
- —
- DSCR
- —
- Eligible?
- —
Personal DTI + credit; lowest rate.
DSCR
20% down · 8.5% · 30yr
- Down + closing
- —
- Monthly P&I
- —
- Monthly cashflow
- —
- DSCR
- —
- Eligible?
- —
No personal income docs; deal must DSCR.
Hard money
10% down · 12.0% · 12mo
- Down + closing
- —
- Monthly P&I
- —
- Monthly cashflow
- —
- DSCR
- —
- Eligible?
- —
Short-term bridge; refi at stabilization.
Listing history 17 events
-
2026-06-19statusdays on market $87,500 Pending 58 DOM
-
2026-06-18days on market $87,500 Active 57 DOM
-
2026-06-17days on market $87,500 Active 56 DOM
-
2026-06-16days on market $87,500 Active 55 DOM
-
2026-06-15days on market $87,500 Active 54 DOM
-
2026-06-14days on market $87,500 Active 52 DOM
-
2026-06-12days on market $87,500 Active 51 DOM
-
2026-06-09days on market $87,500 Active 48 DOM
-
2026-06-08days on market $87,500 Active 47 DOM
-
2026-06-07days on market $87,500 Active 46 DOM
-
2026-06-03days on market $87,500 Active 42 DOM
-
2026-06-02days on market $87,500 Active 41 DOM
-
2026-06-01days on market $87,500 Active 40 DOM
-
2026-05-31days on market $87,500 Active 39 DOM
-
2026-05-30days on market $87,500 Active 38 DOM
-
2026-05-15price $92,500 1011-char remark
-
2026-04-22$96,250 Active 1011-char remark
ⓘ Source: listings_history table (triggers on properties + properties_extension) + one-shot
backfill from property_details.listing_events for pre-trigger history.
Climate risk First Street
- Flood 1/10 Low FEMA zone X (unshaded) · 0% chance over 30 yrs
- Wildfire 3/10 Moderate
- Heat 6/10 Major 7 d/yr ≥109°F today · 20 d/yr by 30 yrs out
- Wind 3/10 Moderate 7% chance of damaging wind over 30 yrs
- Air quality 1/10 Low 0 unhealthy d/yr today · 0 by 30 yrs out
Nearby sold comps map
Loading sold comps map…
Walkable amenities ~0.75 mi
Loading nearby amenities…
Taxation est. · year 1
- Rental income
- $9,841
- − Mortgage interest
- −$4,901
- − Property taxes
- −$1,312
- − Insurance
- −$438
- − Repairs & maintenance
- −$787
- − Management
- −$787
- − Depreciation
- −$2,545
- Taxable loss
- −$931
- Est. tax savings @ 24.0%
- +$223
- After-tax cash flow
- $741/yr
For passive investors: Depreciation is non-cash, so a rental often shows a tax loss while cash-flowing — sheltering income. Rental losses are passive: they offset passive income freely, and up to $25,000/yr can offset ordinary (W-2) income if you actively participate and your MAGI is under $100k (phasing out to $0 by $150k); unused losses carry forward. On sale, claimed depreciation is recaptured at up to 25%, and gains may owe capital-gains tax (a 1031 exchange can defer both). Figures are a year-1 estimate at your 24.0% rate — not tax advice; consult a CPA.
Schools (NCES district)
- District
- Marshall County
- NCES district ID
- 2103810
- Math proficiency
- 29% ▼ -7.00%
- Reading proficiency
- 38% ▼ -16.00%
- Median HH income
- $45,324
- Composite
- 28.62/100
- National rank
- #6710
- State rank
- #73 of 165 in KY
Livability — Hardin
- Score
- 54/100
- State rank
- #476
- US rank
- #23849
Category grades
Schools grade is shown separately in the Schools card above.
Census & demographics
- Population (ZIP)
- 1,838
Population outlook (Marshall County) Hauer SSP2
- Today (2025)
- 30,647 people
- By 2030
- 30,276 · -1.2%
- By 2040
- 29,232 · -4.6%
- By 2050
- 27,940 · -8.8%
- By 2075
- 25,289 · -17.5%
- By 2100
- 21,188 · -30.9%
Race, ethnicity, and origin ACS 2023
- Neighborhood character
- Predominantly White (99%)
- Race & ethnicity
- White 99%
- Common ancestry
- Serbian 4% Lithuanian 1% Italian 1%
- Foreign-born
- 1%
- Languages at home
- 99% English-only · German/W. Germanic 1%
Political lean MEDSL · Marshall
- 2024 margin
- Solid R (+56.7) · D 21.0% · R 77.7% · Other 1.3%
- 2008→2024 swing
- -32.0pp toward R · 2008: -24.7pp · 2024: -56.7pp
- All cycles
- 2024: R+56.7 2020: R+52.4 2016: R+51.9 2012: R+34.2 2008: R+24.7
Not yet ingested
- Civics
- —
Market trends
- HPI YoY
- ▼ -53.61%
- Current HPI
- 121.572
- Rent YoY
- —
- Metro
- —
- State GDP YoY
- ▲ 1.81%
- F500 in state
- 4
Industry mix (Fortune 500 HQ in KY)
| Industry | F500 HQs | Revenue |
|---|---|---|
| Healthcare | 1 | $118B |
|
||
| Food / Beverage | 1 | $7B |
|
||
Price history
-9.1% since first listed4 events — show timeline
- 2026-06-19 Pending — WKRMLS
- 2026-05-26 Price Changed $87,500 WKRMLS
- 2026-05-15 Price Changed $92,500 WKRMLS
- 2026-04-22 Listed $96,250 WKRMLS
Property tax history
-1.0%/yrLatest (2022): $49 · -1.2% YoY. Source: county tax records.
Cash-flow waterfall
monthlySold comps — $/sqft
last 12 mo · ≤1 miLoading sold comps…