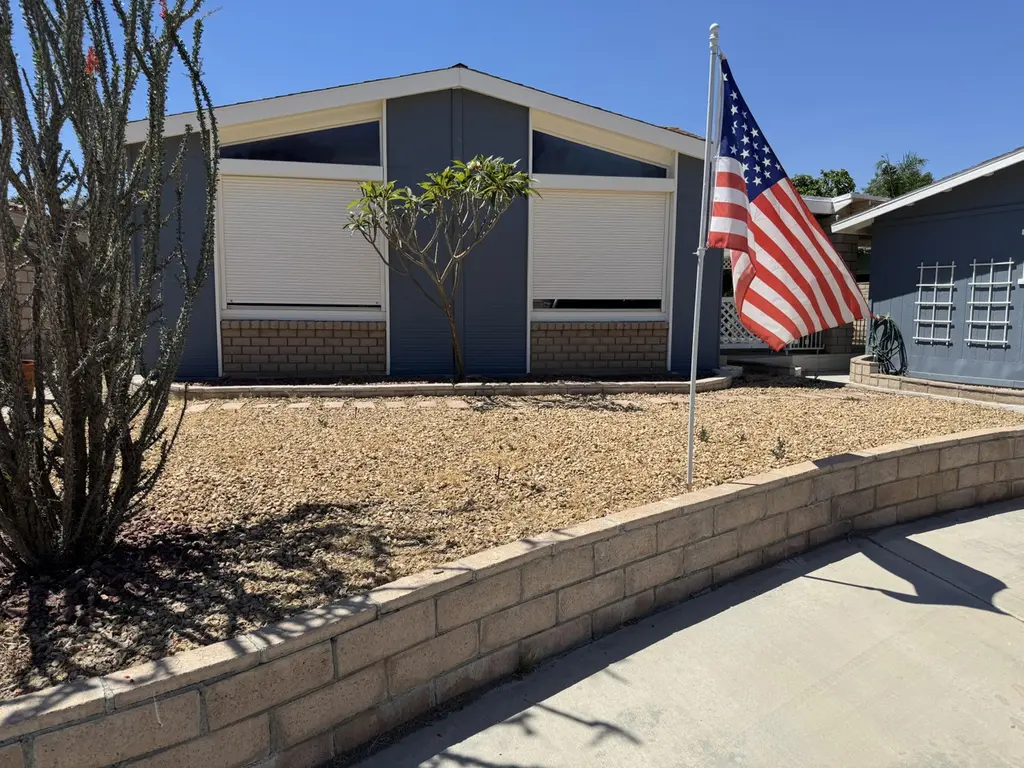
34735 Double Diamond Dr · Thousand Palms, CA
Flood risk 1/10 · Minimal
- FEMA flood zone
- AO
- Chance of flooding over 30 yrs
- 0.0%
- Est. flood insurance / yr
- $848 – $2,087
Fire risk 4/10 · Minor
- Est. fire insurance / yr
- $659 – $1,223
Heat risk 9/10 · Severe
- Hot days now (above 114°F)
- 7 days/yr
- Hot days in 30 yrs
- 19 days/yr
Wind risk 1/10 · Minimal
- Chance of severe wind over 30 yrs
- —
Air-quality risk 4/10 · Minor
- Unhealthy air days now
- 5 days/yr
- Unhealthy air days in 30 yrs
- 7 days/yr
Risk factors via First Street. Map © Google.
Why this score? — see what drove the C grade
The composite is a weighted blend of 9 inputs, each scored 0–100. Each bar is that input's sub-score; the figure is the points it added to the 100-point composite (weight × sub-score).
- Cash flow +19.9/30.0
- ARV discount +15.0/15.0
- 1% rule +6.6/10.0
- DSCR +6.3/10.0
- Schools +2.7/10.0
- Livability +2.7/5.0
- Rent growth +2.5/5.0
- Condition / age +2.5/5.0
- Appreciation +0.0/10.0
$275,000
🖨 Deal sheet 📄 Offer letter ✓ Due diligence
Listing remarks MLS
This 2br 2ba with a den/office home has a view of the golf course from the Large Covered Patio that is great for entertaining. This home has a 413 Permanent Foundation and is ready for financing. Ivey Ranch CC & GC, is a gated, senior community of manufactured homes integrated with a 9 hole golf course, Pro-shop, Driving Range, 4 community pools, 2 community spas, Club House and a Seasonal Restaurant. In Ivey Ranch you own the land.
Key facts
- 5,663 sq ft lot
- 2 garage spots
- Built 1981
Neighborhood map
What this means for you Summary
Snapshot
- This is a 2-bed/2.0-bath manufactured listed at $275k.
Deal economics
- At list price, monthly cash flow is $211 ($3k/yr) — positive.
- The deal already cash-flows at list — no discount required.
- Meets the 1% rule at list price ($3k rent vs $275k).
- Recommended offer: $258k (6.0% below list) — sets the bar for market timing.
- Cap rate 7.7% vs local median 5.2% in Thousand Palms — top-decile yield for the area; either an underpriced asset or a hidden risk that comps aren't pricing in. Stress-test before assuming the spread holds.
Location & tenants
- Location reads 53/100 on livability (#950 in CA) — a working-class tenant base; expect higher turnover. Strengths: housing A+; Watch: cost of living D, schools F, crime F.
- Palm Springs Unified (suburban): math 21% / reading 42% proficiency, ranked #328 of 517 in CA (top 63%) — families likely to look elsewhere, expect single-tenant / working-renter base with shorter leases; 73% free/reduced lunch — lower-income household profile, screen leases tightly.
- Market conditions: 101 active listings in the ZIP; 10 comparable units currently listed for rent nearby; rentals at typical pace (median 15d on market — plan ~3-4 weeks tenant-placement turnaround); 9,195 units permitted in Riverside County in 2024 (1,512 in 5+ unit buildings).
Forward outlook
- Local home prices are declining (-3.0%/yr); year-one equity from $2k of loan paydown is wiped out by about $8k of value loss. Plan a longer hold.
- Riverside County population projected at +22% by 2050 — long-run rental-demand tailwind backs the buy-and-hold thesis.
Negotiation context
- It's been on market 71 days — a 6% lower offer ($258k) is reasonable based on typical stale-listing flexibility.
- 8 sale attempts since 23y ago with the ask held roughly flat each time — persistent listings suggest the price (not the market) is what's stuck; bring a comps-based counter.
- Current owner paid $118k; list at $275k implies a 133% gain — meaningful room to come down on a strong offer.
Risks & watch-outs
- Watch-outs: flood insurance adds $122/mo.
- Climate carrying-cost: in FEMA flood zone AO (mandatory federal flood insurance); extreme-heat days projected 7→19/yr by 2055 (HVAC capex compounding) — expect insurance premiums to compound above CPI over the hold.
Questions for the listing agent
- It's been on market 71 days. Have you received any prior offers? Is the seller open to a 6% concession, seller financing, or rate buy-down credit?
- What's the actual annual flood-insurance premium (NFIP or private), and is the property in a SFHA with mandatory coverage?
- What does the HOA fee cover, when was the last increase, and are there any pending special assessments or reserve-fund shortfalls?
- Why hasn't it sold? Are there any deal-killer items the seller is aware of (foundation, flood, title, zoning, code violations)?
- Is there a deadline driving the sale (1031 exchange, divorce, estate, relocation)? That informs how much negotiation room exists.
- Schools are F-rated, which usually means shorter tenancies and higher turnover. Who's the typical renter profile here, and what's been the actual vacancy rate?
- Crime grade is F in this area — have there been break-ins, vandalism, or insurance claims at this property in the last 3 years? What carrier currently insures it and at what premium?
- What's the average days-on-market for RENTAL listings here right now (not sales)? A rising rental-DOM trend means longer vacancies and softer asking-rent achievability than the comps imply.
- What's the recent tenant-quality profile in this submarket — average credit score on applications, eviction rate, late-payment / NSF rate, and stable-employment percentage? A property-management company in the area should have these aggregated.
- How much new for-sale + rental construction is in the pipeline within 1–3 miles? Heavy new supply typically softens prices + rents 12–24 months out; constrained supply supports both.
Investment metrics
- 1% rule
- 1.16% ✓
- Cap rate
- 7.75%
- Cash-on-cash
- 5.20%
- DSCR
- 1.23
- GRM
- 7.2
CMA / ARV
- ARV (median comp)
- $335,000
- List price
- $275,000
- Delta
- -17.91%
- Verdict
- UNDERPRICED
- Comps
- 20 within 1.0 mi
Show comp detail 12 sales within ~0.75 mi
| Address | Dist | Beds/Ba | Sqft | Sold | Price | $/sf | Match |
|---|---|---|---|---|---|---|---|
| 34766 Double Diamond Dr | 0.03mi | 2/2.0 | 1,940 (+2%) | 9mo | $275,000 | $142 | 88 |
| 34685 Stage Dr | 0.08mi | 2/2.0 | 2,012 (+6%) | 1mo | $340,000 | $169 | 86 |
| 74795 Stage Line Dr | 0.04mi | 2/2.0 | 2,016 (+6%) | 5mo | $228,500 | $113 | 84 |
| 74554 Stage Line Dr | 0.25mi | 2/2.0 | 1,948 (+2%) | 3mo | $383,000 | $197 | 82 |
| 34505 Double Diamond Dr | 0.13mi | 2/2.0 | 1,792 (-6%) | 2mo | $335,000 | $187 | 82 |
| 74825 Stage Line Dr | 0.04mi | 2/2.0 | 2,015 (+6%) | 9mo | $350,000 | $174 | 81 |
| 34774 Stage Dr | 0.13mi | 2/2.0 | 2,024 (+6%) | 6mo | $335,000 | $166 | 79 |
| 34878 Stage Dr | 0.18mi | 2/2.0 | 1,734 (-9%) | 5mo | $285,000 | $164 | 72 |
| 35220 Sand Rock Rd | 0.30mi | 3/2.0 (+1) | 2,015 (+6%) | 2mo | $385,000 | $191 | 70 |
| 35471 Sand Rock Rd | 0.39mi | 2/2.0 | 1,820 (-4%) | 8mo | $355,000 | $195 | 68 |
| 34521 Mesquite Tree Dr | 0.17mi | 2/2.0 | 1,620 (-15%) | 3mo | $387,500 | $239 | 64 |
| 35050 Serenade | 0.22mi | 2/2.0 | 1,632 (-14%) | 10mo | $340,000 | $208 | 57 |
Match score weights: distance 35% · size 25% · config 20% · recency 20%. Top-matched comps best support the ARV.
Projected returns pro-forma
-3.0% appreciation · 3.0% rent growth · sell at horizon
- IRR
- -11.0%
- Equity multiple
- 0.60×
- Total profit
- $-30,788
- Equity at exit
- $41,003
- IRR
- -1.6%
- Equity multiple
- 0.89×
- Total profit
- $-8,230
- Equity at exit
- $23,777
Cash invested: $77,000 (down + closing). Projections, not guarantees.
Landlord ↔ Tenant lean methodology
- Overall (STATE)
- 18 Strongly Tenant-Friendly
- State California
- 18 Strongly Tenant-Friendly · D+13
- County
- — inherits STATE
- City
- — inherits STATE
ZIP-level market 92276
- Home prices YoY
- -10.9%
- Active inventory
- 101
- Price-to-rent
- 7.2×
Monthly cashflow live
- Estimated rent
- $3,200 high interval (Pro) →
- Mortgage (P&I)
- −$1,442
- Tax from tax record
- −$183 /mo · $2,192/yr
- Insurance
- −$115
- Flood insurance flood zone
- −$122 /mo · $1,468/yr
- HOA
- −$455
- Vacancy / Maint / Mgmt
- −$672
- Net cashflow
- $211
Break-even live
UW: 25.0% down · 7.5% · 30yr · 1.5% tax · 5.0% vac · 8.0% maint · 8.0% mgmt
Financing live
Cash to close
- Down payment
- $68,750
- Closing costs
- $8,250
- Reserves months
- —
- Total cash needed
- —
Loan-product check · same deal, 3 products live
Conventional
25% down · 7.5% · 30yr
- Down + closing
- —
- Monthly P&I
- —
- Monthly cashflow
- —
- DSCR
- —
- Eligible?
- —
Personal DTI + credit; lowest rate.
DSCR
20% down · 8.5% · 30yr
- Down + closing
- —
- Monthly P&I
- —
- Monthly cashflow
- —
- DSCR
- —
- Eligible?
- —
No personal income docs; deal must DSCR.
Hard money
10% down · 12.0% · 12mo
- Down + closing
- —
- Monthly P&I
- —
- Monthly cashflow
- —
- DSCR
- —
- Eligible?
- —
Short-term bridge; refi at stabilization.
Rent comps 10 comps
| Address | Beds | Baths | Sqft | Rent | $/sqft | DOM | Units | Dist |
|---|---|---|---|---|---|---|---|---|
| 74478 Millennia Way Palm Desert, CA | 2.0 | 2.0 | 1652 | $3,200 | $1.94 | 5d | 1 | 0.71mi |
| 74699 Technology Dr Palm Desert, CA | 3.0 | 1.0–3.0 | 1057 | $3,378 | $3.19 | 2d | 25 | 0.77mi |
| 74198 Storke Dr Palm Desert, CA | 3.0 | 2.5 | 2000 | $3,400 | $1.70 | 8d | 1 | 0.96mi |
| 74189 Storke Dr Palm Desert, CA | 3.0 | 3.0 | 1650 | $2,995 | $1.82 | 20d | 1 | 0.98mi |
| 74356 Nichols Dr Palm Desert, CA | 3.0 | 2.0 | 1992 | $3,600 | $1.81 | 44d | 1 | 1.00mi |
| 76273 Cornell Way Palm Desert, CA | 3.0 | 2.5 | 1878 | $3,200 | $1.70 | 14d | 1 | 1.21mi |
| 41515 Stanford Rd Palm Desert, CA | 3.0 | 3.0 | 1725 | $2,895 | $1.68 | 24d | 1 | 1.24mi |
| 73528 Cierra St Palm Desert, CA | 3.0 | 2.0 | 1547 | $2,995 | $1.94 | 15d | 1 | 1.46mi |
| 35515 Bains Ave Palm Desert, CA | 3.0 | 2.5 | 1705 | $3,399 | $1.99 | 44d | 1 | 1.47mi |
| 37600 College Dr Palm Desert, CA | 1.0–3.0 | 1.0–2.5 | 1195 | $2,458 | $2.06 | 2d | 21 | 1.50mi |
HOA detail
- Monthly dues
- $455 · $5,460/yr
- Likely covers
- poolsecurity
Listing history 36 events
-
2026-06-18days on market $275,000 Active 71 DOM
-
2026-06-17days on market $275,000 Active 70 DOM
-
2026-06-16days on market $275,000 Active 69 DOM
-
2026-06-15days on market $275,000 Active 68 DOM
-
2026-06-13days on market $275,000 Active 66 DOM
-
2026-06-13days on market $275,000 Active 65 DOM
-
2026-06-09days on market $275,000 Active 62 DOM
-
2026-06-08days on market $275,000 Active 61 DOM
-
2026-06-07days on market $275,000 Active 60 DOM
-
2026-06-04days on market $275,000 Active 57 DOM
-
2026-06-03days on market $275,000 Active 56 DOM
-
2026-06-02days on market $275,000 Active 55 DOM
-
2026-06-01days on market $275,000 Active 54 DOM
-
2026-05-31days on market $275,000 Active 53 DOM
-
2026-04-18status Active 443-char remark
Show marketing remark (443 chars)
This 2br 2ba with a den/office home has a view of the golf course from the Large Covered Patio that is great for entertaining. This home has a 413 Permanent Foundation and is ready for financing. Ivey Ranch CC & GC, is a gated, senior community of manufactured homes integrated with a 9 hole golf course, Pro-shop, Driving Range, 4 community pools, 2 community spas, Club House and a Seasonal Restaurant. In Ivey Ranch you own the land.
-
2026-04-08Active Under Contract 443-char remark
Show marketing remark (443 chars)
This 2br 2ba with a den/office home has a view of the golf course from the Large Covered Patio that is great for entertaining. This home has a 413 Permanent Foundation and is ready for financing. Ivey Ranch CC & GC, is a gated, senior community of manufactured homes integrated with a 9 hole golf course, Pro-shop, Driving Range, 4 community pools, 2 community spas, Club House and a Seasonal Restaurant. In Ivey Ranch you own the land.
-
2026-04-08$275,000 443-char remark
Show marketing remark (443 chars)
This 2br 2ba with a den/office home has a view of the golf course from the Large Covered Patio that is great for entertaining. This home has a 413 Permanent Foundation and is ready for financing. Ivey Ranch CC & GC, is a gated, senior community of manufactured homes integrated with a 9 hole golf course, Pro-shop, Driving Range, 4 community pools, 2 community spas, Club House and a Seasonal Restaurant. In Ivey Ranch you own the land.
-
2026-02-21historical
-
2025-10-24price $250,000
-
2025-05-12price $270,000
-
2025-02-21$285,000 Active
-
2025-02-19historical
-
2024-11-16$300,000 Active
-
2015-02-12soldstatus $118,000 Sold
-
2015-02-12soldstatus $118,000 Closed
-
2015-02-11soldstatus $118,100
-
2014-12-22status Pending
-
2014-11-12price $134,900
-
2014-07-01$157,500 Active
-
2003-06-17soldstatus $150,000
-
2003-04-26historical
-
2003-02-15$155,000
-
2003-02-13historical
-
2003-01-25$167,700
-
1998-06-08soldstatus $95,000
-
1989-12-22soldstatus $100,000
ⓘ Source: listings_history table (triggers on properties + properties_extension) + one-shot
backfill from property_details.listing_events for pre-trigger history.
Tax reassessment forecast CA · Resets to sale price
- Current annual tax
- $2,192 · $183/mo
- Projected year-2 tax
- $2,192 · $183/mo
- Expected delta
- $0/yr ($0/mo · 0.0%)
ⓘ Screening estimate from a state-policy table — verify with the county assessor before closing.
Climate risk First Street
- Flood 1/10 Low FEMA zone AO · 0% chance over 30 yrs
- Wildfire 4/10 Moderate
- Heat 9/10 Extreme 7 d/yr ≥114°F today · 19 d/yr by 30 yrs out
- Wind 1/10 Low
- Air quality 4/10 Moderate 5 unhealthy d/yr today · 7 by 30 yrs out
Nearby sold comps map
Loading sold comps map…
Walkable amenities ~0.75 mi
Loading nearby amenities…
Taxation est. · year 1
- Rental income
- $38,403
- − Mortgage interest
- −$15,404
- − Property taxes
- −$2,192
- − Insurance
- −$2,842
- − Repairs & maintenance
- −$3,072
- − Management
- −$3,072
- − HOA
- −$5,460
- − Depreciation
- −$8,000
- Taxable loss
- −$1,641
- Est. tax savings @ 24.0%
- +$394
- After-tax cash flow
- $2,932/yr
For passive investors: Depreciation is non-cash, so a rental often shows a tax loss while cash-flowing — sheltering income. Rental losses are passive: they offset passive income freely, and up to $25,000/yr can offset ordinary (W-2) income if you actively participate and your MAGI is under $100k (phasing out to $0 by $150k); unused losses carry forward. On sale, claimed depreciation is recaptured at up to 25%, and gains may owe capital-gains tax (a 1031 exchange can defer both). Figures are a year-1 estimate at your 24.0% rate — not tax advice; consult a CPA.
Schools (NCES district)
- District
- Palm Springs Unified
- NCES district ID
- 0629550
- Math proficiency
- 21% ▼ -7.00%
- Reading proficiency
- 42% ▬ 0.00%
- Median HH income
- $43,638
- Composite
- 26.76/100
- National rank
- #7131
- State rank
- #328 of 517 in CA
Livability — Thousand Palms
- Score
- 53/100
- State rank
- #950
- US rank
- #24426
Category grades
Schools grade is shown separately in the Schools card above.
Census & demographics
- Census place
- Thousand Palms, CA
- City population
- 7,662
- Population (ZIP)
- 7,662
Population outlook (Riverside County) Hauer SSP2
- Today (2025)
- 2,664,475 people
- By 2030
- 2,802,692 · +5.2%
- By 2040
- 3,050,904 · +14.5%
- By 2050
- 3,256,783 · +22.2%
- By 2075
- 3,655,058 · +37.2%
- By 2100
- 3,766,594 · +41.4%
Race, ethnicity, and origin ACS 2023
- Neighborhood character
- Majority Hispanic (64%)
- Race & ethnicity
- Hispanic / Latino 64% Two or more races 43% White 32% Native American 4%
- Hispanic origin (detail)
- Mexican 62%
- Common ancestry
- Slovak 2% Lithuanian 1% Portuguese 1%
- Foreign-born
- 16% · Canada
- Languages at home
- 54% English-only · Spanish 43% German/W. Germanic 1% Other Indo-European 1%
Political lean MEDSL · Riverside
- 2024 margin
- Toss-up / Even · D 48.0% · R 49.3% · Other 2.6%
- 2008→2024 swing
- -3.6pp toward R · 2008: 2.3pp · 2024: -1.3pp
- All cycles
- 2024: R+1.3 2020: D+8.0 2016: D+4.3 2012: R+0.4 2008: D+2.3
Not yet ingested
- Civics
- —
Market trends
- HPI YoY
- ▼ -46.86%
- Current HPI
- 382.4439
- Rent YoY
- —
- Metro
- —
- State GDP YoY
- ▲ 3.21%
- F500 in state
- 116
Industry mix (Fortune 500 HQ in CA)
| Industry | F500 HQs | Revenue |
|---|---|---|
| Technology | 27 | $1,492B |
|
||
| Financial Services | 3 | $174B |
|
||
| Retail | 3 | $44B |
|
||
| Insurance | 3 | $26B |
|
||
| Media / Entertainment | 2 | $115B |
|
||
| Pharmaceuticals / Biotech | 2 | $62B |
|
||
Price history
+175.0% since first listed22 events — show timeline
- 2026-04-18 Relisted — GPSMLS
- 2026-04-08 Listed — GPSMLS
- 2026-04-08 Listed $275,000 GPSMLS
- 2026-02-21 Listing Removed — CRMLS
- 2025-10-24 Price Changed $250,000 CRMLS
- 2025-05-12 Price Changed $270,000 CRMLS
- 2025-02-21 Listed $285,000 CRMLS
- 2025-02-19 Listing Removed — CRMLS
- 2024-11-16 Listed $300,000 CRMLS
- 2015-02-12 Sold (MLS) $118,000 GPSMLS
- 2015-02-12 Sold (MLS) $118,000 GPSMLS
- 2015-02-11 Sold (Public Records) $118,100 Public Records
- 2014-12-22 Pending — GPSMLS
- 2014-11-12 Price Changed $134,900 GPSMLS
- 2014-07-01 Listed $157,500 GPSMLS
- 2003-06-17 Sold (Public Records) $150,000 Public Records
- 2003-04-26 Listing Removed — GPSMLS
- 2003-02-15 Listed $155,000 GPSMLS
- 2003-02-13 Listing Removed — GPSMLS
- 2003-01-25 Listed $167,700 GPSMLS
- 1998-06-08 Sold (Public Records) $95,000 Public Records
- 1989-12-22 Sold (Public Records) $100,000 Public Records
Property tax history
+0.2%/yrLatest (2025): $2,192 · +0.2% YoY. Source: county tax records.
Cash-flow waterfall
monthlySold comps — $/sqft
last 12 mo · ≤1 miLoading sold comps…