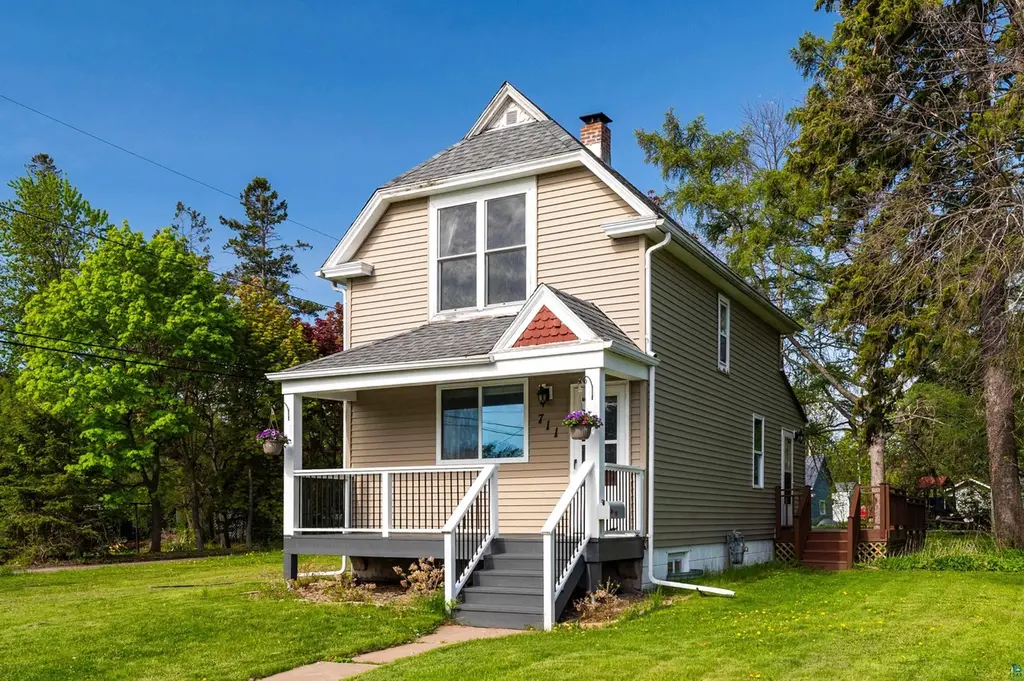
711 N 44th Ave Ave E · Duluth, MN
Flood risk 1/10 · Minimal
- FEMA flood zone
- X
- Chance of flooding over 30 yrs
- 0.0%
- Est. flood insurance / yr
- $473 – $860
Fire risk 1/10 · Minimal
- Est. fire insurance / yr
- $888 – $1,650
Heat risk 2/10 · Minimal
- Hot days now (above 90°F)
- 7 days/yr
- Hot days in 30 yrs
- 13 days/yr
Wind risk 1/10 · Minimal
- Chance of severe wind over 30 yrs
- —
Air-quality risk 2/10 · Minimal
- Unhealthy air days now
- 0 days/yr
- Unhealthy air days in 30 yrs
- 1 days/yr
Risk factors via First Street. Map © Google.
Why this score? — see what drove the C+ grade
The composite is a weighted blend of 9 inputs, each scored 0–100. Each bar is that input's sub-score; the figure is the points it added to the 100-point composite (weight × sub-score).
- Cash flow +22.4/30.0
- ARV discount +12.3/15.0
- DSCR +7.2/10.0
- 1% rule +5.3/10.0
- Schools +4.2/10.0
- Livability +4.1/5.0
- Rent growth +2.5/5.0
- Condition / age +2.5/5.0
- Appreciation +0.0/10.0
$219,500
🖨 Deal sheet 📄 Offer letter ✓ Due diligence
Listing remarks MLS
Located in a wonderful nook in Lakeside, this tastefully remodeled home is exactly what this market needs. Features include a new kitchen w/ gorgeous counter tops, cabinets and stainless steel appliances, a main level bath, a brand new energy star furnace (gas), new sump pump, n
Key facts
- Open back yard
- Updated kitchen
- Updated flooring
Tags
Property features AI
Exterior
- Parking: No dedicated parking listed
- Utilities: Public water; Public sewer
- Home design: Single-family detached residence; Single-story
- Exterior features: Deck
Interior
- Bathrooms: 1 full bathroom; 1 half bathroom
- Heating & cooling: Forced air heating (natural gas); Window cooling units
- Interior features: Full unfinished basement
Neighborhood map
What this means for you Summary
Snapshot
- This is a 2-bed/1.0-bath single-family listed at $220k.
Deal economics
- At list price, monthly cash flow is $367 ($4k/yr) — positive.
- The deal already cash-flows at list — no discount required.
- Meets the 1% rule at list price ($2k rent vs $220k).
- Cap rate 8.3% vs local median 4.9% in Duluth — top-decile yield for the area; either an underpriced asset or a hidden risk that comps aren't pricing in. Stress-test before assuming the spread holds.
Location & tenants
- Location reads 82/100 on livability (#36 in MN, #1,060 nationally) — a professional / high-income tenant draw. Strengths: commute A+, cost of living A+, housing A+; Watch: amenities F.
- Duluth Public School District (urban): math 44% / reading 55% proficiency, ranked #132 of 301 in MN (top 44%) — families likely to look elsewhere, expect single-tenant / working-renter base with shorter leases.
- Market conditions: 99 active listings in the ZIP; 2 comparable units currently listed for rent nearby; 639 units permitted in St. Louis County in 2024 (338 in 5+ unit buildings).
Forward outlook
- Local home prices are declining (-3.0%/yr); year-one equity from $2k of loan paydown is wiped out by about $7k of value loss. Plan a longer hold.
Negotiation context
- Only 2 days on market — expect competitive offers; lowballing is unlikely to land.
- 8 sale attempts since 18y ago with the ask held roughly flat each time — persistent listings suggest the price (not the market) is what's stuck; bring a comps-based counter.
- Current owner paid $137k; list at $220k implies a 60% gain — meaningful room to come down on a strong offer.
Risks & watch-outs
- Watch-outs: built in 1890 — expect roof / HVAC / electrical / plumbing capex.
Questions for the listing agent
- Built in 1890 — when were the roof, HVAC, electrical panel, plumbing, and water heater last replaced?
- Is there a deadline driving the sale (1031 exchange, divorce, estate, relocation)? That informs how much negotiation room exists.
- Schools are B-rated — typically a magnet for longer-tenancy family renters. What's the average tenant stay here, and is there a school-zone premium baked into asking?
- What's the average days-on-market for RENTAL listings here right now (not sales)? A rising rental-DOM trend means longer vacancies and softer asking-rent achievability than the comps imply.
- What's the recent tenant-quality profile in this submarket — average credit score on applications, eviction rate, late-payment / NSF rate, and stable-employment percentage? A property-management company in the area should have these aggregated.
- How much new for-sale + rental construction is in the pipeline within 1–3 miles? Heavy new supply typically softens prices + rents 12–24 months out; constrained supply supports both.
Investment metrics
- 1% rule
- 1.03% ✓
- Cap rate
- 8.30%
- Cash-on-cash
- 7.16%
- DSCR
- 1.32
- GRM
- 8.1
CMA / ARV
- ARV (on-the-fly)
- $245,600
- Comps found
- 4
Show comp detail 4 sales within ~0.75 mi
| Address | Dist | Beds/Ba | Sqft | Sold | Price | $/sf | Match |
|---|---|---|---|---|---|---|---|
| 4405 Cooke St | 0.12mi | 2/1.5 | 830 (+4%) | 2mo | $260,000 | $313 | 84 |
| 4215 Regent St | 0.21mi | 2/2.0 | 820 (+2%) | 0mo | $251,500 | $307 | 82 |
| 801 N 46th Ave Ave E | 0.18mi | 2/1.0 | 864 (+8%) | 22mo | $248,900 | $288 | 60 |
| 4302 Pitt St | 0.16mi | 3/1.5 (+1) | 848 (+6%) | 20mo | $235,000 | $277 | 59 |
Match score weights: distance 35% · size 25% · config 20% · recency 20%. Top-matched comps best support the ARV.
Projected returns pro-forma
-3.0% appreciation · 3.0% rent growth · sell at horizon
- IRR
- -5.4%
- Equity multiple
- 0.80×
- Total profit
- $-12,245
- Equity at exit
- $32,728
- IRR
- 4.3%
- Equity multiple
- 1.31×
- Total profit
- $19,311
- Equity at exit
- $18,978
Cash invested: $61,460 (down + closing). Projections, not guarantees.
Landlord ↔ Tenant lean methodology
- Overall (STATE)
- 46 Balanced
- State Minnesota
- 46 Balanced · D+2
- County
- — inherits STATE
- City
- — inherits STATE
ZIP-level market 55804
- Active inventory
- 99
- Price-to-rent
- 8.1×
Monthly cashflow live
- Estimated rent
- $2,269 medium interval (Pro) →
- Mortgage (P&I)
- −$1,151
- Tax from tax record
- −$184 /mo · $2,204/yr
- Insurance
- −$91
- HOA
- −$0
- Vacancy / Maint / Mgmt
- −$477
- Net cashflow
- $367
Break-even live
UW: 25.0% down · 7.5% · 30yr · 1.5% tax · 5.0% vac · 8.0% maint · 8.0% mgmt
Financing live
Cash to close
- Down payment
- $54,875
- Closing costs
- $6,585
- Reserves months
- —
- Total cash needed
- —
Loan-product check · same deal, 3 products live
Conventional
25% down · 7.5% · 30yr
- Down + closing
- —
- Monthly P&I
- —
- Monthly cashflow
- —
- DSCR
- —
- Eligible?
- —
Personal DTI + credit; lowest rate.
DSCR
20% down · 8.5% · 30yr
- Down + closing
- —
- Monthly P&I
- —
- Monthly cashflow
- —
- DSCR
- —
- Eligible?
- —
No personal income docs; deal must DSCR.
Hard money
10% down · 12.0% · 12mo
- Down + closing
- —
- Monthly P&I
- —
- Monthly cashflow
- —
- DSCR
- —
- Eligible?
- —
Short-term bridge; refi at stabilization.
Rent comps 2 comps
| Address | Beds | Baths | Sqft | Rent | $/sqft | DOM | Units | Dist |
|---|---|---|---|---|---|---|---|---|
| 5090 London Rd Unit 1 Duluth, MN | 2.0 | 2.0 | 959 | $2,100 | $2.19 | 13d | 1 | 0.70mi |
| 3780 London Rd Duluth, MN | 1.0–3.0 | 1.0–2.0 | 1312 | $2,542 | $1.94 | 13d | 1 | 0.82mi |
Listing history 3 events
-
2026-06-07statusdays on market $219,500 Pending 2 DOM
-
2026-06-05remarks 699-char remark
-
2026-06-05$219,500 Active 1 DOM
ⓘ Source: listings_history table (triggers on properties + properties_extension) + one-shot
backfill from property_details.listing_events for pre-trigger history.
Tax reassessment forecast MN · Partial reset (capped growth)
- Current annual tax
- $2,204 · $184/mo
- Projected year-2 tax
- $2,331 · $194/mo
- Expected delta
- +$127/yr (+$11/mo · 5.8%)
ⓘ Screening estimate from a state-policy table — verify with the county assessor before closing.
Climate risk First Street
- Flood 1/10 Low FEMA zone X · 0% chance over 30 yrs
- Wildfire 1/10 Low
- Heat 2/10 Low 7 d/yr ≥90°F today · 13 d/yr by 30 yrs out
- Wind 1/10 Low
- Air quality 2/10 Low 0 unhealthy d/yr today · 1 by 30 yrs out
Nearby sold comps map
Loading sold comps map…
Walkable amenities ~0.75 mi
Loading nearby amenities…
Taxation est. · year 1
- Rental income
- $27,232
- − Mortgage interest
- −$12,295
- − Property taxes
- −$2,204
- − Insurance
- −$1,098
- − Repairs & maintenance
- −$2,179
- − Management
- −$2,179
- − Depreciation
- −$6,385
- Taxable income
- $892
- Est. tax owed @ 24.0%
- −$214
- After-tax cash flow
- $4,184/yr
For passive investors: Depreciation is non-cash, so a rental often shows a tax loss while cash-flowing — sheltering income. Rental losses are passive: they offset passive income freely, and up to $25,000/yr can offset ordinary (W-2) income if you actively participate and your MAGI is under $100k (phasing out to $0 by $150k); unused losses carry forward. On sale, claimed depreciation is recaptured at up to 25%, and gains may owe capital-gains tax (a 1031 exchange can defer both). Figures are a year-1 estimate at your 24.0% rate — not tax advice; consult a CPA.
Schools (NCES district)
- District
- Duluth Public School District
- NCES district ID
- 2711040
- Math proficiency
- 44% ▼ -10.00%
- Reading proficiency
- 55% ▼ -6.00%
- Median HH income
- $45,692
- Composite
- 41.92/100
- National rank
- #3360
- State rank
- #132 of 301 in MN
Livability — Duluth
- Score
- 82/100
- State rank
- #36
- US rank
- #1060
Category grades
Schools grade is shown separately in the Schools card above.
Census & demographics
- Census place
- Duluth, MN
- City population
- 71,097
- Population (ZIP)
- 16,018
Population outlook (St. Louis County) Hauer SSP2
- Today (2025)
- 202,411 people
- By 2030
- 203,234 · +0.4%
- By 2040
- 202,520 · +0.1%
- By 2050
- 200,853 · -0.8%
- By 2075
- 200,943 · -0.7%
- By 2100
- 192,058 · -5.1%
Race, ethnicity, and origin ACS 2023
- Neighborhood character
- Predominantly White (92%)
- Race & ethnicity
- White 92% Two or more races 5% Hispanic / Latino 1% Asian 1%
- Common ancestry
- Portuguese 14% Scottish 4% Romanian 4%
- Foreign-born
- 3% · Canada
- Languages at home
- 96% English-only · Spanish 1%
Political lean MEDSL · St. Louis
- 2024 margin
- D (+13.7) · D 55.9% · R 42.2% · Other 1.8%
- 2008→2024 swing
- -18.8pp toward R · 2008: 32.5pp · 2024: 13.7pp
- All cycles
- 2024: D+13.7 2020: D+15.6 2016: D+11.8 2012: D+29.6 2008: D+32.5
Not yet ingested
- Civics
- —
Market trends
- HPI YoY
- ▼ -253.94%
- Current HPI
- 199.4064
- Rent YoY
- —
- Metro
- —
- State GDP YoY
- ▲ 2.41%
- F500 in state
- 34
Industry mix (Fortune 500 HQ in MN)
| Industry | F500 HQs | Revenue |
|---|---|---|
| Healthcare | 2 | $407B |
|
||
| Retail | 2 | $150B |
|
||
| Consumer Goods | 2 | $32B |
|
||
| Industrial Machinery | 2 | $6B |
|
||
| Agriculture | 1 | $40B |
|
||
| Healthcare / Medical Devices | 1 | $32B |
|
||
Price history
+99.7% since first listed17 events — show timeline
- 2026-06-04 Listed $219,500 LSAR
- 2016-06-14 Sold (Public Records) $137,000 Public Records
- 2016-06-08 Sold (MLS) $137,000 LSAR
- 2016-04-10 Listed $137,000 LSAR
- 2013-10-25 Sold (Public Records) $122,400 Public Records
- 2013-10-24 Sold (MLS) $122,400 NORTHSTARMLS as Distributed by MLS Grid
- 2013-09-06 Listed $119,900 NORTHSTARMLS as Distributed by MLS Grid
- 2010-12-31 Listing Removed — NORTHSTARMLS as Distributed by MLS Grid
- 2010-09-15 Listed $114,900 NORTHSTARMLS as Distributed by MLS Grid
- 2010-09-15 Listed $114,900 NORTHSTARMLS as Distributed by MLS Grid
- 2009-01-18 Listing Removed — NORTHSTARMLS as Distributed by MLS Grid
- 2008-06-26 Listed $113,900 NORTHSTARMLS as Distributed by MLS Grid
- 2008-06-26 Listed $113,900 NORTHSTARMLS as Distributed by MLS Grid
- 2008-06-19 Sold (Public Records) $109,900 Public Records
- 2008-05-23 Sold (MLS) $109,900 NORTHSTARMLS as Distributed by MLS Grid
- 2008-05-23 Sold (MLS) $109,900 NORTHSTARMLS as Distributed by MLS Grid
- 2008-03-26 Listed $109,900 NORTHSTARMLS as Distributed by MLS Grid
Property tax history
+4.6%/yrLatest (2025): $2,204 · +1.9% YoY. Source: county tax records.
Cash-flow waterfall
monthlySold comps — $/sqft
last 12 mo · ≤1 miLoading sold comps…