117 Lakeshore Dr · Big Sandy, TN
Flood risk 1/10 · Minimal
- FEMA flood zone
- X (unshaded)
- Chance of flooding over 30 yrs
- 0.0%
- Est. flood insurance / yr
- $507 – $1,088
Fire risk 4/10 · Minor
- Est. fire insurance / yr
- $949 – $1,763
Heat risk 6/10 · Moderate
- Hot days now (above 109°F)
- 7 days/yr
- Hot days in 30 yrs
- 21 days/yr
Wind risk 4/10 · Minor
- Chance of severe wind over 30 yrs
- 13.0%
Air-quality risk 1/10 · Minimal
- Unhealthy air days now
- 0 days/yr
- Unhealthy air days in 30 yrs
- 0 days/yr
Risk factors via First Street. Map © Google.
Why this score? — see what drove the D- grade
The composite is a weighted blend of 9 inputs, each scored 0–100. Each bar is that input's sub-score; the figure is the points it added to the 100-point composite (weight × sub-score).
- Cash flow +10.5/30.0
- ARV discount +7.5/15.0
- Appreciation +6.7/10.0
- DSCR +3.0/10.0
- Livability +2.9/5.0
- Rent growth +2.5/5.0
- Schools +2.5/10.0
- Condition / age +2.5/5.0
- 1% rule +1.8/10.0
$148,000
🖨 Deal sheet 📄 Offer letter ✓ Due diligence
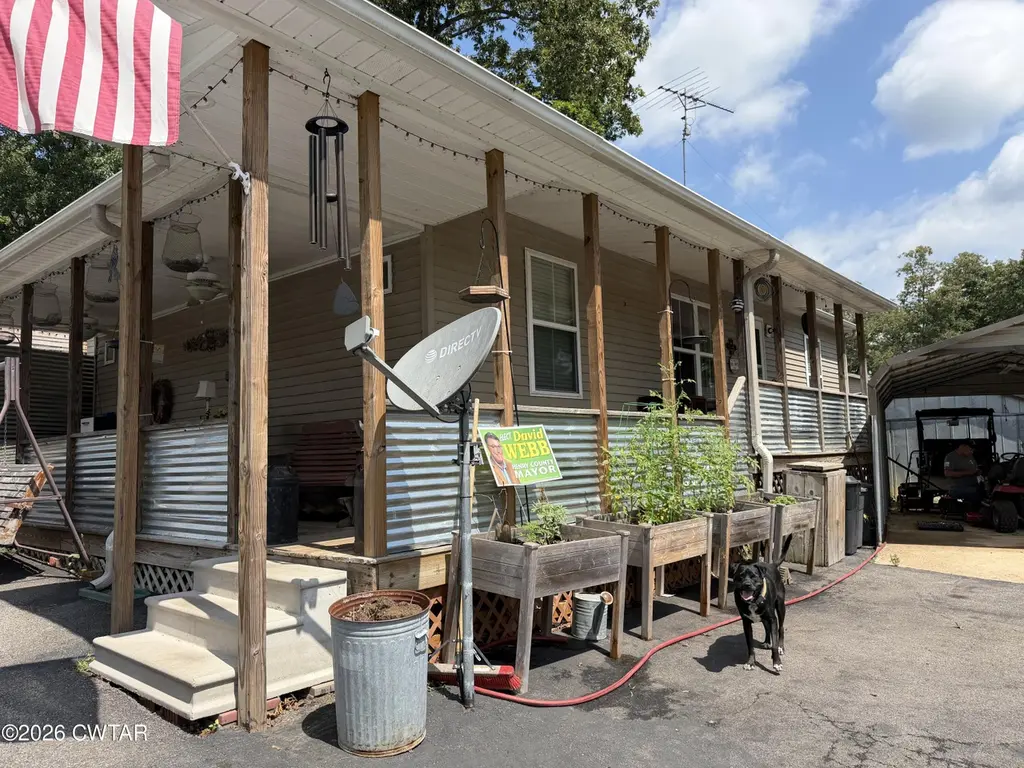
Listing remarks
Porch rocking, Tea sipping, LAKE HOME. If you ever wanted a get away, this is it. Or just stay everyday. 3 bedrooms and 2 full baths. Walking distance to Kentucky lake and all the activities at Country Junction and Drakes Landing. No land rent. No HOA. No restrictions. Double metal carport for your boat parking. Go boating within minutes that morning and grilling a steak by afternoon.
Key facts
- Double metal carport
- Lake home
- 4,791 sq ft lot
Tags
Property features AI
Exterior
- Parking: 4 parking spaces total; 2-car carport; 2 open parking spaces
- Utilities: Public water; Septic tank
- Home design: Single-family residence; One-level home (1 story)
- Construction: Metal roof
- Exterior features: Covered deck/porch with awning(s); Porch; Deck; Shed(s)
Interior
- Bedrooms: 3 bedrooms on the main level
- Bathrooms: 2 full bathrooms (both on the main level)
- Heating & cooling: Central heating (electric); Central electric air conditioning
- Interior features: 4 total rooms
Neighborhood map
What this means for you Summary
Snapshot
- This is a 3-bed/1.0-bath single-family listed at $148k.
Deal economics
- At list price, monthly cash flow is $-77 ($-924/yr) — negative.
- To cash-flow at today's rent, offer at most $134k (9.2% below list).
- To meet the 1% rule (rent ≥ 1% of price), the offer needs to be $100k (32.2% below list).
- Recommended offer: $100k (32.2% below list) — sets the bar for 1% rule.
Location & tenants
- Location reads 58/100 on livability (#315 in TN) — a working-class tenant base; expect higher turnover. Strengths: cost of living A+, housing A-; Watch: schools F, crime F, amenities F.
- Henry County (rural): math 30% / reading 30% proficiency, ranked #60 of 139 in TN (top 43%) — families likely to look elsewhere, expect single-tenant / working-renter base with shorter leases.
- Market conditions: 57 active listings in the ZIP; 19 units permitted in Henry County in 2024 (0 in 5+ unit buildings).
Forward outlook
- In year one you build about $6k of equity ($1k loan paydown + $5k appreciation (3.5% local appreciation)).
- Henry County population projected to shrink 10% by 2050 — rents likely to lag national; underwrite the cash flow, not the appreciation.
- At projected returns (3.5% appreciation + 3.0% rent growth), your $41k cash investment doubles in ~7 years — after that, you're playing with house money.
- By year 6, paydown + projected appreciation supports a ~$33k cash-out refi (75% LTV) — recoverable capital for the next deal without selling this one.
Negotiation context
- Only 6 days on market — expect competitive offers; lowballing is unlikely to land.
- Current owner paid $10k; list at $148k implies a 1380% gain — meaningful room to come down on a strong offer.
Risks & watch-outs
- Climate carrying-cost: extreme-heat days projected 7→21/yr by 2055 (HVAC capex compounding) — expect insurance premiums to compound above CPI over the hold.
Questions for the listing agent
- What do current leases actually rent for vs. the listed asking? Can we see a recent rent roll and the last 12 months of T-12 income?
- Is there a deadline driving the sale (1031 exchange, divorce, estate, relocation)? That informs how much negotiation room exists.
- Schools are F-rated, which usually means shorter tenancies and higher turnover. Who's the typical renter profile here, and what's been the actual vacancy rate?
- Crime grade is F in this area — have there been break-ins, vandalism, or insurance claims at this property in the last 3 years? What carrier currently insures it and at what premium?
- The area grade is low — what's the realistic commute time and amenity access for the typical tenant pool here? Any planned neighborhood developments (good or bad) we should know about?
- What's the average days-on-market for RENTAL listings here right now (not sales)? A rising rental-DOM trend means longer vacancies and softer asking-rent achievability than the comps imply.
- What's the recent tenant-quality profile in this submarket — average credit score on applications, eviction rate, late-payment / NSF rate, and stable-employment percentage? A property-management company in the area should have these aggregated.
- How much new for-sale + rental construction is in the pipeline within 1–3 miles? Heavy new supply typically softens prices + rents 12–24 months out; constrained supply supports both.
Investment metrics
- 1% rule
- 0.68% ✗
- Cap rate
- 5.67%
- Cash-on-cash
- -2.23%
- DSCR
- 0.90
- GRM
- 12.3
CMA / ARV
No comps found within radius.
Projected returns pro-forma
3.48% appreciation · 3.0% rent growth · sell at horizon
- IRR
- 6.8%
- Equity multiple
- 1.40×
- Total profit
- $16,678
- Equity at exit
- $70,623
- IRR
- 9.4%
- Equity multiple
- 2.48×
- Total profit
- $61,508
- Equity at exit
- $112,120
Cash invested: $41,440 (down + closing). Projections, not guarantees.
Landlord ↔ Tenant lean methodology
- Overall (STATE)
- 87 Strongly Landlord-Friendly
- State Tennessee
- 87 Strongly Landlord-Friendly · R+13
- County
- — inherits STATE
- City
- — inherits STATE
ZIP-level market 38256
- Home prices YoY
- 1.3%
- Active inventory
- 57
- Price-to-rent
- 12.3×
Monthly cashflow live
- Estimated rent
- $1,004 medium interval (Pro) →
- Mortgage (P&I)
- −$776
- Tax from tax record
- −$32 /mo · $385/yr
- Insurance
- −$62
- HOA
- −$0
- Vacancy / Maint / Mgmt
- −$211
- Net cashflow
- $-77
Break-even live
UW: 25.0% down · 7.5% · 30yr · 1.5% tax · 5.0% vac · 8.0% maint · 8.0% mgmt
Financing live
Cash to close
- Down payment
- $37,000
- Closing costs
- $4,440
- Reserves months
- —
- Total cash needed
- —
Loan-product check · same deal, 3 products live
Conventional
25% down · 7.5% · 30yr
- Down + closing
- —
- Monthly P&I
- —
- Monthly cashflow
- —
- DSCR
- —
- Eligible?
- —
Personal DTI + credit; lowest rate.
DSCR
20% down · 8.5% · 30yr
- Down + closing
- —
- Monthly P&I
- —
- Monthly cashflow
- —
- DSCR
- —
- Eligible?
- —
No personal income docs; deal must DSCR.
Hard money
10% down · 12.0% · 12mo
- Down + closing
- —
- Monthly P&I
- —
- Monthly cashflow
- —
- DSCR
- —
- Eligible?
- —
Short-term bridge; refi at stabilization.
Listing history 6 events
-
2026-06-18days on market $148,000 Active 6 DOM
-
2026-06-17days on market $148,000 Active 5 DOM
-
2026-06-16days on market $148,000 Active 4 DOM
-
2026-06-15days on market $148,000 Active 3 DOM
-
2026-06-12remarks 387-char remark
-
2026-06-12$148,000 Active 1 DOM
ⓘ Source: listings_history table (triggers on properties + properties_extension) + one-shot
backfill from property_details.listing_events for pre-trigger history.
Tax reassessment forecast TN · Resets to sale price
- Current annual tax
- $385 · $32/mo
- Projected year-2 tax
- $1,051 · $88/mo
- Expected delta
- +$666/yr (+$55/mo · 172.9%)
ⓘ Screening estimate from a state-policy table — verify with the county assessor before closing.
Climate risk First Street
- Flood 1/10 Low FEMA zone X (unshaded) · 0% chance over 30 yrs
- Wildfire 4/10 Moderate
- Heat 6/10 Major 7 d/yr ≥109°F today · 21 d/yr by 30 yrs out
- Wind 4/10 Moderate 13% chance of damaging wind over 30 yrs
- Air quality 1/10 Low 0 unhealthy d/yr today · 0 by 30 yrs out
Nearby sold comps map
Loading sold comps map…
Walkable amenities ~0.75 mi
Loading nearby amenities…
Taxation est. · year 1
- Rental income
- $12,044
- − Mortgage interest
- −$8,290
- − Property taxes
- −$385
- − Insurance
- −$740
- − Repairs & maintenance
- −$964
- − Management
- −$964
- − Depreciation
- −$4,305
- Taxable loss
- −$3,604
- Est. tax savings @ 24.0%
- +$865
- After-tax cash flow
- $-59/yr
For passive investors: Depreciation is non-cash, so a rental often shows a tax loss while cash-flowing — sheltering income. Rental losses are passive: they offset passive income freely, and up to $25,000/yr can offset ordinary (W-2) income if you actively participate and your MAGI is under $100k (phasing out to $0 by $150k); unused losses carry forward. On sale, claimed depreciation is recaptured at up to 25%, and gains may owe capital-gains tax (a 1031 exchange can defer both). Figures are a year-1 estimate at your 24.0% rate — not tax advice; consult a CPA.
Schools (NCES district)
- District
- Henry County
- NCES district ID
- 4701830
- Math proficiency
- 30% ▼ -3.00%
- Reading proficiency
- 30% ▼ -6.00%
- Median HH income
- $41,770
- Composite
- 25.42/100
- National rank
- #7457
- State rank
- #60 of 139 in TN
Livability — Big Sandy
- Score
- 58/100
- State rank
- #315
- US rank
- #21412
Category grades
Schools grade is shown separately in the Schools card above.
Census & demographics
- Population (ZIP)
- 2,994
Population outlook (Henry County) Hauer SSP2
- Today (2025)
- 31,750 people
- By 2030
- 31,277 · -1.5%
- By 2040
- 30,064 · -5.3%
- By 2050
- 28,675 · -9.7%
- By 2075
- 25,767 · -18.8%
- By 2100
- 22,318 · -29.7%
Race, ethnicity, and origin ACS 2023
- Neighborhood character
- Predominantly White (97%)
- Race & ethnicity
- White 97%
- Common ancestry
- Slovak 2% Serbian 1% Lithuanian 1%
- Foreign-born
- 1% · China
- Languages at home
- 98% English-only · Spanish 1% Chinese 1%
Political lean MEDSL · Henry
- 2024 margin
- Solid R (+55.3) · D 21.8% · R 77.1% · Other 1.1%
- 2008→2024 swing
- -33.0pp toward R · 2008: -22.4pp · 2024: -55.3pp
- All cycles
- 2024: R+55.3 2020: R+51.1 2016: R+49.8 2012: R+30.2 2008: R+22.4
Not yet ingested
- Civics
- —
Market trends
- HPI YoY
- ▲ 3.48%
- Current HPI
- 264.1122
- Rent YoY
- —
- Metro
- —
- State GDP YoY
- ▲ 2.78%
- F500 in state
- 22
Industry mix (Fortune 500 HQ in TN)
| Industry | F500 HQs | Revenue |
|---|---|---|
| Healthcare | 3 | $91B |
|
||
| Retail | 3 | $72B |
|
||
| Transportation / Logistics | 1 | $88B |
|
||
| Paper / Packaging | 1 | $19B |
|
||
| Insurance | 1 | $13B |
|
||
| Energy | 1 | $12B |
|
||
Price history
+1380.0% since first listed2 events — show timeline
- 2026-06-12 Listed $148,000 CWTAR
- 2000-03-24 Sold (Public Records) $10,000 Public Records
Property tax history
+0.5%/yrLatest (2025): $385 · +0.3% YoY. Source: county tax records.
Cash-flow waterfall
monthlySold comps — $/sqft
last 12 mo · ≤1 miLoading sold comps…