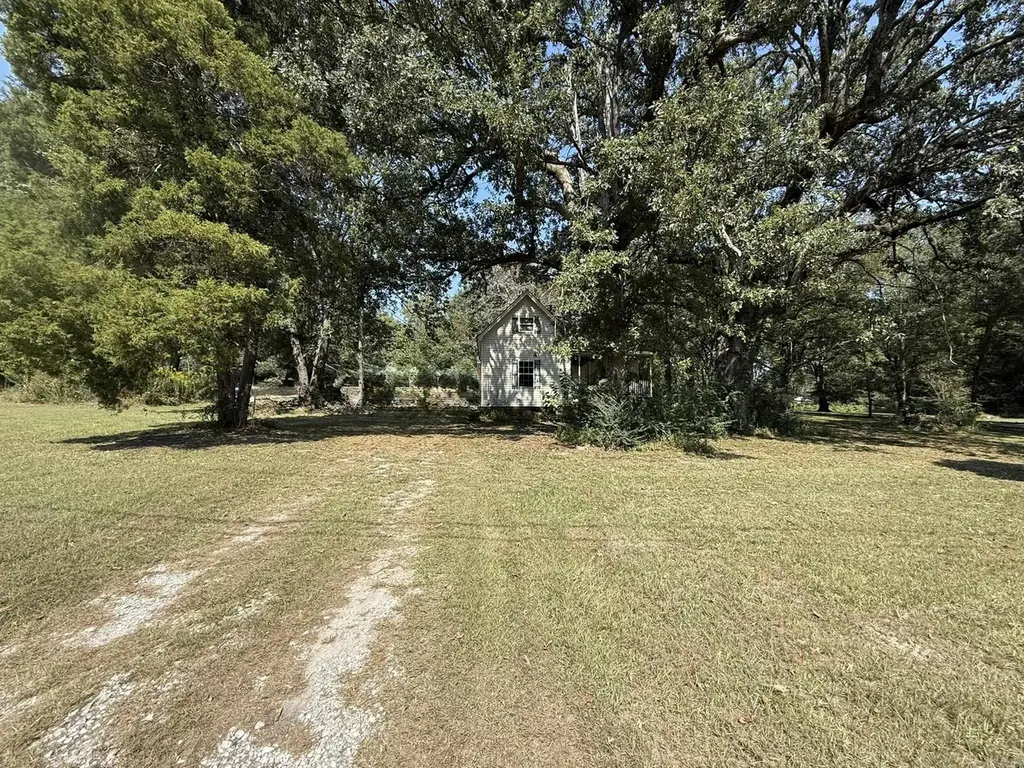
751 Gifford Rd · Perla, AR
Flood risk 1/10 · Minimal
- FEMA flood zone
- X (unshaded)
- Chance of flooding over 30 yrs
- 0.0%
- Est. flood insurance / yr
- $507 – $1,088
Fire risk 7/10 · Major
- Est. fire insurance / yr
- $1,499 – $2,785
Heat risk 6/10 · Moderate
- Hot days now (above 111°F)
- 7 days/yr
- Hot days in 30 yrs
- 20 days/yr
Wind risk 4/10 · Minor
- Chance of severe wind over 30 yrs
- 13.0%
Air-quality risk 2/10 · Minimal
- Unhealthy air days now
- 0 days/yr
- Unhealthy air days in 30 yrs
- 1 days/yr
Risk factors via First Street. Map © Google.
Why this score? — see what drove the B- grade
The composite is a weighted blend of 9 inputs, each scored 0–100. Each bar is that input's sub-score; the figure is the points it added to the 100-point composite (weight × sub-score).
- Cash flow +30.0/30.0
- 1% rule +10.0/10.0
- DSCR +10.0/10.0
- ARV discount +7.5/15.0
- Schools +3.2/10.0
- Livability +3.1/5.0
- Rent growth +2.5/5.0
- Condition / age +2.5/5.0
- Appreciation +0.0/10.0
$70,000
🖨 Deal sheet (PDF) 📄 Offer letter ✓ Due diligence
Listing remarks
Tear-Down on 2.11 Acres in Glen Rose School District. Cash/bank financing only. Sold AS-IS/WHERE-IS, no disclosures available. Price is firm at $70,000.
Key facts
- Shop
- 2.11 acres
- 2.11 acre lot
Tags
Property features AI
Finance
- Financial info: Financing available: Cash or in-house financing
Exterior
- Parking: Parking pads
- Utilities: Other utilities (see remarks)
- Home design: Other exterior details (see remarks)
- Construction: Crawl space foundation; Other roof type (see remarks)
- Exterior features: Level, rural, wooded setting; No road (road surface listed as No Road)
Interior
- Kitchen: Kitchen equipment: other (see remarks)
- Flooring: Other flooring (see remarks)
- Bathrooms: 3 full bathrooms
- Heating & cooling: Other heating and cooling (see remarks)
- Interior features: Gas log fireplace; Formal living room; Bonus room; Other interior features (see remarks)
Neighborhood map
What this means for you Summary
Snapshot
- This is a 4-bed/3.0-bath single-family listed at $70k.
Deal economics
- At list price, monthly cash flow is $672 ($8k/yr) — positive.
- The deal already cash-flows at list — no discount required.
- Meets the 1% rule at list price ($2k rent vs $70k).
- Recommended offer: $68k (3.0% below list) — sets the bar for market timing.
Location & tenants
- Location reads 62/100 on livability (#221 in AR) — a middle-class / working-renter tenant base. Strengths: cost of living A+, housing A+, health & safety A+; Watch: crime F, amenities F, commute F.
- Glen Rose School District (rural): math 42% / reading 33% proficiency, ranked #84 of 238 in AR (top 35%) — families likely to look elsewhere, expect single-tenant / working-renter base with shorter leases.
- Zoned schools: Glen Rose Elementary School (math 47% / reading 37%, grade F, #173 of 454 statewide, top 43%, 373 students, 54% FRL); Glen Rose Middle School (math 44% / reading 35%, grade F, #92 of 201 statewide, top 50%, 308 students, 51% FRL); Glen Rose High School (math 32% / reading 22%, grade F, #164 of 292 statewide, top 61%, 304 students, 34% FRL) — zoned schools at 46% FRL track the district average.
- Market conditions: 171 active listings in the ZIP; 4 units permitted in Hot Spring County in 2024 (0 in 5+ unit buildings).
Forward outlook
- Local home prices are declining (-3.0%/yr); year-one equity from $484 of loan paydown is wiped out by about $2k of value loss. Plan a longer hold.
- Hot Spring County population projected to shrink 3% by 2050 — rents likely to lag national; underwrite the cash flow, not the appreciation.
- At projected returns (-3.0% appreciation + 3.0% rent growth), your $20k cash investment doubles in ~3 years — after that, you're playing with house money.
Negotiation context
- It's been on market 48 days — a 3% lower offer ($68k) is reasonable based on typical stale-listing flexibility.
- 2 sale attempts with the ask held roughly flat each time — persistent listings suggest the price (not the market) is what's stuck; bring a comps-based counter.
Risks & watch-outs
- Watch-outs: built in 1940 — expect roof / HVAC / electrical / plumbing capex.
- Climate carrying-cost: major wildfire risk; extreme-heat days projected 7→20/yr by 2055 (HVAC capex compounding) — expect insurance premiums to compound above CPI over the hold.
Questions for the listing agent
- It's been on market 48 days. Have you received any prior offers? Is the seller open to a 3% concession, seller financing, or rate buy-down credit?
- Built in 1940 — when were the roof, HVAC, electrical panel, plumbing, and water heater last replaced?
- Is there a deadline driving the sale (1031 exchange, divorce, estate, relocation)? That informs how much negotiation room exists.
- Schools are F-rated, which usually means shorter tenancies and higher turnover. Who's the typical renter profile here, and what's been the actual vacancy rate?
- Crime grade is F in this area — have there been break-ins, vandalism, or insurance claims at this property in the last 3 years? What carrier currently insures it and at what premium?
- What's the average days-on-market for RENTAL listings here right now (not sales)? A rising rental-DOM trend means longer vacancies and softer asking-rent achievability than the comps imply.
- What's the recent tenant-quality profile in this submarket — average credit score on applications, eviction rate, late-payment / NSF rate, and stable-employment percentage? A property-management company in the area should have these aggregated.
- How much new for-sale + rental construction is in the pipeline within 1–3 miles? Heavy new supply typically softens prices + rents 12–24 months out; constrained supply supports both.
Investment metrics
- 1% rule
- 2.16% ✓
- Cap rate
- 17.82%
- Cash-on-cash
- 41.17%
- DSCR
- 2.83
- GRM
- 3.9
CMA / ARV
- ARV (median comp)
- $260,809
- List price
- $70,000
- Delta
- -73.16%
- Verdict
- UNDERPRICED
- Comps
- 4 within 1.0 mi
Show comp detail 2 sales within ~0.75 mi
| Address | Dist | Beds/Ba | Sqft | Sold | Price | $/sf | Match |
|---|---|---|---|---|---|---|---|
| 1592 Gifford Rd | 0.72mi | 3/2.0 (-1) | 2,087 (-3%) | 3mo | $299,000 | $143 | 51 |
| 20567 Hwy 67 | 0.67mi | 3/2.0 (-1) | 1,949 (-9%) | 22mo | $215,000 | $110 | 26 |
Match score weights: distance 35% · size 25% · config 20% · recency 20%. Top-matched comps best support the ARV.
Projected returns pro-forma
-3.0% appreciation · 3.0% rent growth · sell at horizon
- IRR
- 37.7%
- Equity multiple
- 2.61×
- Total profit
- $31,528
- Equity at exit
- $10,437
- IRR
- 44.3%
- Equity multiple
- 5.22×
- Total profit
- $82,789
- Equity at exit
- $6,052
Cash invested: $19,600 (down + closing). Projections, not guarantees.
Landlord ↔ Tenant lean methodology
- Overall (STATE)
- 92 Strongly Landlord-Friendly
- State Arkansas
- 92 Strongly Landlord-Friendly · R+14
- County
- — inherits STATE
- City
- — inherits STATE
ZIP-level market 72104
- Home prices YoY
- -7.3%
- Active inventory
- 171
- Price-to-rent
- 3.9×
Monthly cashflow live
- Estimated rent
- $1,514 medium interval (Pro) →
- Mortgage (P&I)
- −$367
- Tax from tax record
- −$127 /mo · $1,525/yr
- Insurance
- −$29
- HOA
- −$0
- Vacancy / Maint / Mgmt
- −$318
- Net cashflow
- $672
Break-even live
Sensitivity live
| Price | -10% $712 | -5% $692 | +0% $672 | +5% $653 | +10% $633 |
|---|---|---|---|---|---|
| Rent | -10% $553 | -5% $613 | +0% $672 | +5% $732 | +10% $792 |
| Rate | -1.0pp $708 | -0.5pp $690 | base $672 | +0.5pp $654 | +1.0pp $636 |
UW: 25.0% down · 7.5% · 30yr · 1.5% tax · 5.0% vac · 8.0% maint · 8.0% mgmt
Financing live
Cash to close
- Down payment
- $17,500
- Closing costs
- $2,100
- Reserves months
- —
- Total cash needed
- —
Loan-product check · same deal, 3 products live
Conventional
25% down · 7.5% · 30yr
- Down + closing
- —
- Monthly P&I
- —
- Monthly cashflow
- —
- DSCR
- —
- Eligible?
- —
Personal DTI + credit; lowest rate.
DSCR
20% down · 8.5% · 30yr
- Down + closing
- —
- Monthly P&I
- —
- Monthly cashflow
- —
- DSCR
- —
- Eligible?
- —
No personal income docs; deal must DSCR.
Hard money
10% down · 12.0% · 12mo
- Down + closing
- —
- Monthly P&I
- —
- Monthly cashflow
- —
- DSCR
- —
- Eligible?
- —
Short-term bridge; refi at stabilization.
Listing history 20 events
-
2026-06-18days on market $70,000 Active 48 DOM
-
2026-06-17days on market $70,000 Active 47 DOM
-
2026-06-16days on market $70,000 Active 46 DOM
-
2026-06-15days on market $70,000 Active 45 DOM
-
2026-06-14days on market $70,000 Active 43 DOM
-
2026-06-13days on market $70,000 Active 42 DOM
-
2026-06-10days on market $70,000 Active 40 DOM
-
2026-06-09days on market $70,000 Active 39 DOM
-
2026-06-08days on market $70,000 Active 38 DOM
-
2026-06-07days on market $70,000 Active 37 DOM
-
2026-06-03days on market $70,000 Active 33 DOM
-
2026-06-02days on market $70,000 Active 32 DOM
-
2026-06-01days on market $70,000 Active 31 DOM
-
2026-05-31days on market $70,000 Active 30 DOM
-
2026-05-31days on market $70,000 Active 29 DOM
-
2026-05-01$70,000 New Listing 152-char remark
-
2026-03-04historical
-
2025-10-04$75,000 New Listing
-
2005-10-11soldstatus $93,000
-
2001-03-09soldstatus $30,000
ⓘ Source: listings_history table (triggers on properties + properties_extension) + one-shot
backfill from property_details.listing_events for pre-trigger history.
Tax reassessment forecast AR · Resets to sale price
- Current annual tax
- $1,525 · $127/mo
- Projected year-2 tax
- $1,525 · $127/mo
- Expected delta
- $0/yr ($0/mo · 0.0%)
ⓘ Screening estimate from a state-policy table — verify with the county assessor before closing.
Climate risk First Street
- Flood 1/10 Low FEMA zone X (unshaded) · 0% chance over 30 yrs
- Wildfire 7/10 Severe
- Heat 6/10 Major 7 d/yr ≥111°F today · 20 d/yr by 30 yrs out
- Wind 4/10 Moderate 13% chance of damaging wind over 30 yrs
- Air quality 2/10 Low 0 unhealthy d/yr today · 1 by 30 yrs out
Nearby sold comps map
Loading sold comps map…
Walkable amenities ~0.75 mi
Loading nearby amenities…
Taxation est. · year 1
- Rental income
- $18,162
- − Mortgage interest
- −$3,921
- − Property taxes
- −$1,525
- − Insurance
- −$350
- − Repairs & maintenance
- −$1,453
- − Management
- −$1,453
- − Depreciation
- −$2,036
- Taxable income
- $7,424
- Est. tax owed @ 24.0%
- −$1,782
- After-tax cash flow
- $6,287/yr
For passive investors: Depreciation is non-cash, so a rental often shows a tax loss while cash-flowing — sheltering income. Rental losses are passive: they offset passive income freely, and up to $25,000/yr can offset ordinary (W-2) income if you actively participate and your MAGI is under $100k (phasing out to $0 by $150k); unused losses carry forward. On sale, claimed depreciation is recaptured at up to 25%, and gains may owe capital-gains tax (a 1031 exchange can defer both). Figures are a year-1 estimate at your 24.0% rate — not tax advice; consult a CPA.
Schools (NCES district)
- District
- Glen Rose School District
- NCES district ID
- 0506630
- Math proficiency
- 42% ▼ -13.00%
- Reading proficiency
- 33% ▼ -7.00%
- Median HH income
- $47,423
- Composite
- 32.22/100
- National rank
- #5772
- State rank
- #84 of 238 in AR
Livability — Perla
- Score
- 62/100
- State rank
- #221
- US rank
- #16895
Category grades
Schools grade is shown separately in the Schools card above.
Census & demographics
- Population (ZIP)
- 23,222
Population outlook (Hot Spring County) Hauer SSP2
- Today (2025)
- 34,464 people
- By 2030
- 34,659 · +0.6%
- By 2040
- 34,486 · +0.1%
- By 2050
- 33,419 · -3.0%
- By 2075
- 28,702 · -16.7%
- By 2100
- 21,415 · -37.9%
Race, ethnicity, and origin ACS 2023
- Neighborhood character
- Predominantly White (75%)
- Race & ethnicity
- White 75% Black 16% Two or more races 5% Hispanic / Latino 4%
- Common ancestry
- Serbian 2% Slovak 1% Iranian 1%
- Foreign-born
- 1% · Canada
- Languages at home
- 97% English-only · Spanish 3%
Political lean MEDSL · Hot Spring
- 2024 margin
- Solid R (+52.2) · D 22.9% · R 75.1% · Other 1.9%
- 2008→2024 swing
- -27.7pp toward R · 2008: -24.4pp · 2024: -52.2pp
- All cycles
- 2024: R+52.2 2020: R+48.7 2016: R+42.5 2012: R+29.0 2008: R+24.4
Not yet ingested
- Civics
- —
Market trends
- HPI YoY
- ▼ -16.79%
- Current HPI
- 211.6419
- Rent YoY
- —
- Metro
- —
- State GDP YoY
- ▲ 3.80%
- F500 in state
- 10
Industry mix (Fortune 500 HQ in AR)
| Industry | F500 HQs | Revenue |
|---|---|---|
| Retail | 1 | $681B |
|
||
| Food / Agriculture | 1 | $53B |
|
||
| Retail / Energy | 1 | $22B |
|
||
| Transportation / Logistics | 1 | $12B |
|
||
| Energy | 1 | $4B |
|
||
Price history
+133.3% since first listed5 events — show timeline
- 2026-05-01 Listed $70,000 CARMLS
- 2026-03-04 Listing Removed — CARMLS
- 2025-10-04 Listed $75,000 CARMLS
- 2005-10-11 Sold (Public Records) $93,000 Public Records
- 2001-03-09 Sold (Public Records) $30,000 Public Records
Property tax history
+6.1%/yrLatest (2025): $1,525 · +3.4% YoY. Source: county tax records.
Cash-flow waterfall
monthlySold comps — $/sqft
last 12 mo · ≤1 miLoading sold comps…