 🏗️ New Construction
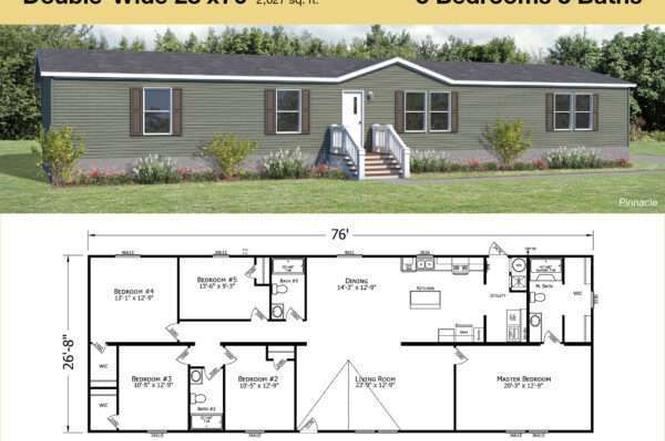
Pinnacle (Blue Spruce) Plan · Milton, WV
Flood risk No data
- FEMA flood zone
- —
- Chance of flooding over 30 yrs
- —
- Est. flood insurance / yr
- —
Fire risk No data
- Est. fire insurance / yr
- —
Heat risk No data
- Hot days now (above threshold)
- —
- Hot days in 30 yrs
- —
Wind risk No data
- Chance of severe wind over 30 yrs
- —
Air-quality risk No data
- Unhealthy air days now
- —
- Unhealthy air days in 30 yrs
- —
Risk factors via First Street. Map © Google.
Why this score? — see what drove the D grade
The composite is a weighted blend of 9 inputs, each scored 0–100. Each bar is that input's sub-score; the figure is the points it added to the 100-point composite (weight × sub-score).
- Cash flow +11.4/30.0
- ARV discount +7.5/15.0
- 1% rule +7.2/10.0
- DSCR +3.3/10.0
- Livability +3.1/5.0
- Schools +3.0/10.0
- Rent growth +2.5/5.0
- Condition / age +2.5/5.0
- Appreciation +0.0/10.0
$111,995
🖨 Deal sheet (PDF) 📄 Offer letter ✓ Due diligence
Listing remarks
The Blue Spruce community offers country living and city conveniences without the hustle and bustle. The Blue Spruce community includes 216 modern home sites, along with premier amenities. Mature trees line the community streets and residents enjoy a new playground, a clubhouse equipped with a full kitchen and billiards. Centrally located in West Virginia, Blue Spruce is a quiet, well-maintained neighborhood close to downtown Huntington, schools, shopping, hospitals, entertainment and more. Milton is home to the historic Mud River Covered Bridge Major nearby employers include Mountain Health Network, Marshall University, Cabell County Board of Education, University Physicians & Surgeo
Key facts
- Close to schools
- Billiards
- Modern home sites
Tags
Property features AI
Finance
- Other: Address: 2208 Kirby Rd, Milton WV 25541; Listing status: Active; List price: 111995
- HOA & community: Association fee of 345
Exterior
- Home design: Single-family plan home
- Exterior features: Living area of 2027
Interior
- Bedrooms: 5 bedrooms
- Bathrooms: 3 bathrooms
- Interior features: Plan home (Pinnacle - Blue Spruce)
Neighborhood map
What this means for you Summary
Snapshot
- This is a 5-bed/3.0-bath manufactured listed at $112k.
Deal economics
- At list price, monthly cash flow is $-39 ($-469/yr) — negative.
- To cash-flow at today's rent, offer at most $106k (5.1% below list).
- Meets the 1% rule at list price ($1k rent vs $112k).
- Recommended offer: $99k (12.0% below list) — sets the bar for market timing.
- Cap rate 5.9% vs local median 4.0% in Milton — top-decile yield for the area; either an underpriced asset or a hidden risk that comps aren't pricing in. Stress-test before assuming the spread holds.
Location & tenants
- Location reads 61/100 on livability (#197 in WV) — a middle-class / working-renter tenant base. Strengths: crime A+, cost of living A+; Watch: schools D, amenities F, commute F.
- Cabell County Schools (urban): math 31% / reading 42% proficiency, ranked #13 of 55 in WV (top 24%) — families likely to look elsewhere, expect single-tenant / working-renter base with shorter leases.
- Market conditions: 65 active listings in the ZIP; 61 units permitted in Cabell County in 2024 (5 in 5+ unit buildings).
Forward outlook
- Local home prices are declining (-3.0%/yr); year-one equity from $774 of loan paydown is wiped out by about $3k of value loss. Plan a longer hold.
Negotiation context
- It's been on market 323 days — a 12% lower offer ($99k) is reasonable based on typical stale-listing flexibility.
Risks & watch-outs
- Watch-outs: HOA is 25% of rent.
Questions for the listing agent
- What do current leases actually rent for vs. the listed asking? Can we see a recent rent roll and the last 12 months of T-12 income?
- It's been on market 323 days. Have you received any prior offers? Is the seller open to a 12% concession, seller financing, or rate buy-down credit?
- What does the HOA fee cover, when was the last increase, and are there any pending special assessments or reserve-fund shortfalls?
- Why hasn't it sold? Are there any deal-killer items the seller is aware of (foundation, flood, title, zoning, code violations)?
- Is there a deadline driving the sale (1031 exchange, divorce, estate, relocation)? That informs how much negotiation room exists.
- Schools are D-rated, which usually means shorter tenancies and higher turnover. Who's the typical renter profile here, and what's been the actual vacancy rate?
- The area grade is low — what's the realistic commute time and amenity access for the typical tenant pool here? Any planned neighborhood developments (good or bad) we should know about?
- What's the average days-on-market for RENTAL listings here right now (not sales)? A rising rental-DOM trend means longer vacancies and softer asking-rent achievability than the comps imply.
- What's the recent tenant-quality profile in this submarket — average credit score on applications, eviction rate, late-payment / NSF rate, and stable-employment percentage? A property-management company in the area should have these aggregated.
- How much new for-sale + rental construction is in the pipeline within 1–3 miles? Heavy new supply typically softens prices + rents 12–24 months out; constrained supply supports both.
Investment metrics
- 1% rule
- 1.22% ✓
- Cap rate
- 5.87%
- Cash-on-cash
- -1.50%
- DSCR
- 0.93
- GRM
- 6.8
CMA / ARV
No comps found within radius.
Projected returns pro-forma
-3.0% appreciation · 3.0% rent growth · sell at horizon
- IRR
- -18.5%
- Equity multiple
- 0.35×
- Total profit
- $-20,407
- Equity at exit
- $16,699
- IRR
- -10.4%
- Equity multiple
- 0.36×
- Total profit
- $-20,033
- Equity at exit
- $9,683
Cash invested: $31,359 (down + closing). Projections, not guarantees.
Landlord ↔ Tenant lean methodology
- Overall (STATE)
- 83 Strongly Landlord-Friendly
- State West Virginia
- 83 Strongly Landlord-Friendly · R+22
- County
- — inherits STATE
- City
- — inherits STATE
ZIP-level market 25541
- Home prices YoY
- -20.2%
- Active inventory
- 65
- Price-to-rent
- 6.8×
Monthly cashflow live
- Estimated rent
- $1,367 medium interval (Pro) →
- Mortgage (P&I)
- −$587
- Tax est. 1.5%
- −$140 /mo · $1,680/yr
- Insurance
- −$47
- HOA
- −$345
- Vacancy / Maint / Mgmt
- −$287
- Net cashflow
- $-39
Break-even live
Sensitivity live
| Price | -10% $38 | -5% $0 | +0% $-39 | +5% $-78 | +10% $-117 |
|---|---|---|---|---|---|
| Rent | -10% $-147 | -5% $-93 | +0% $-39 | +5% $15 | +10% $69 |
| Rate | -1.0pp $17 | -0.5pp $-11 | base $-39 | +0.5pp $-68 | +1.0pp $-98 |
UW: 25.0% down · 7.5% · 30yr · 1.5% tax · 5.0% vac · 8.0% maint · 8.0% mgmt
Financing live
Cash to close
- Down payment
- $27,999
- Closing costs
- $3,360
- Reserves months
- —
- Total cash needed
- —
Loan-product check · same deal, 3 products live
Conventional
25% down · 7.5% · 30yr
- Down + closing
- —
- Monthly P&I
- —
- Monthly cashflow
- —
- DSCR
- —
- Eligible?
- —
Personal DTI + credit; lowest rate.
DSCR
20% down · 8.5% · 30yr
- Down + closing
- —
- Monthly P&I
- —
- Monthly cashflow
- —
- DSCR
- —
- Eligible?
- —
No personal income docs; deal must DSCR.
Hard money
10% down · 12.0% · 12mo
- Down + closing
- —
- Monthly P&I
- —
- Monthly cashflow
- —
- DSCR
- —
- Eligible?
- —
Short-term bridge; refi at stabilization.
HOA detail
- Monthly dues
- $345 · $4,140/yr
Listing history 17 events
-
2026-06-21days on market $111,995 Active 323 DOM
-
2026-06-19days on market $111,995 Active 321 DOM
-
2026-06-18days on market $111,995 Active 320 DOM
-
2026-06-17days on market $111,995 Active 319 DOM
-
2026-06-16days on market $111,995 Active 318 DOM
-
2026-06-15days on market $111,995 Active 317 DOM
-
2026-06-14days on market $111,995 Active 315 DOM
-
2026-06-12days on market $111,995 Active 314 DOM
-
2026-06-09days on market $111,995 Active 311 DOM
-
2026-06-08days on market $111,995 Active 310 DOM
-
2026-06-07days on market $111,995 Active 309 DOM
-
2026-06-05days on market $111,995 Active 306 DOM
-
2026-06-03days on market $111,995 Active 305 DOM
-
2026-06-02days on market $111,995 Active 304 DOM
-
2026-06-01days on market $111,995 Active 303 DOM
-
2026-05-31days on market $111,995 Active 302 DOM
-
2026-05-30days on market $111,995 Active 301 DOM
ⓘ Source: listings_history table (triggers on properties + properties_extension) + one-shot
backfill from property_details.listing_events for pre-trigger history.
Nearby sold comps map
Loading sold comps map…
Walkable amenities ~0.75 mi
Loading nearby amenities…
Taxation est. · year 1
- Rental income
- $16,403
- − Mortgage interest
- −$6,273
- − Property taxes
- −$1,680
- − Insurance
- −$560
- − Repairs & maintenance
- −$1,312
- − Management
- −$1,312
- − HOA
- −$4,140
- − Depreciation
- −$3,258
- Taxable loss
- −$2,133
- Est. tax savings @ 24.0%
- +$512
- After-tax cash flow
- $42/yr
For passive investors: Depreciation is non-cash, so a rental often shows a tax loss while cash-flowing — sheltering income. Rental losses are passive: they offset passive income freely, and up to $25,000/yr can offset ordinary (W-2) income if you actively participate and your MAGI is under $100k (phasing out to $0 by $150k); unused losses carry forward. On sale, claimed depreciation is recaptured at up to 25%, and gains may owe capital-gains tax (a 1031 exchange can defer both). Figures are a year-1 estimate at your 24.0% rate — not tax advice; consult a CPA.
Schools (NCES district)
- District
- Cabell County Schools
- NCES district ID
- 5400180
- Math proficiency
- 31% ▼ -7.00%
- Reading proficiency
- 42% ▼ -6.00%
- Median HH income
- $36,426
- Composite
- 30.26/100
- National rank
- #6285
- State rank
- #13 of 55 in WV
Livability — Milton
- Score
- 61/100
- State rank
- #197
- US rank
- #17658
Category grades
Schools grade is shown separately in the Schools card above.
Census & demographics
- Population (ZIP)
- 9,360
Population outlook (Cabell County) Hauer SSP2
- Today (2025)
- 97,574 people
- By 2030
- 98,060 · +0.5%
- By 2040
- 98,817 · +1.3%
- By 2050
- 100,185 · +2.7%
- By 2075
- 105,895 · +8.5%
- By 2100
- 105,948 · +8.6%
Race, ethnicity, and origin ACS 2023
- Neighborhood character
- Predominantly White (97%)
- Race & ethnicity
- White 97% Two or more races 1%
- Common ancestry
- Serbian 2% Slovak 2% Iranian 1%
- Foreign-born
- 1% · Vietnam
Political lean MEDSL · Cabell
- 2024 margin
- Strong R (+21.9) · D 38.0% · R 59.9% · Other 2.0%
- 2008→2024 swing
- -11.8pp toward R · 2008: -10.1pp · 2024: -21.9pp
- All cycles
- 2024: R+21.9 2020: R+18.0 2016: R+25.5 2012: R+13.9 2008: R+10.1
Not yet ingested
- Civics
- —
Market trends
- HPI YoY
- ▼ -43.35%
- Current HPI
- 171.0131
- Rent YoY
- —
- Metro
- —
- State GDP YoY
- —
- F500 in state
- 0
Cash-flow waterfall
monthlySold comps — $/sqft
last 12 mo · ≤1 miLoading sold comps…