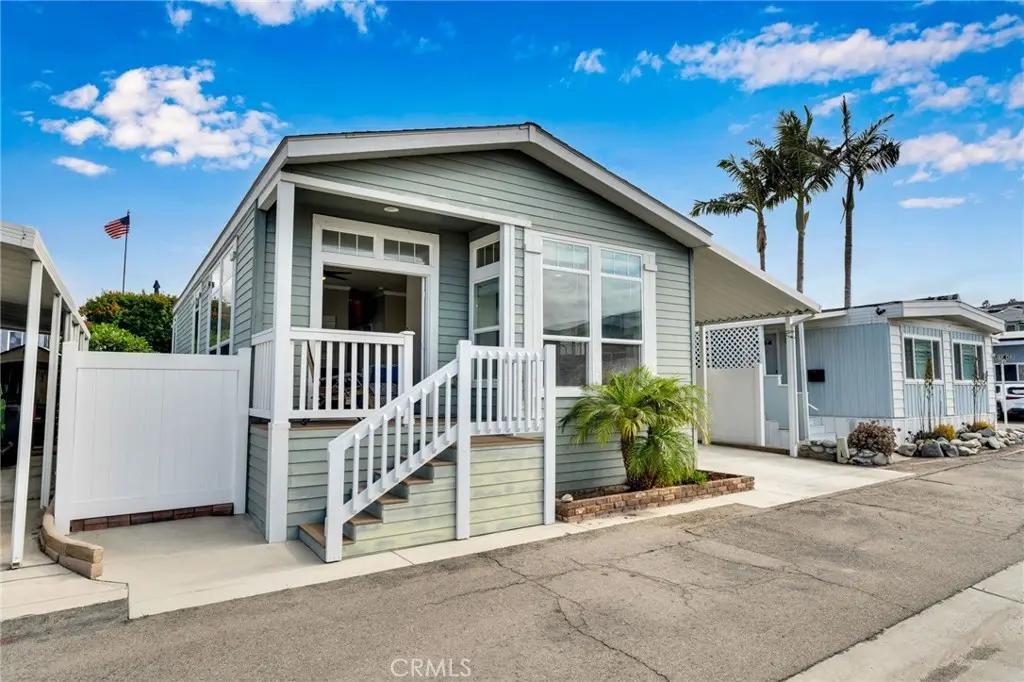
106 Pacific · San Clemente, CA
Flood risk 1/10 · Minimal
- FEMA flood zone
- X (unshaded)
- Chance of flooding over 30 yrs
- 0.0%
- Est. flood insurance / yr
- $507 – $1,088
Fire risk 1/10 · Minimal
- Est. fire insurance / yr
- $659 – $1,223
Heat risk 5/10 · Moderate
- Hot days now (above 85°F)
- 7 days/yr
- Hot days in 30 yrs
- 22 days/yr
Wind risk 1/10 · Minimal
- Chance of severe wind over 30 yrs
- —
Air-quality risk 4/10 · Minor
- Unhealthy air days now
- 6 days/yr
- Unhealthy air days in 30 yrs
- 6 days/yr
Risk factors via First Street. Map © Google.
Why this score? — see what drove the B grade
The composite is a weighted blend of 9 inputs, each scored 0–100. Each bar is that input's sub-score; the figure is the points it added to the 100-point composite (weight × sub-score).
- Cash flow +30.0/30.0
- 1% rule +10.0/10.0
- DSCR +10.0/10.0
- ARV discount +7.5/15.0
- Schools +5.7/10.0
- Livability +3.2/5.0
- Rent growth +3.1/5.0
- Condition / age +2.5/5.0
- Appreciation +0.0/10.0
$299,900
🖨 Deal sheet (PDF) 📄 Offer letter ✓ Due diligence
Listing remarks MLS
Welcome to coastal living in the heart of San Clemente! This charming two-bedroom, two-bathroom manufactured home is located in the highly sought-after 55+ community, Capo Beach Cottages, just a short walk from the Pacific Ocean. Step inside the home to find an inviting open-concept layout, where natural light pours through the many doors and windows. The kitchen features crisp white cabinetry, granite countertops, stainless steel appliances, and a convenient bar seating area! This makes it the perfect spot for casual meals or entertaining. The crown molding and matching finishes throughout the home create a cohesive, polished look that showcases the pride of ownership! French-style tandem doors open to a front patio area, an ideal spot to sip your morning coffee or enjoy the cool ocean breeze. The primary suite offers its own ensuite bathroom with a walk-in shower, plenty of counter space, and double closets for ample storage. The second bedroom and bath provide the perfect setup for guests or a home office. A separate laundry/mudroom provides extra storage and easy access to the exterior, making everyday living simple and efficient. This vibrant 55+ community offers resort-style amenities including a sparkling pool, clubhouse, BBQ area, and more! All surrounded by swaying palm trees and the unmistakable California sunshine. With two covered parking spaces and an unbeatable location near the beach, this home truly captures the best of coastal retirement living. Be sure to check out the 3D tour and experience this beautiful home for yourself!
Key facts
- Bar seating area
- Granite countertops
- Front patio area
Tags
Neighborhood map
What this means for you Summary
Snapshot
- This is a 2-bed/2.0-bath manufactured listed at $300k.
Deal economics
- At list price, monthly cash flow is $2k ($21k/yr) — positive.
- The deal already cash-flows at list — no discount required.
- Meets the 1% rule at list price ($5k rent vs $300k).
- Recommended offer: $273k (9.0% below list) — sets the bar for market timing.
- Cap rate 13.2% vs local median 1.5% in San Clemente — top-decile yield for the area; either an underpriced asset or a hidden risk that comps aren't pricing in. Stress-test before assuming the spread holds.
Location & tenants
- Location reads 63/100 on livability (#473 in CA) — a middle-class / working-renter tenant base. Strengths: employment A+, schools A-, crime B+; Watch: amenities D+, commute F, cost of living F.
- Capistrano Unified (suburban): math 50% / reading 72% proficiency, ranked #64 of 517 in CA (top 12%) — acceptable for families but not a draw, mixed tenant base, ~2y average lease; only 19% free/reduced lunch — higher-income household profile.
- Market conditions: Rents rising (+2.5%/yr); 112 active listings in the ZIP; 26 comparable units currently listed for rent nearby; rentals lingering (median 45d on market — plan ~5-8 weeks vacancy on turnover, expect pricing pressure); 50% of comp listings sitting > 30 days — soft ceiling on asking rent; high-income renter base; 6,974 units permitted in Orange County in 2024 (3,839 in 5+ unit buildings).
- At $4,812/mo this rent would consume 52% of the median local household income ($112k/yr) (locally 2025% of renters already pay >50% of income on rent) — very limited rent-growth headroom before tenants either downsize or default.
Forward outlook
- Local home prices are declining (-3.0%/yr); year-one equity from $2k of loan paydown is wiped out by about $9k of value loss. Plan a longer hold.
- Orange County population projected at +14% by 2050 — modest demand growth; plan on rents tracking national, not racing it.
- At projected returns (-3.0% appreciation + 2.5% rent growth), your $84k cash investment doubles in ~6 years — after that, you're playing with house money.
Negotiation context
- It's been on market 100 days — a 9% lower offer ($273k) is reasonable based on typical stale-listing flexibility.
- 6 sale attempts since 6y ago with the ask held roughly flat each time — persistent listings suggest the price (not the market) is what's stuck; bring a comps-based counter.
Risks & watch-outs
- Climate carrying-cost: extreme-heat days projected 7→22/yr by 2055 (HVAC capex compounding) — expect insurance premiums to compound above CPI over the hold.
Questions for the listing agent
- It's been on market 100 days. Have you received any prior offers? Is the seller open to a 9% concession, seller financing, or rate buy-down credit?
- Why hasn't it sold? Are there any deal-killer items the seller is aware of (foundation, flood, title, zoning, code violations)?
- Is there a deadline driving the sale (1031 exchange, divorce, estate, relocation)? That informs how much negotiation room exists.
- Schools are A-rated — typically a magnet for longer-tenancy family renters. What's the average tenant stay here, and is there a school-zone premium baked into asking?
- What's the average days-on-market for RENTAL listings here right now (not sales)? A rising rental-DOM trend means longer vacancies and softer asking-rent achievability than the comps imply.
- What's the recent tenant-quality profile in this submarket — average credit score on applications, eviction rate, late-payment / NSF rate, and stable-employment percentage? A property-management company in the area should have these aggregated.
- How much new for-sale + rental construction is in the pipeline within 1–3 miles? Heavy new supply typically softens prices + rents 12–24 months out; constrained supply supports both.
Investment metrics
- 1% rule
- 1.60% ✓
- Cap rate
- 13.21%
- Cash-on-cash
- 24.70%
- DSCR
- 2.10
- GRM
- 5.2
CMA / ARV
- ARV (median comp)
- $1,625,000
- List price
- $299,900
- Delta
- -81.54%
- Verdict
- UNDERPRICED
- Comps
- 7 within 1.0 mi
Show comp detail 8 sales within ~0.75 mi
| Address | Dist | Beds/Ba | Sqft | Sold | Price | $/sf | Match |
|---|---|---|---|---|---|---|---|
| 502 Ebb Tide Dr | 0.11mi | 2/2.0 | 1,440 (+3%) | 8mo | $499,000 | $347 | 84 |
| 401 Ebb Tide Dr #401 | 0.11mi | 2/2.0 | 1,344 (-4%) | 8mo | $441,500 | $328 | 81 |
| 101 Ocean Dr | 0.05mi | 3/2.0 (+1) | 1,400 (0%) | 14mo | $450,000 | $321 | 81 |
| 603 Sea Breeze Dr #14 | 0.12mi | 3/2.0 (+1) | 1,344 (-4%) | 22mo | $270,000 | $201 | 64 |
| 1880 N El Camino Real #56 | 0.54mi | 3/2.0 (+1) | 1,440 (+3%) | 9mo | $2,225,000 | $1,545 | 57 |
| 1880 N El Camino Real #41 | 0.54mi | 3/2.0 (+1) | 1,344 (-4%) | 12mo | $2,440,000 | $1,815 | 53 |
| 1880 N El Camino Real #14 | 0.54mi | 3/2.0 (+1) | 1,270 (-9%) | 14mo | $2,825,000 | $2,224 | 42 |
| 1880 N El Camino Real #72 | 0.54mi | 3/2.0 (+1) | 1,200 (-14%) | 15mo | $2,300,000 | $1,917 | 34 |
Match score weights: distance 35% · size 25% · config 20% · recency 20%. Top-matched comps best support the ARV.
Projected returns pro-forma
-3.0% appreciation · 2.54% rent growth · sell at horizon
- IRR
- 17.6%
- Equity multiple
- 1.71×
- Total profit
- $59,360
- Equity at exit
- $44,716
- IRR
- 25.7%
- Equity multiple
- 3.20×
- Total profit
- $184,745
- Equity at exit
- $25,930
Cash invested: $83,972 (down + closing). Projections, not guarantees.
Landlord ↔ Tenant lean methodology
- Overall (STATE)
- 18 Strongly Tenant-Friendly
- State California
- 18 Strongly Tenant-Friendly · D+13
- County
- — inherits STATE
- City
- — inherits STATE
ZIP-level market 92672
- Rents YoY
- 2.5%
- Active inventory
- 112
- Price-to-rent
- 5.2×
Monthly cashflow live
- Estimated rent
- $4,812 high interval (Pro) →
- Mortgage (P&I)
- −$1,573
- Tax est. 1.5%
- −$375 /mo · $4,498/yr
- Insurance
- −$125
- HOA
- −$0
- Vacancy / Maint / Mgmt
- −$1,010
- Net cashflow
- $1,729
Break-even live
Sensitivity live
| Price | -10% $1,936 | -5% $1,832 | +0% $1,729 | +5% $1,625 | +10% $1,521 |
|---|---|---|---|---|---|
| Rent | -10% $1,349 | -5% $1,539 | +0% $1,729 | +5% $1,919 | +10% $2,109 |
| Rate | -1.0pp $1,880 | -0.5pp $1,805 | base $1,729 | +0.5pp $1,651 | +1.0pp $1,572 |
UW: 25.0% down · 7.5% · 30yr · 1.5% tax · 5.0% vac · 8.0% maint · 8.0% mgmt
Financing live
Cash to close
- Down payment
- $74,975
- Closing costs
- $8,997
- Reserves months
- —
- Total cash needed
- —
Loan-product check · same deal, 3 products live
Conventional
25% down · 7.5% · 30yr
- Down + closing
- —
- Monthly P&I
- —
- Monthly cashflow
- —
- DSCR
- —
- Eligible?
- —
Personal DTI + credit; lowest rate.
DSCR
20% down · 8.5% · 30yr
- Down + closing
- —
- Monthly P&I
- —
- Monthly cashflow
- —
- DSCR
- —
- Eligible?
- —
No personal income docs; deal must DSCR.
Hard money
10% down · 12.0% · 12mo
- Down + closing
- —
- Monthly P&I
- —
- Monthly cashflow
- —
- DSCR
- —
- Eligible?
- —
Short-term bridge; refi at stabilization.
Rent comps 26 comps
| Address | Beds | Baths | Sqft | Rent | $/sqft | DOM | Units | Dist |
|---|---|---|---|---|---|---|---|---|
| 2806 Camino Capistrano Unit 26D San Clemente, CA | 3.0 | 2.0 | 1546 | $5,750 | $3.72 | 45d | 1 | 0.28mi |
| 2920 Camino Capistrano Unit 9D San Clemente, CA | 3.0 | 2.0 | 1546 | $5,700 | $3.69 | 45d | 1 | 0.32mi |
| 35697 Beach Rd Capistrano Beach, CA | 2.0 | 1.0 | 1012 | $25,000 | $24.70 | 13d | 1 | 0.40mi |
| 35531 Beach Rd Capistrano Beach, CA | 3.0 | 2.0 | 1052 | $6,500 | $6.18 | 25d | 1 | 0.71mi |
| 515 Avenida Vaquero San Clemente, CA | 1.0–2.0 | 1.0–2.0 | 833 | $4,374 | $5.25 | 0d | 9 | 0.73mi |
| 3341 Calle La Veta San Clemente, CA | 2.0 | 2.0 | 1413 | $7,000 | $4.95 | 45d | 1 | 0.86mi |
| 2459 Corte Merlango San Clemente, CA | 3.0 | 1.0–2.0 | 763 | $3,400 | $4.46 | 0d | 10 | 0.87mi |
| 3328 Paseo Halcon San Clemente, CA | 3.0 | 2.0 | 1560 | $4,700 | $3.01 | 23d | 1 | 0.93mi |
| 3407 Via Loro San Clemente, CA | 3.0 | 2.0 | 1526 | $5,000 | $3.28 | 0d | 1 | 0.96mi |
| 2309 Calle Balandra San Clemente, CA | 3.0 | 2.5 | 1657 | $4,500 | $2.72 | 45d | 1 | 0.96mi |
| 2309 Calle Balandra San Clemente, CA | 3.0 | 3.0 | 1657 | $4,500 | $2.72 | 45d | 1 | 0.96mi |
| 3386 Calle La Veta San Clemente, CA | 3.0 | 2.5 | 1754 | $8,200 | $4.68 | 45d | 1 | 0.97mi |
| 1533 Buena Vista San Clemente, CA | 3.0 | 2.5 | 1500 | $4,995 | $3.33 | 45d | 1 | 1.11mi |
| 324 Plaza Estival San Clemente, CA | 3.0 | 2.5 | 1590 | $3,995 | $2.51 | 45d | 1 | 1.11mi |
| 1524 Buena Vis Unit A San Clemente, CA | 3.0 | 2.0 | 1250 | $4,250 | $3.40 | 20d | 1 | 1.15mi |
| 484 Plaza Estival San Clemente, CA | 3.0 | 2.5 | 1651 | $4,500 | $2.73 | 45d | 1 | 1.16mi |
| 106 Dije Ct Unit C San Clemente, CA | 3.0 | 2.0 | 1010 | $4,395 | $4.35 | 23d | 1 | 1.23mi |
| 26920 Calle Dolores Unit B Dana Point, CA | 3.0 | 2.5 | 1500 | $5,675 | $3.78 | 9d | 1 | 1.28mi |
| 1509 Avenida de la Estrella San Clemente, CA | 3.0 | 2.0 | 1221 | $4,950 | $4.05 | 25d | 1 | 1.30mi |
| 27022 Calle Dolores Capistrano Beach, CA | 3.0 | 2.0 | 1700 | $5,500 | $3.24 | 25d | 1 | 1.34mi |
| 1202 Buena Vis Apt 1 San Clemente, CA | 2.0 | 1.0 | 900 | $3,500 | $3.89 | 18d | 1 | 1.36mi |
| 1201 Buena Vis Unit C San Clemente, CA | 2.0 | 1.5 | 1400 | $4,100 | $2.93 | 6d | 1 | 1.36mi |
| 3502 Calle Verano San Clemente, CA | 3.0 | 2.0 | 1464 | $5,000 | $3.42 | 45d | 1 | 1.40mi |
| 3626 Calle Casino San Clemente, CA | 3.0 | 2.5 | 1517 | $4,100 | $2.70 | 45d | 1 | 1.42mi |
| 1001 Buena Vista #6 San Clemente, CA | 2.0 | 2.5 | 1656 | $5,950 | $3.59 | 45d | 1 | 1.47mi |
| 248 Avenida Del Poniente Unit C San Clemente, CA | 2.0 | 1.0 | 1000 | $3,350 | $3.35 | 45d | 1 | 1.48mi |
Listing history 33 events
-
2026-06-21days on market $299,900 Active 100 DOM
-
2026-06-18days on market $299,900 Active 97 DOM
-
2026-06-17days on market $299,900 Active 96 DOM
-
2026-06-16days on market $299,900 Active 95 DOM
-
2026-06-15days on market $299,900 Active 94 DOM
-
2026-06-13days on market $299,900 Active 92 DOM
-
2026-06-13days on market $299,900 Active 91 DOM
-
2026-06-09days on market $299,900 Active 88 DOM
-
2026-06-08days on market $299,900 Active 87 DOM
-
2026-06-07days on market $299,900 Active 86 DOM
-
2026-06-04days on market $299,900 Active 83 DOM
-
2026-06-03days on market $299,900 Active 82 DOM
-
2026-06-02days on market $299,900 Active 81 DOM
-
2026-06-01days on market $299,900 Active 80 DOM
-
2026-05-31days on market $299,900 Active 79 DOM
-
2026-03-13$299,900 Active 1568-char remark
Show marketing remark (1568 chars)
Welcome to coastal living in the heart of San Clemente! This charming two-bedroom, two-bathroom manufactured home is located in the highly sought-after 55+ community, Capo Beach Cottages, just a short walk from the Pacific Ocean. Step inside the home to find an inviting open-concept layout, where natural light pours through the many doors and windows. The kitchen features crisp white cabinetry, granite countertops, stainless steel appliances, and a convenient bar seating area! This makes it the perfect spot for casual meals or entertaining. The crown molding and matching finishes throughout the home create a cohesive, polished look that showcases the pride of ownership! French-style tandem doors open to a front patio area, an ideal spot to sip your morning coffee or enjoy the cool ocean breeze. The primary suite offers its own ensuite bathroom with a walk-in shower, plenty of counter space, and double closets for ample storage. The second bedroom and bath provide the perfect setup for guests or a home office. A separate laundry/mudroom provides extra storage and easy access to the exterior, making everyday living simple and efficient. This vibrant 55+ community offers resort-style amenities including a sparkling pool, clubhouse, BBQ area, and more! All surrounded by swaying palm trees and the unmistakable California sunshine. With two covered parking spaces and an unbeatable location near the beach, this home truly captures the best of coastal retirement living. Be sure to check out the 3D tour and experience this beautiful home for yourself!
-
2026-03-12historical
-
2025-09-15$299,900 Active
-
2024-05-21soldstatus $267,000 Closed Sale
-
2024-05-14status Pending Sale
-
2024-04-20historical Active Under Contract
-
2024-03-14$270,000 Active
-
2024-03-11historical $270,000
-
2023-10-30historical
-
2023-07-13price $315,000
-
2023-01-14price $335,000
-
2023-01-13$335 Active
-
2022-03-25soldstatus $265,000 Closed Sale
-
2022-03-20status Pending Sale
-
2022-03-11historical Active Under Contract
-
2022-03-10$265,000 Active
-
2021-03-13historical
-
2020-12-09$225,000 Active
ⓘ Source: listings_history table (triggers on properties + properties_extension) + one-shot
backfill from property_details.listing_events for pre-trigger history.
Climate risk First Street
- Flood 1/10 Low FEMA zone X (unshaded) · 0% chance over 30 yrs
- Wildfire 1/10 Low
- Heat 5/10 Major 7 d/yr ≥85°F today · 22 d/yr by 30 yrs out
- Wind 1/10 Low
- Air quality 4/10 Moderate 6 unhealthy d/yr today · 6 by 30 yrs out
Nearby sold comps map
Loading sold comps map…
Walkable amenities ~0.75 mi
Loading nearby amenities…
Taxation est. · year 1
- Rental income
- $57,740
- − Mortgage interest
- −$16,799
- − Property taxes
- −$4,498
- − Insurance
- −$1,500
- − Repairs & maintenance
- −$4,619
- − Management
- −$4,619
- − Depreciation
- −$8,724
- Taxable income
- $16,980
- Est. tax owed @ 24.0%
- −$4,075
- After-tax cash flow
- $16,669/yr
For passive investors: Depreciation is non-cash, so a rental often shows a tax loss while cash-flowing — sheltering income. Rental losses are passive: they offset passive income freely, and up to $25,000/yr can offset ordinary (W-2) income if you actively participate and your MAGI is under $100k (phasing out to $0 by $150k); unused losses carry forward. On sale, claimed depreciation is recaptured at up to 25%, and gains may owe capital-gains tax (a 1031 exchange can defer both). Figures are a year-1 estimate at your 24.0% rate — not tax advice; consult a CPA.
Schools (NCES district)
- District
- Capistrano Unified
- NCES district ID
- 0607440
- Math proficiency
- 50% ▼ -11.00%
- Reading proficiency
- 72% ▲ 2.00%
- Median HH income
- $99,673
- Composite
- 56.56/100
- National rank
- #1147
- State rank
- #64 of 517 in CA
Livability — San Clemente
- Score
- 63/100
- State rank
- #473
- US rank
- #16045
Category grades
Schools grade is shown separately in the Schools card above.
Census & demographics
- Census place
- San Clemente, CA
- County
- Orange County · 3,096,323 people
- City population
- 66,345
- Metro
- Los Angeles-Long Beach-Anaheim, CA
- Population (ZIP)
- 36,939
- Household income
- $111,989
- Rent vs Own
- Severe rent burden
- 2025.0
Population outlook (Orange County) Hauer SSP2
- Today (2025)
- 3,477,456 people
- By 2030
- 3,613,117 · +3.9%
- By 2040
- 3,835,945 · +10.3%
- By 2050
- 3,968,736 · +14.1%
- By 2075
- 4,097,053 · +17.8%
- By 2100
- 3,903,633 · +12.3%
Race, ethnicity, and origin ACS 2023
- Neighborhood character
- Predominantly White (70%)
- Race & ethnicity
- White 70% Hispanic / Latino 19% Two or more races 14% Asian 3% Black 2%
- Hispanic origin (detail)
- Mexican 14%
- Common ancestry
- Italian 4% Lithuanian 3% Portuguese 3%
- Foreign-born
- 11% · Canada, China
- Languages at home
- 83% English-only · Spanish 11% Other Indo-European 2% Arabic 1%
Political lean MEDSL · Orange
- 2024 margin
- Toss-up / Even · D 49.7% · R 47.1% · Other 3.2%
- 2008→2024 swing
- +5.2pp toward D · 2008: -2.6pp · 2024: 2.6pp
- All cycles
- 2024: D+2.6 2020: D+9.0 2016: D+7.7 2012: R+8.3 2008: R+2.6
Not yet ingested
- Civics
- —
Market trends
- HPI YoY
- ▼ -813.78%
- Current HPI
- 537.8756
- Rent YoY
- ▲ 2.54%
- Metro
- Los Angeles-Long Beach-Anaheim, CA
- State GDP YoY
- ▲ 3.21%
- F500 in state
- 116
Industry mix (Fortune 500 HQ in CA)
| Industry | F500 HQs | Revenue |
|---|---|---|
| Technology | 27 | $1,492B |
|
||
| Financial Services | 3 | $174B |
|
||
| Retail | 3 | $44B |
|
||
| Insurance | 3 | $26B |
|
||
| Media / Entertainment | 2 | $115B |
|
||
| Pharmaceuticals / Biotech | 2 | $62B |
|
||
Price history
+33.3% since first listed18 events — show timeline
- 2026-03-13 Listed $299,900 CRMLS
- 2026-03-12 Listing Removed — CRMLS
- 2025-09-15 Listed $299,900 CRMLS
- 2024-05-21 Sold (MLS) $267,000 CRMLS
- 2024-05-14 Pending — CRMLS
- 2024-04-20 Contingent — CRMLS
- 2024-03-14 Listed $270,000 CRMLS
- 2024-03-11 Coming Soon $270,000 CRMLS
- 2023-10-30 Listing Removed — CRMLS
- 2023-07-13 Price Changed $315,000 CRMLS
- 2023-01-14 Price Changed $335,000 CRMLS
- 2023-01-13 Listed $335 CRMLS
- 2022-03-25 Sold (MLS) $265,000 CRMLS
- 2022-03-20 Pending — CRMLS
- 2022-03-11 Contingent — CRMLS
- 2022-03-10 Listed $265,000 CRMLS
- 2021-03-13 Listing Removed — CRMLS
- 2020-12-09 Listed $225,000 CRMLS
Property tax history
-2.1%/yrLatest (2018): $65 · +166.5% YoY. Source: county tax records.
Cash-flow waterfall
monthlySold comps — $/sqft
last 12 mo · ≤1 miLoading sold comps…