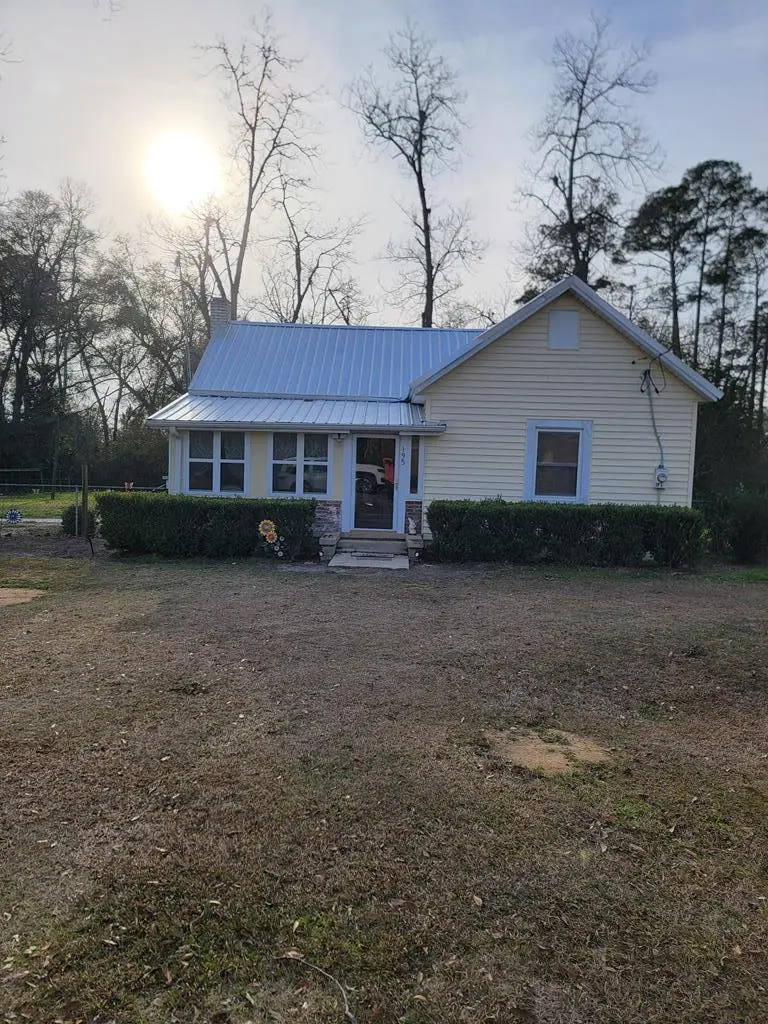
195 N Mattie Ave · Sycamore, GA
Flood risk 1/10 · Minimal
- FEMA flood zone
- X (unshaded)
- Chance of flooding over 30 yrs
- 0.0%
- Est. flood insurance / yr
- $507 – $1,088
Fire risk 3/10 · Minor
- Est. fire insurance / yr
- $963 – $1,789
Heat risk 7/10 · Major
- Hot days now (above 107°F)
- 7 days/yr
- Hot days in 30 yrs
- 19 days/yr
Wind risk 8/10 · Major
- Chance of severe wind over 30 yrs
- 96.0%
Air-quality risk 3/10 · Minor
- Unhealthy air days now
- 4 days/yr
- Unhealthy air days in 30 yrs
- 4 days/yr
Risk factors via First Street. Map © Google.
Why this score? — see what drove the B grade
The composite is a weighted blend of 9 inputs, each scored 0–100. Each bar is that input's sub-score; the figure is the points it added to the 100-point composite (weight × sub-score).
- Cash flow +27.1/30.0
- ARV discount +15.0/15.0
- DSCR +9.4/10.0
- 1% rule +6.6/10.0
- Appreciation +5.8/10.0
- Livability +3.3/5.0
- Rent growth +2.5/5.0
- Condition / age +2.5/5.0
- Schools +1.3/10.0
$99,900
🖨 Deal sheet (PDF) 📄 Offer letter ✓ Due diligence
Listing remarks
This is a great home for a first-time home buyer or and investor looking to expand their portfolio. This 2 bedroom/2 bath home is just what you are looking for. Most of the yard is fenced in, your children and pets will love it. The owner of this home has done a lot of work on the yard and home making it move in ready. If what you are looking for is a quite community, yet not too far away from a town with restaurants and shopping this home is for you. Its only 5 minutes from Ashburn and 20 minutes from Tifton. It has a nice enclosed front porch so you can enjoy the outdoors with the pesky South Georgia insects and bugs bothering you. This home is a must see!!
Key facts
- Fenced yard
- Move in ready
- Enclosed front porch
Tags
Property features AI
Exterior
- Utilities: Public water; Septic tank
- Home design: Single-family residence; Residential property; Zoned R-3
- Construction: Frame construction with vinyl siding; Metal roof
- Exterior features: Screened patio/porch; Chain link fencing; Shed(s)
Interior
- Kitchen: Electric oven; Electric range; Refrigerator; Freezer; Ice maker
- Bedrooms: Total rooms: 5
- Flooring: Carpet; Vinyl
- Bathrooms: 2 full bathrooms
- Heating & cooling: Central heating (electric); Central air; Ceiling fan(s)
- Interior features: Walk-in closet(s); Gas fireplace
- Laundry & utility: Washer; Dryer; Electric water heater
Neighborhood map
What this means for you Summary
Snapshot
- This is a 3-bed/1.0-bath single-family listed at $100k.
Deal economics
- At list price, monthly cash flow is $282 ($3k/yr) — positive.
- The deal already cash-flows at list — no discount required.
- Meets the 1% rule at list price ($1k rent vs $100k).
- Recommended offer: $97k (3.0% below list) — sets the bar for market timing.
Location & tenants
- Location reads 66/100 on livability (#193 in GA) — a middle-class / working-renter tenant base. Strengths: cost of living A+, housing A+, health & safety A+; Watch: amenities F, commute F, employment F.
- Turner County (town): math 14% / reading 18% proficiency, ranked #158 of 174 in GA (top 91%) — low school quality limits family demand, transient renter base, plan for 1-2y turnover; 74% free/reduced lunch — lower-income household profile, screen leases tightly.
- Zoned schools: Turner County Elementary School (math 27% / reading 23%, grade F, #745 of 1,228 statewide, top 61%, 591 students, 100% FRL); Turner County Middle School (math 6% / reading 12%, grade F, #438 of 470 statewide, top 93%, 242 students, 100% FRL); Turner County High School (math 8% / reading 22%, grade F, #297 of 424 statewide, top 74%, 356 students, 100% FRL) — zoned schools average 100% FRL vs 74% district-wide (26 pts higher); higher-poverty schools than district average — tighter screening recommended.
- Market conditions: 6 active listings in the ZIP; 9 units permitted in Turner County in 2024 (0 in 5+ unit buildings).
Forward outlook
- In year one you build about $2k of equity ($691 loan paydown + $2k appreciation (1.6% local appreciation)).
- Turner County population projected at -35% by 2050 — secular population decline; favor cash flow + early exit over multi-decade hold.
- At projected returns (1.6% appreciation + 3.0% rent growth), your $28k cash investment doubles in ~5 years — after that, you're playing with house money.
Negotiation context
- It's been on market 38 days — a 3% lower offer ($97k) is reasonable based on typical stale-listing flexibility.
- 7 sale attempts since 2y ago with the ask held roughly flat each time — persistent listings suggest the price (not the market) is what's stuck; bring a comps-based counter.
- Current owner paid $64k; list at $100k implies a 56% gain — meaningful room to come down on a strong offer.
Risks & watch-outs
- Watch-outs: built in 1932 — expect roof / HVAC / electrical / plumbing capex.
- Climate carrying-cost: severe wind risk, 96% chance of damaging wind over 30y; extreme-heat days projected 7→19/yr by 2055 (HVAC capex compounding) — expect insurance premiums to compound above CPI over the hold.
Questions for the listing agent
- It's been on market 38 days. Have you received any prior offers? Is the seller open to a 3% concession, seller financing, or rate buy-down credit?
- Built in 1932 — when were the roof, HVAC, electrical panel, plumbing, and water heater last replaced?
- Is there a deadline driving the sale (1031 exchange, divorce, estate, relocation)? That informs how much negotiation room exists.
- Schools are F-rated, which usually means shorter tenancies and higher turnover. Who's the typical renter profile here, and what's been the actual vacancy rate?
- What's the average days-on-market for RENTAL listings here right now (not sales)? A rising rental-DOM trend means longer vacancies and softer asking-rent achievability than the comps imply.
- What's the recent tenant-quality profile in this submarket — average credit score on applications, eviction rate, late-payment / NSF rate, and stable-employment percentage? A property-management company in the area should have these aggregated.
- How much new for-sale + rental construction is in the pipeline within 1–3 miles? Heavy new supply typically softens prices + rents 12–24 months out; constrained supply supports both.
Investment metrics
- 1% rule
- 1.16% ✓
- Cap rate
- 9.69%
- Cash-on-cash
- 12.12%
- DSCR
- 1.54
- GRM
- 7.2
CMA / ARV
- ARV (median comp)
- $123,046
- List price
- $99,900
- Delta
- -18.81%
- Verdict
- UNDERPRICED
- Comps
- 9 within 1.0 mi
Projected returns pro-forma
1.58% appreciation · 3.0% rent growth · sell at horizon
- IRR
- 15.4%
- Equity multiple
- 1.81×
- Total profit
- $22,699
- Equity at exit
- $37,143
- IRR
- 18.3%
- Equity multiple
- 3.33×
- Total profit
- $65,227
- Equity at exit
- $51,802
Cash invested: $27,972 (down + closing). Projections, not guarantees.
Landlord ↔ Tenant lean methodology
- Overall (STATE)
- 90 Strongly Landlord-Friendly
- State Georgia
- 90 Strongly Landlord-Friendly · R+3
- County
- — inherits STATE
- City
- — inherits STATE
ZIP-level market 31790
- Home prices YoY
- 1.1%
- Active inventory
- 6
- Price-to-rent
- 7.2×
Monthly cashflow live
- Estimated rent
- $1,161 medium interval (Pro) →
- Mortgage (P&I)
- −$524
- Tax from tax record
- −$69 /mo · $826/yr
- Insurance
- −$42
- HOA
- −$0
- Vacancy / Maint / Mgmt
- −$244
- Net cashflow
- $282
Break-even live
Sensitivity live
| Price | -10% $339 | -5% $311 | +0% $282 | +5% $254 | +10% $226 |
|---|---|---|---|---|---|
| Rent | -10% $191 | -5% $237 | +0% $282 | +5% $328 | +10% $374 |
| Rate | -1.0pp $333 | -0.5pp $308 | base $282 | +0.5pp $257 | +1.0pp $230 |
UW: 25.0% down · 7.5% · 30yr · 1.5% tax · 5.0% vac · 8.0% maint · 8.0% mgmt
Financing live
Cash to close
- Down payment
- $24,975
- Closing costs
- $2,997
- Reserves months
- —
- Total cash needed
- —
Loan-product check · same deal, 3 products live
Conventional
25% down · 7.5% · 30yr
- Down + closing
- —
- Monthly P&I
- —
- Monthly cashflow
- —
- DSCR
- —
- Eligible?
- —
Personal DTI + credit; lowest rate.
DSCR
20% down · 8.5% · 30yr
- Down + closing
- —
- Monthly P&I
- —
- Monthly cashflow
- —
- DSCR
- —
- Eligible?
- —
No personal income docs; deal must DSCR.
Hard money
10% down · 12.0% · 12mo
- Down + closing
- —
- Monthly P&I
- —
- Monthly cashflow
- —
- DSCR
- —
- Eligible?
- —
Short-term bridge; refi at stabilization.
Listing history 29 events
-
2026-06-21days on market $99,900 Active 38 DOM
-
2026-06-21days on market $99,900 Active 37 DOM
-
2026-06-18days on market $99,900 Active 35 DOM
-
2026-06-17days on market $99,900 Active 34 DOM
-
2026-06-16days on market $99,900 Active 33 DOM
-
2026-06-15days on market $99,900 Active 32 DOM
-
2026-06-13days on market $99,900 Active 30 DOM
-
2026-06-12days on market $99,900 Active 29 DOM
-
2026-06-09days on market $99,900 Active 26 DOM
-
2026-06-08days on market $99,900 Active 25 DOM
-
2026-06-07days on market $99,900 Active 24 DOM
-
2026-06-07days on market $99,900 Active 23 DOM
-
2026-06-04days on market $99,900 Active 20 DOM
-
2026-06-02days on market $99,900 Active 19 DOM
-
2026-06-01days on market $99,900 Active 18 DOM
-
2026-05-31days on market $99,900 Active 17 DOM
-
2026-05-31days on market $99,900 Active 16 DOM
-
2026-05-15$99,900 Active
-
2026-05-15$99,900 Active
-
2026-05-15$99,900 Active
-
2025-09-02price $95,000
-
2025-08-06price $110,000
-
2025-07-31status Active
-
2025-03-06$115,000 Active
-
2024-10-29price $118,000
-
2024-10-01status Active
-
2024-04-24price $120,000
-
2024-01-23$125,000 Active
-
2023-06-30soldstatus $64,000
ⓘ Source: listings_history table (triggers on properties + properties_extension) + one-shot
backfill from property_details.listing_events for pre-trigger history.
Tax reassessment forecast GA · Resets to sale price
- Current annual tax
- $826 · $69/mo
- Projected year-2 tax
- $919 · $77/mo
- Expected delta
- +$93/yr (+$8/mo · 11.3%)
ⓘ Screening estimate from a state-policy table — verify with the county assessor before closing.
Climate risk First Street
- Flood 1/10 Low FEMA zone X (unshaded) · 0% chance over 30 yrs
- Wildfire 3/10 Moderate
- Heat 7/10 Severe 7 d/yr ≥107°F today · 19 d/yr by 30 yrs out
- Wind 8/10 Severe 96% chance of damaging wind over 30 yrs
- Air quality 3/10 Moderate 4 unhealthy d/yr today · 4 by 30 yrs out
Nearby sold comps map
Loading sold comps map…
Walkable amenities ~0.75 mi
Loading nearby amenities…
Taxation est. · year 1
- Rental income
- $13,926
- − Mortgage interest
- −$5,596
- − Property taxes
- −$826
- − Insurance
- −$500
- − Repairs & maintenance
- −$1,114
- − Management
- −$1,114
- − Depreciation
- −$2,906
- Taxable income
- $1,870
- Est. tax owed @ 24.0%
- −$449
- After-tax cash flow
- $2,941/yr
For passive investors: Depreciation is non-cash, so a rental often shows a tax loss while cash-flowing — sheltering income. Rental losses are passive: they offset passive income freely, and up to $25,000/yr can offset ordinary (W-2) income if you actively participate and your MAGI is under $100k (phasing out to $0 by $150k); unused losses carry forward. On sale, claimed depreciation is recaptured at up to 25%, and gains may owe capital-gains tax (a 1031 exchange can defer both). Figures are a year-1 estimate at your 24.0% rate — not tax advice; consult a CPA.
Schools (NCES district)
- District
- Turner County
- NCES district ID
- 1305190
- Math proficiency
- 14% ▼ -7.00%
- Reading proficiency
- 18% ▼ -9.00%
- Median HH income
- $32,714
- Composite
- 12.94/100
- National rank
- #9578
- State rank
- #158 of 174 in GA
Livability — Sycamore
- Score
- 66/100
- State rank
- #193
- US rank
- #11925
Category grades
Schools grade is shown separately in the Schools card above.
Census & demographics
- Census place
- Sycamore, GA
- Population (ZIP)
- 2,648
Population outlook (Turner County) Hauer SSP2
- Today (2025)
- 6,561 people
- By 2030
- 5,905 · -10.0%
- By 2040
- 4,899 · -25.3%
- By 2050
- 4,246 · -35.3%
- By 2075
- 3,606 · -45.0%
- By 2100
- 3,471 · -47.1%
Race, ethnicity, and origin ACS 2023
- Neighborhood character
- Predominantly White (74%)
- Race & ethnicity
- White 74% Hispanic / Latino 13% Black 8% Two or more races 5%
- Hispanic origin (detail)
- Mexican 13%
- Common ancestry
- Romanian 2% Portuguese 1% Slovak 1%
- Foreign-born
- 7% · Canada
- Languages at home
- 90% English-only · Spanish 10%
Political lean MEDSL · Turner
- 2024 margin
- Strong R (+28.5) · D 35.6% · R 64.1%
- 2008→2024 swing
- -9.7pp toward R · 2008: -18.8pp · 2024: -28.5pp
- All cycles
- 2024: R+28.5 2020: R+24.8 2016: R+25.1 2012: R+14.6 2008: R+18.8
Not yet ingested
- Civics
- —
Market trends
- HPI YoY
- ▲ 1.58%
- Current HPI
- 151.1607
- Rent YoY
- —
- Metro
- —
- State GDP YoY
- ▲ 2.66%
- F500 in state
- 28
Industry mix (Fortune 500 HQ in GA)
| Industry | F500 HQs | Revenue |
|---|---|---|
| Paper / Packaging | 2 | $29B |
|
||
| Retail | 1 | $160B |
|
||
| Transportation / Logistics | 1 | $91B |
|
||
| Airlines | 1 | $62B |
|
||
| Consumer Goods | 1 | $47B |
|
||
| Utilities | 1 | $25B |
|
||
Price history
+56.1% since first listed12 events — show timeline
- 2026-05-15 Listed $99,900 TBOR
- 2026-05-15 Listed $99,900 TBOR
- 2026-05-15 Listed $99,900 TBOR
- 2025-09-02 Price Changed $95,000 TBOR
- 2025-08-06 Price Changed $110,000 TBOR
- 2025-07-31 Relisted — TBOR
- 2025-03-06 Listed $115,000 TBOR
- 2024-10-29 Price Changed $118,000 TBOR
- 2024-10-01 Relisted — TBOR
- 2024-04-24 Price Changed $120,000 TBOR
- 2024-01-23 Listed $125,000 TBOR
- 2023-06-30 Sold (Public Records) $64,000 Public Records
Property tax history
+3.6%/yrLatest (2025): $826 · +17.3% YoY. Source: county tax records.
Cash-flow waterfall
monthlySold comps — $/sqft
last 12 mo · ≤1 miLoading sold comps…