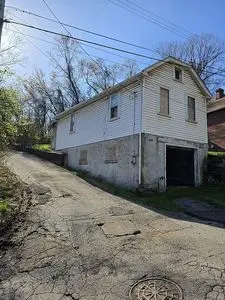
1321 Dunbar Ave · North Braddock, PA
Flood risk 1/10 · Minimal
- FEMA flood zone
- X (unshaded)
- Chance of flooding over 30 yrs
- 0.0%
- Est. flood insurance / yr
- $473 – $860
Fire risk 1/10 · Minimal
- Est. fire insurance / yr
- $511 – $949
Heat risk 3/10 · Minor
- Hot days now (above 97°F)
- 7 days/yr
- Hot days in 30 yrs
- 16 days/yr
Wind risk 2/10 · Minimal
- Chance of severe wind over 30 yrs
- —
Air-quality risk 4/10 · Minor
- Unhealthy air days now
- 5 days/yr
- Unhealthy air days in 30 yrs
- 7 days/yr
Risk factors via First Street. Map © Google.
Why this score? — see what drove the D+ grade
The composite is a weighted blend of 9 inputs, each scored 0–100. Each bar is that input's sub-score; the figure is the points it added to the 100-point composite (weight × sub-score).
- Cash flow +15.0/30.0
- ARV discount +7.5/15.0
- 1% rule +5.0/10.0
- DSCR +5.0/10.0
- Appreciation +4.2/10.0
- Livability +3.7/5.0
- Rent growth +2.5/5.0
- Condition / age +2.5/5.0
- Schools +1.8/10.0
$19,900
🖨 Deal sheet 📄 Offer letter ✓ Due diligence
Listing remarks
For sale by owner. This 2nd story studio over garage provides the perfect opportunity for passive income, a workshop, or a small starter home. The home has been gutted with the majority of the dirty work out of the way! Utilities include electric and brand new feed water line. The property is in a quiet neighborhood with friendly neighbors. Perfect fit for someone looking for a flip or a manageable project.
Key facts
- Quiet neighborhood
- 2nd story studio
- Built 1930
Tags
Neighborhood map
What this means for you Summary
Snapshot
- This is a 1-bed/1.0-bath single-family listed at $20k.
Deal economics
- At list price, monthly cash flow is $598 ($7k/yr) — positive.
- The deal already cash-flows at list — no discount required.
- Meets the 1% rule at list price ($916 rent vs $20k).
- Recommended offer: $20k (1.5% below list) — sets the bar for market timing.
Location & tenants
- Location reads 73/100 on livability (#550 in PA) — a middle-class / working-renter tenant base. Strengths: commute A+, cost of living A+, housing A+; Watch: schools F, amenities F, employment F.
- Woodland Hills SD (suburban): math 13% / reading 30% proficiency, ranked #486 of 539 in PA (top 90%) — low school quality limits family demand, transient renter base, plan for 1-2y turnover; 69% free/reduced lunch — lower-income household profile, screen leases tightly.
- Market conditions: 37 active listings in the ZIP; 14 comparable units currently listed for rent nearby; rentals lingering (median 44d on market — plan ~5-8 weeks vacancy on turnover, expect pricing pressure); 57% of comp listings sitting > 30 days — soft ceiling on asking rent; lower-income renter base — watch delinquency; 2,996 units permitted in Allegheny County in 2024 (1,588 in 5+ unit buildings).
Forward outlook
- Local home prices are declining (-1.6%/yr); year-one equity from $138 of loan paydown is wiped out by about $323 of value loss. Plan a longer hold.
- At projected returns (-1.6% appreciation + 3.0% rent growth), your $6k cash investment doubles in ~1 year — after that, you're playing with house money.
Negotiation context
- It's been on market 23 days — a 2% lower offer ($20k) is reasonable based on typical stale-listing flexibility.
- Current owner paid $6k; list at $20k implies a 246% gain — meaningful room to come down on a strong offer.
Risks & watch-outs
- Watch-outs: built in 1930 — expect roof / HVAC / electrical / plumbing capex.
Questions for the listing agent
- Built in 1930 — when were the roof, HVAC, electrical panel, plumbing, and water heater last replaced?
- Is there a deadline driving the sale (1031 exchange, divorce, estate, relocation)? That informs how much negotiation room exists.
- Schools are F-rated, which usually means shorter tenancies and higher turnover. Who's the typical renter profile here, and what's been the actual vacancy rate?
- The area grade is low — what's the realistic commute time and amenity access for the typical tenant pool here? Any planned neighborhood developments (good or bad) we should know about?
- What's the average days-on-market for RENTAL listings here right now (not sales)? A rising rental-DOM trend means longer vacancies and softer asking-rent achievability than the comps imply.
- What's the recent tenant-quality profile in this submarket — average credit score on applications, eviction rate, late-payment / NSF rate, and stable-employment percentage? A property-management company in the area should have these aggregated.
- How much new for-sale + rental construction is in the pipeline within 1–3 miles? Heavy new supply typically softens prices + rents 12–24 months out; constrained supply supports both.
Investment metrics
- 1% rule
- 4.60% ✓
- Cap rate
- 42.32%
- Cash-on-cash
- 128.68%
- DSCR
- 6.73
- GRM
- 1.8
CMA / ARV
- ARV (on-the-fly)
- $91,494
- Comps found
- 5
Show comp detail 5 sales within ~0.75 mi
| Address | Dist | Beds/Ba | Sqft | Sold | Price | $/sf | Match |
|---|---|---|---|---|---|---|---|
| 320 Avenue A | 0.62mi | 2/2.0 (+1) | 828 (+6%) | 2mo | $92,500 | $112 | 51 |
| 55 Marwood Ave | 0.57mi | 2/1.0 (+1) | 788 (+1%) | 21mo | $139,000 | $176 | 50 |
| 147 Wilkins Ave | 0.67mi | 2/1.5 (+1) | 784 (+0%) | 18mo | $91,500 | $117 | 46 |
| 529 Collins Ave | 0.60mi | 2/1.0 (+1) | 740 (-5%) | 22mo | $72,500 | $98 | 40 |
| 22 Radnor Ave | 0.53mi | 2/1.0 (+1) | 892 (+14%) | 12mo | $135,000 | $151 | 37 |
Match score weights: distance 35% · size 25% · config 20% · recency 20%. Top-matched comps best support the ARV.
Projected returns pro-forma
-1.62% appreciation · 3.0% rent growth · sell at horizon
- IRR
- —
- Equity multiple
- 7.46×
- Total profit
- $36,012
- Equity at exit
- $4,216
- IRR
- —
- Equity multiple
- 15.62×
- Total profit
- $81,457
- Equity at exit
- $3,944
Cash invested: $5,572 (down + closing). Projections, not guarantees.
Landlord ↔ Tenant lean methodology
- Overall (STATE)
- 62 Landlord-Friendly
- State Pennsylvania
- 62 Landlord-Friendly · EVEN
- County
- — inherits STATE
- City
- — inherits STATE
ZIP-level market 15104
- Home prices YoY
- -1.1%
- Active inventory
- 37
- Price-to-rent
- 1.8×
Monthly cashflow live
- Estimated rent
- $916 high interval (Pro) →
- Mortgage (P&I)
- −$104
- Tax from tax record
- −$14 /mo · $164/yr
- Insurance
- −$8
- HOA
- −$0
- Vacancy / Maint / Mgmt
- −$192
- Net cashflow
- $598
Break-even live
UW: 25.0% down · 7.5% · 30yr · 1.5% tax · 5.0% vac · 8.0% maint · 8.0% mgmt
Financing live
Cash to close
- Down payment
- $4,975
- Closing costs
- $597
- Reserves months
- —
- Total cash needed
- —
Loan-product check · same deal, 3 products live
Conventional
25% down · 7.5% · 30yr
- Down + closing
- —
- Monthly P&I
- —
- Monthly cashflow
- —
- DSCR
- —
- Eligible?
- —
Personal DTI + credit; lowest rate.
DSCR
20% down · 8.5% · 30yr
- Down + closing
- —
- Monthly P&I
- —
- Monthly cashflow
- —
- DSCR
- —
- Eligible?
- —
No personal income docs; deal must DSCR.
Hard money
10% down · 12.0% · 12mo
- Down + closing
- —
- Monthly P&I
- —
- Monthly cashflow
- —
- DSCR
- —
- Eligible?
- —
Short-term bridge; refi at stabilization.
Rent comps 14 comps
| Address | Beds | Baths | Sqft | Rent | $/sqft | DOM | Units | Dist |
|---|---|---|---|---|---|---|---|---|
| 1310 Brinton Ave Unit 1 Braddock, PA | 2.0 | 1.0 | 800 | $1,000 | $1.25 | 43d | 1 | 0.20mi |
| 1508 Ridge Ave Unit 3 Braddock, PA | 1.0 | 1.0 | 850 | $680 | $0.80 | 43d | 1 | 0.39mi |
| 219 North Ave Unit 1 East Pittsburgh, PA | 2.0 | 1.0 | 850 | $900 | $1.06 | 2d | 1 | 0.44mi |
| 12 Demmer Ave Unit 2 Pittsburgh, PA | 1.0 | 1.0 | 750 | $725 | $0.97 | 23d | 1 | 0.55mi |
| 411 Franklin St Unit 3 East Pittsburgh, PA | 1.0 | 1.0 | 646 | $1,050 | $1.63 | 43d | 1 | 0.65mi |
| 810 Wood St Unit 1 East Pittsburgh, PA | 1.0 | 1.0 | 1000 | $1,200 | $1.20 | 7d | 1 | 0.70mi |
| 817 Kirkpatrick Ave Unit 8171-A Braddock, PA | 2.0 | 1.0 | 866 | $800 | $0.92 | 43d | 1 | 0.71mi |
| 17 Sumner Ave Pittsburgh, PA | 1.0 | 1.0 | 800 | $950 | $1.19 | 43d | 1 | 0.88mi |
| 505 Washington St Turtle Creek, PA | 2.0 | 1.0 | 1064 | $1,200 | $1.13 | 43d | 1 | 1.05mi |
| 906 Penn Ave Unit A Turtle Creek, PA | 2.0 | 2.0 | 1122 | $1,250 | $1.11 | 43d | 1 | 1.17mi |
| 906 Penn Ave Turtle Creek, PA | 1.0 | 1.0 | 588 | $895 | $1.52 | 2d | 1 | 1.17mi |
| 221 Grant St Unit 221-B Turtle Creek, PA | 2.0 | 1.0 | 756 | $775 | $1.03 | 43d | 1 | 1.21mi |
| 342 Kenyon St Turtle Creek, PA | 1.0–2.0 | 1.0 | 850 | $1,115 | $1.31 | 14d | 6 | 1.39mi |
| 918 Oak Ave Turtle Creek, PA | 1.0 | 1.0 | 750 | $1,100 | $1.47 | 23d | 1 | 1.39mi |
Listing history 15 events
-
2026-06-18days on market $19,900 Active 23 DOM
-
2026-06-17days on market $19,900 Active 22 DOM
-
2026-06-16days on market $19,900 Active 21 DOM
-
2026-06-15days on market $19,900 Active 20 DOM
-
2026-06-13days on market $19,900 Active 18 DOM
-
2026-06-09days on market $19,900 Active 14 DOM
-
2026-06-08days on market $19,900 Active 13 DOM
-
2026-06-07days on market $19,900 Active 12 DOM
-
2026-06-05days on market $19,900 Active 9 DOM
-
2026-06-03days on market $19,900 Active 8 DOM
-
2026-06-02days on market $19,900 Active 7 DOM
-
2026-06-01days on market $19,900 Active 6 DOM
-
2026-05-31days on market $19,900 Active 5 DOM
-
2026-05-26$19,900 Active
-
1977-06-02soldstatus $5,750
ⓘ Source: listings_history table (triggers on properties + properties_extension) + one-shot
backfill from property_details.listing_events for pre-trigger history.
Tax reassessment forecast PA · Partial reset (capped growth)
- Current annual tax
- $164 · $14/mo
- Projected year-2 tax
- $239 · $20/mo
- Expected delta
- +$75/yr (+$6/mo · 46.1%)
ⓘ Screening estimate from a state-policy table — verify with the county assessor before closing.
Climate risk First Street
- Flood 1/10 Low FEMA zone X (unshaded) · 0% chance over 30 yrs
- Wildfire 1/10 Low
- Heat 3/10 Moderate 7 d/yr ≥97°F today · 16 d/yr by 30 yrs out
- Wind 2/10 Low
- Air quality 4/10 Moderate 5 unhealthy d/yr today · 7 by 30 yrs out
Nearby sold comps map
Loading sold comps map…
Walkable amenities ~0.75 mi
Loading nearby amenities…
Taxation est. · year 1
- Rental income
- $10,994
- − Mortgage interest
- −$1,115
- − Property taxes
- −$164
- − Insurance
- −$100
- − Repairs & maintenance
- −$880
- − Management
- −$880
- − Depreciation
- −$579
- Taxable income
- $7,279
- Est. tax owed @ 24.0%
- −$1,747
- After-tax cash flow
- $5,423/yr
For passive investors: Depreciation is non-cash, so a rental often shows a tax loss while cash-flowing — sheltering income. Rental losses are passive: they offset passive income freely, and up to $25,000/yr can offset ordinary (W-2) income if you actively participate and your MAGI is under $100k (phasing out to $0 by $150k); unused losses carry forward. On sale, claimed depreciation is recaptured at up to 25%, and gains may owe capital-gains tax (a 1031 exchange can defer both). Figures are a year-1 estimate at your 24.0% rate — not tax advice; consult a CPA.
Schools (NCES district)
- District
- Woodland Hills SD
- NCES district ID
- 4216500
- Math proficiency
- 13% ▼ -13.00%
- Reading proficiency
- 30% ▼ -10.00%
- Median HH income
- $41,803
- Composite
- 18.31/100
- National rank
- #8954
- State rank
- #486 of 539 in PA
Livability — North Braddock
- Score
- 73/100
- State rank
- #550
- US rank
- #5126
Category grades
Schools grade is shown separately in the Schools card above.
Census & demographics
- Census place
- North Braddock, PA
- County
- Allegheny County · 1,022,028 people
- City population
- 7,946
- Metro
- Pittsburgh, PA
- Population (ZIP)
- 8,034
- Household income
- $40,104
- Rent vs Own
- Severe rent burden
- 515.0
Population outlook (Allegheny County) Hauer SSP2
- Today (2025)
- 1,250,282 people
- By 2030
- 1,256,482 · +0.5%
- By 2040
- 1,256,318 · +0.5%
- By 2050
- 1,244,169 · -0.5%
- By 2075
- 1,197,693 · -4.2%
- By 2100
- 1,093,187 · -12.6%
Race, ethnicity, and origin ACS 2023
- Neighborhood character
- Diverse neighborhood (Simpson 0.56)
- Race & ethnicity
- Black 59% White 31% Two or more races 6% Hispanic / Latino 3%
- Common ancestry
- Romanian 4% Hispanic 1% Lithuanian 1%
- Foreign-born
- 0%
- Languages at home
- 97% English-only · Spanish 2%
Political lean MEDSL · Allegheny
- 2024 margin
- Strong D (+20.3) · D 59.7% · R 39.4%
- 2008→2024 swing
- +4.8pp toward D · 2008: 15.5pp · 2024: 20.3pp
- All cycles
- 2024: D+20.3 2020: D+20.4 2016: D+16.4 2012: D+14.4 2008: D+15.5
Not yet ingested
- Civics
- —
Market trends
- HPI YoY
- ▼ -1.62%
- Current HPI
- 138.912
- Rent YoY
- —
- Metro
- Pittsburgh, PA
- State GDP YoY
- ▲ 1.68%
- F500 in state
- 34
Industry mix (Fortune 500 HQ in PA)
| Industry | F500 HQs | Revenue |
|---|---|---|
| Healthcare | 2 | $309B |
|
||
| Insurance | 2 | $27B |
|
||
| Telecommunications / Media | 1 | $124B |
|
||
| Industrial Distribution | 1 | $22B |
|
||
| Financial Services | 1 | $20B |
|
||
| Chemicals / Materials | 1 | $18B |
|
||
Price history
+246.1% since first listed2 events — show timeline
- 2026-05-26 Listed $19,900 FSBO.com
- 1977-06-02 Sold (Public Records) $5,750 Public Records
Property tax history
+1.9%/yrLatest (2026): $164 · +2.9% YoY. Source: county tax records.
Cash-flow waterfall
monthlySold comps — $/sqft
last 12 mo · ≤1 miLoading sold comps…