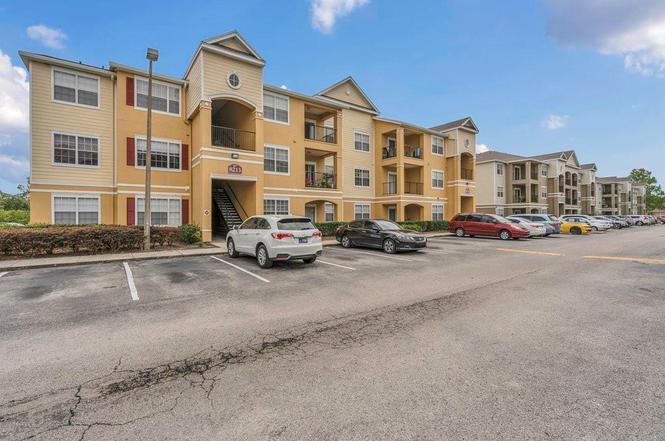
8213 Claire Ann Dr #108 · Rio Pinar, FL
Flood risk No data
- FEMA flood zone
- —
- Chance of flooding over 30 yrs
- —
- Est. flood insurance / yr
- —
Fire risk No data
- Est. fire insurance / yr
- —
Heat risk No data
- Hot days now (above threshold)
- —
- Hot days in 30 yrs
- —
Wind risk No data
- Chance of severe wind over 30 yrs
- —
Air-quality risk No data
- Unhealthy air days now
- —
- Unhealthy air days in 30 yrs
- —
Risk factors via First Street. Map © Google.
Why this score? — see what drove the D grade
The composite is a weighted blend of 9 inputs, each scored 0–100. Each bar is that input's sub-score; the figure is the points it added to the 100-point composite (weight × sub-score).
- Cash flow +12.1/30.0
- ARV discount +7.5/15.0
- 1% rule +5.0/10.0
- Schools +4.1/10.0
- DSCR +3.6/10.0
- Livability +3.6/5.0
- Rent growth +3.2/5.0
- Condition / age +2.5/5.0
- Appreciation +0.0/10.0
$145,000
🖨 Deal sheet (PDF) 📄 Offer letter ✓ Due diligence
Listing remarks
Welcome to 8213 Claire Ann Drive—your ideal home base in the heart of East Orlando. This beautifully maintained 1-bedroom, 1-bathroom ground-floor condo offers the perfect blend of comfort, value, and unbeatable location. Situated just minutes from Valencia College East Campus, University of Central Florida (UCF), and with easy access to FL-417, commuting and exploring all that Central Florida has to offer has never been easier. Step inside and feel right at home with an open-concept layout that seamlessly connects the living area to a well-equipped kitchen—perfect for entertaining or cozy nights in. The carpet is in excellent condition, adding warmth and comfort throughout the
Key facts
- Swimming pool
- Ground-floor condo
- Move-in ready condo
Tags
Property features AI
Finance
- Other: Total monthly association fee $211 (total annual fees $2,532)
- HOA & community: HOA required (Villa Valencia Condominium Association); Monthly HOA fee $211; includes common area taxes, structure maintenance, pool, trash, and water; Community amenities: clubhouse, playground, pool, sidewalks; Pets allowed (max 35 lbs)
Exterior
- Parking: Private maintained road access (asphalt)
- Security: Gated community
- Utilities: Public water; Public sewer; Cable connected; Electricity connected; Water connected
- Home design: Attached condominium; Facing east; One level (unit on floor 1); Residential property
- Construction: Stucco and frame construction; Other roof type; Slab foundation; Built as part of a multi-story building (3 stories total)
- Exterior features: Exterior lighting; Sidewalks; Trees/landscaped lot
Interior
- Kitchen: Dishwasher; Microwave; Range; Refrigerator
- Bedrooms: 1 bedroom (first floor)
- Flooring: Carpet; Ceramic tile
- Bathrooms: 1 full bathroom
- Heating & cooling: Central heating; Central air conditioning
- Interior features: Ceiling fans; Kitchen/family room combo; Open floorplan
- Laundry & utility: Washer/dryer location: inside, in kitchen
Neighborhood map
What this means for you Summary
Snapshot
- This is a 1-bed/1.0-bath condo listed at $145k.
Deal economics
- At list price, monthly cash flow is $-31 ($-368/yr) — negative.
- To cash-flow at today's rent, offer at most $140k (3.7% below list).
- To meet the 1% rule (rent ≥ 1% of price), the offer needs to be $145k (0.1% below list).
- Recommended offer: $128k (12.0% below list) — sets the bar for market timing.
- Cap rate 6.0% vs local median 3.4% in Rio Pinar — top-decile yield for the area; either an underpriced asset or a hidden risk that comps aren't pricing in. Stress-test before assuming the spread holds.
Location & tenants
- Location reads 72/100 on livability (#341 in FL) — a middle-class / working-renter tenant base. Strengths: crime A+, employment A+, housing A+; Watch: cost of living D+, amenities F, commute F.
- Orange (suburban): math 46% / reading 51% proficiency, ranked #43 of 73 in FL (top 59%) — families likely to look elsewhere, expect single-tenant / working-renter base with shorter leases.
- Zoned schools: Little River Elementary (math 37% / reading 42%, grade F, #1,513 of 2,144 statewide, top 73%, 380 students, 75% FRL); Union Park Middle (math 26% / reading 25%, grade F, #512 of 571 statewide, top 90%, 706 students, 74% FRL); Colonial High (math 16% / reading 33%, grade F, #505 of 667 statewide, top 79%, 3,442 students, 62% FRL).
- Zoned-school proficiency averages 30% at this address vs 48% district-wide (-19 pts) — the specific schools serving this property underperform the Orange average; the district grade overstates school quality for this exact location.
- Market conditions: Rents rising (+2.8%/yr); 281 active listings in the ZIP; 7 comparable units currently listed for rent nearby; rentals leasing fast (median 1d on market — plan ~1-2 weeks tenant-placement turnaround); solid renter incomes; 8,053 units permitted in Orange County in 2024 (3,133 in 5+ unit buildings).
Forward outlook
- Local home prices are declining (-3.0%/yr); year-one equity from $1k of loan paydown is wiped out by about $4k of value loss. Plan a longer hold.
- Orange County population projected at +52% by 2050 — long-run rental-demand tailwind backs the buy-and-hold thesis.
Negotiation context
- It's been on market 381 days — a 12% lower offer ($128k) is reasonable based on typical stale-listing flexibility.
- 4 sale attempts since 17y ago; this cycle's ask has dropped $25k (15%) from the opening price — seller is motivated, your offer sets the floor, not the list.
Questions for the listing agent
- What do current leases actually rent for vs. the listed asking? Can we see a recent rent roll and the last 12 months of T-12 income?
- It's been on market 381 days. Have you received any prior offers? Is the seller open to a 12% concession, seller financing, or rate buy-down credit?
- What does the HOA fee cover, when was the last increase, and are there any pending special assessments or reserve-fund shortfalls?
- Any open or pending special assessments — roof, HVAC, plumbing, elevator, façade? What's the per-unit balance and payoff schedule, and is the seller paying it off at close or rolling it to the buyer?
- Why hasn't it sold? Are there any deal-killer items the seller is aware of (foundation, flood, title, zoning, code violations)?
- Is there a deadline driving the sale (1031 exchange, divorce, estate, relocation)? That informs how much negotiation room exists.
- The area grade is low — what's the realistic commute time and amenity access for the typical tenant pool here? Any planned neighborhood developments (good or bad) we should know about?
- What's the average days-on-market for RENTAL listings here right now (not sales)? A rising rental-DOM trend means longer vacancies and softer asking-rent achievability than the comps imply.
- What's the recent tenant-quality profile in this submarket — average credit score on applications, eviction rate, late-payment / NSF rate, and stable-employment percentage? A property-management company in the area should have these aggregated.
- How much new apartment / multifamily construction is in the pipeline within 1–3 miles? Heavy new supply (>2% of stock underway) typically softens rents 12–24 months out; light construction supports rent growth.
Investment metrics
- 1% rule
- 1.00% ✗
- Cap rate
- 6.04%
- Cash-on-cash
- -0.91%
- DSCR
- 0.96
- GRM
- 8.3
CMA / ARV
No comps found within radius.
Projected returns pro-forma
-3.0% appreciation · 2.77% rent growth · sell at horizon
- IRR
- -18.0%
- Equity multiple
- 0.37×
- Total profit
- $-25,653
- Equity at exit
- $21,620
- IRR
- -10.5%
- Equity multiple
- 0.37×
- Total profit
- $-25,696
- Equity at exit
- $12,537
Cash invested: $40,600 (down + closing). Projections, not guarantees.
Landlord ↔ Tenant lean methodology
- Overall (STATE)
- 87 Strongly Landlord-Friendly
- State Florida
- 87 Strongly Landlord-Friendly · R+3
- County
- — inherits STATE
- City
- — inherits STATE
ZIP-level market 32825
- Rents YoY
- 2.8%
- Active inventory
- 281
- Price-to-rent
- 8.3×
Monthly cashflow live
- Estimated rent
- $1,449 high interval (Pro) →
- Mortgage (P&I)
- −$760
- Tax from tax record
- −$143 /mo · $1,720/yr
- Insurance
- −$60
- HOA
- −$211
- Lot rent
- −$0
- Vacancy / Maint / Mgmt
- −$304
- Net cashflow
- $-31
Break-even live
Sensitivity live
| Price | -10% $51 | -5% $10 | +0% $-31 | +5% $-72 | +10% $-113 |
|---|---|---|---|---|---|
| Rent | -10% $-145 | -5% $-88 | +0% $-31 | +5% $27 | +10% $84 |
| Rate | -1.0pp $42 | -0.5pp $6 | base $-31 | +0.5pp $-68 | +1.0pp $-106 |
UW: 25.0% down · 7.5% · 30yr · 1.5% tax · 5.0% vac · 8.0% maint · 8.0% mgmt
Financing live
Cash to close
- Down payment
- $36,250
- Closing costs
- $4,350
- Reserves months
- —
- Total cash needed
- —
Loan-product check · same deal, 3 products live
Conventional
25% down · 7.5% · 30yr
- Down + closing
- —
- Monthly P&I
- —
- Monthly cashflow
- —
- DSCR
- —
- Eligible?
- —
Personal DTI + credit; lowest rate.
DSCR
20% down · 8.5% · 30yr
- Down + closing
- —
- Monthly P&I
- —
- Monthly cashflow
- —
- DSCR
- —
- Eligible?
- —
No personal income docs; deal must DSCR.
Hard money
10% down · 12.0% · 12mo
- Down + closing
- —
- Monthly P&I
- —
- Monthly cashflow
- —
- DSCR
- —
- Eligible?
- —
Short-term bridge; refi at stabilization.
Rent comps 7 comps
| Address | Beds | Baths | Sqft | Rent | $/sqft | DOM | Units | Dist |
|---|---|---|---|---|---|---|---|---|
| 604 Laurel Cove Ct Orlando, FL | 1.0–3.0 | 1.0–2.0 | 892 | $1,428 | $1.60 | 0d | 15 | 0.25mi |
| 1000 Avida Village Cir Orlando, FL | 1.0–3.0 | 1.0–2.0 | 977 | $1,603 | $1.64 | 0d | 22 | 0.28mi |
| 949 Crowsnest Cir Orlando, FL | 1.0–2.0 | 1.0–2.0 | 822 | $1,252 | $1.52 | 0d | 33 | 0.56mi |
| 7960 Pine Crossings Cir Orlando, FL | 1.0–2.0 | 1.0–2.0 | 870 | $1,283 | $1.47 | 0d | 31 | 0.63mi |
| 7595 Sun Tree Cir Orlando, FL | 1.0–2.0 | 1.0–2.0 | 744 | $1,505 | $2.02 | 0d | 12 | 1.05mi |
| 9010 Running Bull Rd Orlando, FL | 1.0–4.0 | 1.0–4.0 | 1032 | $899 | $0.87 | 6d | 1 | 1.31mi |
| 6635 Breeze Way Orlando, FL | 1.0–2.0 | 1.0–2.0 | 855 | $1,350 | $1.58 | 6d | 1 | 1.46mi |
HOA detail condo
- Monthly dues
- $211 · $2,532/yr
- Assessments
- None detected in remarks — confirm with the listing agent.
Listing history 27 events
-
2026-06-22days on market $145,000 Active 381 DOM
-
2026-06-21days on market $145,000 Active 380 DOM
-
2026-06-18days on market $145,000 Active 377 DOM
-
2026-06-17days on market $145,000 Active 376 DOM
-
2026-06-16days on market $145,000 Active 375 DOM
-
2026-06-15days on market $145,000 Active 374 DOM
-
2026-06-13days on market $145,000 Active 372 DOM
-
2026-06-13days on market $145,000 Active 371 DOM
-
2026-06-09days on market $145,000 Active 368 DOM
-
2026-06-08days on market $145,000 Active 367 DOM
-
2026-06-07days on market $145,000 Active 366 DOM
-
2026-06-04days on market $145,000 Active 363 DOM
-
2026-06-03days on market $145,000 Active 362 DOM
-
2026-06-02days on market $145,000 Active 361 DOM
-
2026-06-02days on market $145,000 Active 360 DOM
-
2026-05-31days on market $145,000 Active 359 DOM
-
2025-12-12status Active
-
2025-10-16status Pending
-
2025-09-27price $145,000
-
2025-06-11price $160,000
-
2025-04-10$170,000 Active
-
2023-12-30historical $1,250
-
2023-12-05price $1,250
-
2023-11-14$1,350
-
2016-02-09soldstatus $200,100
-
2009-09-21historical
-
2009-02-21$73,800
ⓘ Source: listings_history table (triggers on properties + properties_extension) + one-shot
backfill from property_details.listing_events for pre-trigger history.
Tax reassessment forecast FL · Resets to sale price
- Current annual tax
- $1,720 · $143/mo
- Projected year-2 tax
- $1,720 · $143/mo
- Expected delta
- $0/yr ($0/mo · 0.0%)
ⓘ Screening estimate from a state-policy table — verify with the county assessor before closing.
Nearby sold comps map
Loading sold comps map…
Walkable amenities ~0.75 mi
Loading nearby amenities…
Taxation est. · year 1
- Rental income
- $17,385
- − Mortgage interest
- −$8,122
- − Property taxes
- −$1,720
- − Insurance
- −$725
- − Repairs & maintenance
- −$1,391
- − Management
- −$1,391
- − HOA
- −$2,532
- − Depreciation
- −$4,218
- Taxable loss
- −$2,714
- Est. tax savings @ 24.0%
- +$651
- After-tax cash flow
- $284/yr
For passive investors: Depreciation is non-cash, so a rental often shows a tax loss while cash-flowing — sheltering income. Rental losses are passive: they offset passive income freely, and up to $25,000/yr can offset ordinary (W-2) income if you actively participate and your MAGI is under $100k (phasing out to $0 by $150k); unused losses carry forward. On sale, claimed depreciation is recaptured at up to 25%, and gains may owe capital-gains tax (a 1031 exchange can defer both). Figures are a year-1 estimate at your 24.0% rate — not tax advice; consult a CPA.
Schools (NCES district)
- District
- Orange
- NCES district ID
- 1201440
- Math proficiency
- 46% ▼ -9.00%
- Reading proficiency
- 51% ▼ -2.00%
- Median HH income
- $49,350
- Composite
- 41.47/100
- National rank
- #3461
- State rank
- #43 of 73 in FL
Livability — Rio Pinar
- Score
- 72/100
- State rank
- #341
- US rank
- #5937
Category grades
Schools grade is shown separately in the Schools card above.
Census & demographics
- County
- Orange County · 1,471,359 people
- Metro
- Orlando-Kissimmee-Sanford, FL
- Population (ZIP)
- 63,698
- Household income
- $81,651
- Rent vs Own
- Severe rent burden
- 1458.0
Population outlook (Orange County) Hauer SSP2
- Today (2025)
- 1,618,226 people
- By 2030
- 1,787,404 · +10.5%
- By 2040
- 2,125,621 · +31.4%
- By 2050
- 2,454,016 · +51.6%
- By 2075
- 3,173,711 · +96.1%
- By 2100
- 3,607,781 · +122.9%
Race, ethnicity, and origin ACS 2023
- Neighborhood character
- Diverse neighborhood (Simpson 0.66)
- Race & ethnicity
- Hispanic / Latino 47% White 32% Two or more races 23% Black 11% Asian 7%
- Hispanic origin (detail)
- Mexican 2% Puerto Rican 25% Cuban 6% Dominican 3%
- Common ancestry
- Lithuanian 1% Romanian 1% Slovak 1%
- Foreign-born
- 20% · Canada, Vietnam, Jamaica
- Languages at home
- 56% English-only · Spanish 35% Other Indo-European 3% Vietnamese 2%
Political lean MEDSL · Orange
- 2024 margin
- D (+13.6) · D 56.1% · R 42.5% · Other 1.3%
- 2008→2024 swing
- -5.0pp toward R · 2008: 18.6pp · 2024: 13.6pp
- All cycles
- 2024: D+13.6 2020: D+23.1 2016: D+24.6 2012: D+18.2 2008: D+18.6
Not yet ingested
- Civics
- —
Market trends
- HPI YoY
- ▼ -171.52%
- Current HPI
- 315.8496
- Rent YoY
- ▲ 2.77%
- Metro
- Orlando-Kissimmee-Sanford, FL
- State GDP YoY
- ▲ 3.28%
- F500 in state
- 36
Industry mix (Fortune 500 HQ in FL)
| Industry | F500 HQs | Revenue |
|---|---|---|
| Industrial Technology | 2 | $29B |
|
||
| Insurance | 2 | $17B |
|
||
| Retail | 1 | $60B |
|
||
| Technology Distribution | 1 | $58B |
|
||
| Homebuilding | 1 | $35B |
|
||
| Technology Manufacturing | 1 | $35B |
|
||
Price history
+96.5% since first listed11 events — show timeline
- 2025-12-12 Relisted — Stellar MLS as Distributed by MLS Grid
- 2025-10-16 Pending — Stellar MLS as Distributed by MLS Grid
- 2025-09-27 Price Changed $145,000 Stellar MLS as Distributed by MLS Grid
- 2025-06-11 Price Changed $160,000 Stellar MLS as Distributed by MLS Grid
- 2025-04-10 Listed $170,000 Stellar MLS as Distributed by MLS Grid
- 2023-12-30 Rental Removed $1,250 RENT.
- 2023-12-05 Price Changed $1,250 RENT.
- 2023-11-14 Listed for Rent $1,350 RENT.
- 2016-02-09 Sold (Public Records) $200,100 Public Records
- 2009-09-21 Listing Removed — Stellar MLS as Distributed by MLS Grid
- 2009-02-21 Listed $73,800 Stellar MLS as Distributed by MLS Grid
Property tax history
+9.9%/yrLatest (2025): $1,720 · +13.2% YoY. Source: county tax records.
Cash-flow waterfall
monthlySold comps — $/sqft
last 12 mo · ≤1 miLoading sold comps…