1700 South Glendora Ave #9 · Glendora, CA
Flood risk 6/10 · Moderate
- FEMA flood zone
- X (unshaded)
- Chance of flooding over 30 yrs
- 0.7%
- Est. flood insurance / yr
- $507 – $1,088
Fire risk 6/10 · Moderate
- Est. fire insurance / yr
- $659 – $1,223
Heat risk 7/10 · Major
- Hot days now (above 98°F)
- 7 days/yr
- Hot days in 30 yrs
- 20 days/yr
Wind risk 1/10 · Minimal
- Chance of severe wind over 30 yrs
- —
Air-quality risk 7/10 · Major
- Unhealthy air days now
- 15 days/yr
- Unhealthy air days in 30 yrs
- 17 days/yr
Risk factors via First Street. Map © Google.
Why this score? — see what drove the B grade
The composite is a weighted blend of 9 inputs, each scored 0–100. Each bar is that input's sub-score; the figure is the points it added to the 100-point composite (weight × sub-score).
- Cash flow +30.0/30.0
- 1% rule +10.0/10.0
- DSCR +10.0/10.0
- ARV discount +7.5/15.0
- Schools +4.7/10.0
- Livability +3.2/5.0
- Rent growth +3.1/5.0
- Condition / age +2.5/5.0
- Appreciation +0.0/10.0
$199,900
🖨 Deal sheet 📄 Offer letter ✓ Due diligence
Listing remarks MLS
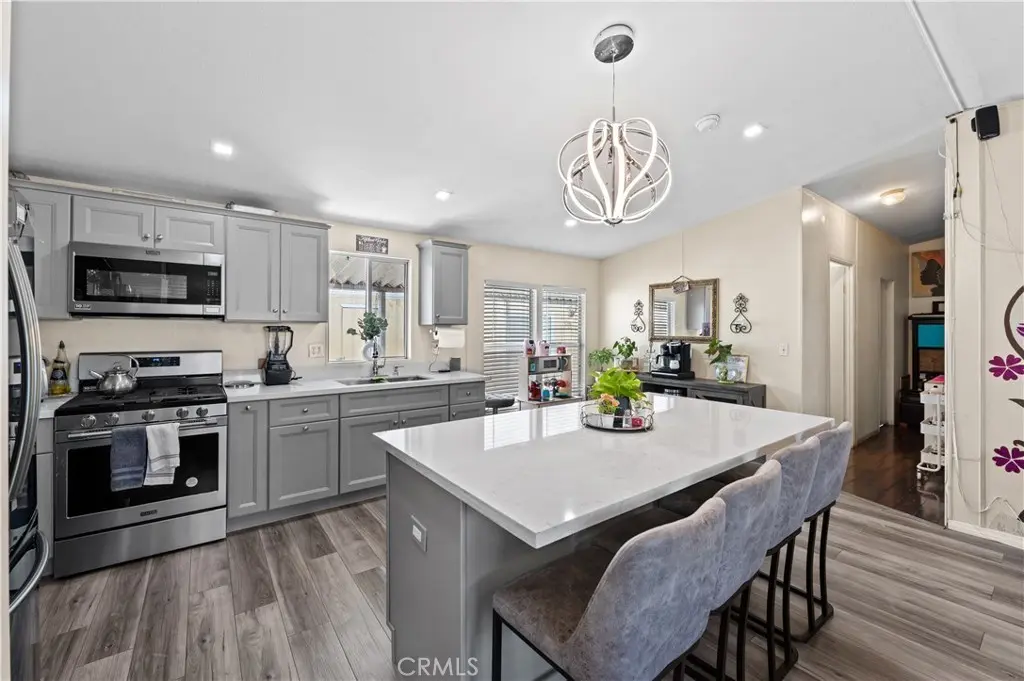
Welcome to this beautifully remodeled manufactured double wide in the desirable Glen Air Community. This rare find boasts four spacious bedrooms and two modern bathrooms, offering ample space for your family and guests. The recent remodel features an open floor plan, seamlessly connecting the living, dining, and kitchen areas, perfect for entertaining and family gatherings. The kitchen is a chef’s dream with updated appliances, plenty of counter space, and stylish cabinetry. The master suite is a true retreat, complete with a large soaking tub in the en-suite bathroom, ideal for unwinding after a long day. Each of the additional bedrooms is generously sized, providing comfort and privacy for everyone. This home also includes newer flooring, paint, and updated fixtures throughout, ensuring a move-in ready experience. Located in the Glen Air Community, you’ll enjoy a peaceful neighborhood atmosphere with convenient access to local amenities. Don't miss this exceptional opportunity to own a spacious and modern home in a sought-after location! Finance options available, inquire with agent.
Key facts
- Updated appliances
- Open floor plan
- Large soaking tub
Tags
Neighborhood map
What this means for you Summary
Snapshot
- This is a 4-bed/2.0-bath manufactured listed at $200k.
Deal economics
- At list price, monthly cash flow is $1k ($18k/yr) — positive.
- The deal already cash-flows at list — no discount required.
- Meets the 1% rule at list price ($4k rent vs $200k).
- Recommended offer: $188k (6.0% below list) — sets the bar for market timing.
- Cap rate 15.2% vs local median 2.4% in Glendora — top-decile yield for the area; either an underpriced asset or a hidden risk that comps aren't pricing in. Stress-test before assuming the spread holds.
Location & tenants
- Location reads 65/100 on livability (#373 in CA) — a middle-class / working-renter tenant base. Strengths: commute A+, employment A+, schools B; Watch: amenities F, cost of living F, health & safety F.
- Charter Oak Unified (suburban): math 45% / reading 55% proficiency, ranked #387 of 1,400 in CA (top 28%) — acceptable for families but not a draw, mixed tenant base, ~2y average lease.
- Market conditions: Rents rising (+2.6%/yr); 52 active listings in the ZIP; 13 comparable units currently listed for rent nearby; rentals leasing fast (median 6d on market — plan ~1-2 weeks tenant-placement turnaround); solid renter incomes; 19,697 units permitted in Los Angeles County in 2024 (9,426 in 5+ unit buildings).
- This rent runs 44% of the median local income ($99k/yr) — at the standard rent-burdened threshold; future hikes will face affordability resistance.
Forward outlook
- Local home prices are declining (-3.0%/yr); year-one equity from $1k of loan paydown is wiped out by about $6k of value loss. Plan a longer hold.
- Los Angeles County population projected at +9% by 2050 — modest demand growth; plan on rents tracking national, not racing it.
- At projected returns (-3.0% appreciation + 2.6% rent growth), your $56k cash investment doubles in ~4 years — after that, you're playing with house money.
Negotiation context
- It's been on market 64 days — a 6% lower offer ($188k) is reasonable based on typical stale-listing flexibility.
- 8 sale attempts since 21y ago with the ask held roughly flat each time — persistent listings suggest the price (not the market) is what's stuck; bring a comps-based counter.
Risks & watch-outs
- Climate carrying-cost: major flood risk; major wildfire risk; extreme-heat days projected 7→20/yr by 2055 (HVAC capex compounding) — expect insurance premiums to compound above CPI over the hold.
Questions for the listing agent
- It's been on market 64 days. Have you received any prior offers? Is the seller open to a 6% concession, seller financing, or rate buy-down credit?
- Why hasn't it sold? Are there any deal-killer items the seller is aware of (foundation, flood, title, zoning, code violations)?
- Is there a deadline driving the sale (1031 exchange, divorce, estate, relocation)? That informs how much negotiation room exists.
- Schools are B-rated — typically a magnet for longer-tenancy family renters. What's the average tenant stay here, and is there a school-zone premium baked into asking?
- What's the average days-on-market for RENTAL listings here right now (not sales)? A rising rental-DOM trend means longer vacancies and softer asking-rent achievability than the comps imply.
- What's the recent tenant-quality profile in this submarket — average credit score on applications, eviction rate, late-payment / NSF rate, and stable-employment percentage? A property-management company in the area should have these aggregated.
- How much new for-sale + rental construction is in the pipeline within 1–3 miles? Heavy new supply typically softens prices + rents 12–24 months out; constrained supply supports both.
Investment metrics
- 1% rule
- 1.81% ✓
- Cap rate
- 15.15%
- Cash-on-cash
- 31.65%
- DSCR
- 2.41
- GRM
- 4.6
CMA / ARV
- ARV (median comp)
- $109,000
- List price
- $199,900
- Delta
- 83.39%
- Verdict
- OVERPRICED
- Comps
- 3 within 1.0 mi
Show comp detail 5 sales within ~0.75 mi
| Address | Dist | Beds/Ba | Sqft | Sold | Price | $/sf | Match |
|---|---|---|---|---|---|---|---|
| 201 E Arrow #73 | 0.19mi | 3/2.0 (-1) | 1,248 (-4%) | 3mo | $178,500 | $143 | 77 |
| 19850 E Arrow Hwy Unit A15 | 0.16mi | 3/2.0 (-1) | 1,176 (-10%) | 14mo | $160,000 | $136 | 60 |
| 21210-W Arrow Hwy #24 | 0.12mi | 3/2.0 (-1) | 1,152 (-11%) | 15mo | $230,000 | $200 | 58 |
| 201 E Arrow Hwy #63 | 0.19mi | 3/2.0 (-1) | 1,156 (-11%) | 18mo | $165,000 | $143 | 53 |
| 201 E Arrow Hwy #15 | 0.19mi | 3/2.0 (-1) | 1,123 (-14%) | 22mo | $185,000 | $165 | 46 |
Match score weights: distance 35% · size 25% · config 20% · recency 20%. Top-matched comps best support the ARV.
Projected returns pro-forma
-3.0% appreciation · 2.59% rent growth · sell at horizon
- IRR
- 26.1%
- Equity multiple
- 2.08×
- Total profit
- $60,196
- Equity at exit
- $29,806
- IRR
- 33.5%
- Equity multiple
- 4.00×
- Total profit
- $167,656
- Equity at exit
- $17,284
Cash invested: $55,972 (down + closing). Projections, not guarantees.
Landlord ↔ Tenant lean methodology
- Overall (STATE)
- 18 Strongly Tenant-Friendly
- State California
- 18 Strongly Tenant-Friendly · D+13
- County
- — inherits STATE
- City
- — inherits STATE
ZIP-level market 91740
- Rents YoY
- 2.6%
- Active inventory
- 52
- Price-to-rent
- 4.6×
Monthly cashflow live
- Estimated rent
- $3,617 high interval (Pro) →
- Mortgage (P&I)
- −$1,048
- Tax est. 1.5%
- −$250 /mo · $2,998/yr
- Insurance
- −$83
- HOA
- −$0
- Vacancy / Maint / Mgmt
- −$760
- Net cashflow
- $1,476
Break-even live
UW: 25.0% down · 7.5% · 30yr · 1.5% tax · 5.0% vac · 8.0% maint · 8.0% mgmt
Financing live
Cash to close
- Down payment
- $49,975
- Closing costs
- $5,997
- Reserves months
- —
- Total cash needed
- —
Loan-product check · same deal, 3 products live
Conventional
25% down · 7.5% · 30yr
- Down + closing
- —
- Monthly P&I
- —
- Monthly cashflow
- —
- DSCR
- —
- Eligible?
- —
Personal DTI + credit; lowest rate.
DSCR
20% down · 8.5% · 30yr
- Down + closing
- —
- Monthly P&I
- —
- Monthly cashflow
- —
- DSCR
- —
- Eligible?
- —
No personal income docs; deal must DSCR.
Hard money
10% down · 12.0% · 12mo
- Down + closing
- —
- Monthly P&I
- —
- Monthly cashflow
- —
- DSCR
- —
- Eligible?
- —
Short-term bridge; refi at stabilization.
Rent comps 13 comps
| Address | Beds | Baths | Sqft | Rent | $/sqft | DOM | Units | Dist |
|---|---|---|---|---|---|---|---|---|
| 1632 S Glendora Ave Glendora, CA | 3.0 | 2.0 | 1000 | $3,200 | $3.20 | 6d | 1 | 0.07mi |
| 1620 S Glendora Ave Glendora, CA | 3.0 | 2.0 | 1450 | $3,500 | $2.41 | 6d | 1 | 0.11mi |
| 261 W Newburgh St Glendora, CA | 3.0 | 2.0 | 1671 | $3,800 | $2.27 | 1d | 1 | 0.32mi |
| 20240 E Arrow Hwy Unit D Covina, CA | 3.0 | 2.5 | 1477 | $3,350 | $2.27 | 43d | 1 | 0.32mi |
| 20254 E Arrow Hwy Unit B Covina, CA | 3.0 | 2.5 | 1477 | $3,100 | $2.10 | 24d | 1 | 0.34mi |
| 608 Claraday St Glendora, CA | 3.0 | 2.5 | 1600 | $3,500 | $2.19 | 43d | 1 | 0.58mi |
| 559 E Juanita Ave Glendora, CA | 3.0 | 3.0 | 1000 | $4,500 | $4.50 | 1d | 1 | 0.60mi |
| 4830 N Brightview Dr Covina, CA | 4.0 | 3.0 | 1497 | $3,650 | $2.44 | 20d | 1 | 0.88mi |
| 937 N Greenpark Ave Covina, CA | 4.0 | 2.0 | 1562 | $4,000 | $2.56 | 43d | 1 | 0.91mi |
| 1039 N Barston Ave Covina, CA | 4.0 | 2.0 | 1870 | $3,598 | $1.92 | 24d | 1 | 1.07mi |
| 959 E Edgecomb St Covina, CA | 3.0 | 2.0 | 1335 | $5,000 | $3.75 | 3d | 1 | 1.27mi |
| 1447 S Valley Center Ave Glendora, CA | 3.0 | 2.0 | 1345 | $3,500 | $2.60 | 1d | 1 | 1.46mi |
| 749 Marmalade Pl Covina, CA | 3.0 | 2.0 | 1620 | $3,600 | $2.22 | 1d | 1 | 1.50mi |
Listing history 29 events
-
2026-06-18days on market $199,900 Active 64 DOM
-
2026-06-17days on market $199,900 Active 63 DOM
-
2026-06-16days on market $199,900 Active 62 DOM
-
2026-06-15days on market $199,900 Active 61 DOM
-
2026-06-13days on market $199,900 Active 59 DOM
-
2026-06-13days on market $199,900 Active 58 DOM
-
2026-06-09days on market $199,900 Active 55 DOM
-
2026-06-08days on market $199,900 Active 54 DOM
-
2026-06-07days on market $199,900 Active 53 DOM
-
2026-06-04days on market $199,900 Active 50 DOM
-
2026-06-03days on market $199,900 Active 49 DOM
-
2026-06-02days on market $199,900 Active 48 DOM
-
2026-06-01days on market $199,900 Active 47 DOM
-
2026-05-31days on market $199,900 Active 46 DOM
-
2026-04-15$199,900 Active 1114-char remark
Show marketing remark (1114 chars)
Welcome to this beautifully remodeled manufactured double wide in the desirable Glen Air Community. This rare find boasts four spacious bedrooms and two modern bathrooms, offering ample space for your family and guests. The recent remodel features an open floor plan, seamlessly connecting the living, dining, and kitchen areas, perfect for entertaining and family gatherings. The kitchen is a chef’s dream with updated appliances, plenty of counter space, and stylish cabinetry. The master suite is a true retreat, complete with a large soaking tub in the en-suite bathroom, ideal for unwinding after a long day. Each of the additional bedrooms is generously sized, providing comfort and privacy for everyone. This home also includes newer flooring, paint, and updated fixtures throughout, ensuring a move-in ready experience. Located in the Glen Air Community, you’ll enjoy a peaceful neighborhood atmosphere with convenient access to local amenities. Don't miss this exceptional opportunity to own a spacious and modern home in a sought-after location! Finance options available, inquire with agent.
-
2026-04-14historical
-
2026-04-14$199,900 Active
-
2025-03-10historical
-
2025-03-09status Active
-
2025-02-11status Active
-
2024-12-03price $205,000
-
2024-10-03status Active
-
2024-10-03price $215,000
-
2024-08-15historical Active Under Contract
-
2024-08-03$210,000 Active
-
2008-12-23historical
-
2008-11-05$119,000
-
2005-11-21historical
-
2005-07-21$6,000
ⓘ Source: listings_history table (triggers on properties + properties_extension) + one-shot
backfill from property_details.listing_events for pre-trigger history.
Climate risk First Street
- Flood 6/10 Major FEMA zone X (unshaded) · 70% chance over 30 yrs
- Wildfire 6/10 Major
- Heat 7/10 Severe 7 d/yr ≥98°F today · 20 d/yr by 30 yrs out
- Wind 1/10 Low
- Air quality 7/10 Severe 15 unhealthy d/yr today · 17 by 30 yrs out
Nearby sold comps map
Loading sold comps map…
Walkable amenities ~0.75 mi
Loading nearby amenities…
Taxation est. · year 1
- Rental income
- $43,407
- − Mortgage interest
- −$11,198
- − Property taxes
- −$2,998
- − Insurance
- −$1,000
- − Repairs & maintenance
- −$3,473
- − Management
- −$3,473
- − Depreciation
- −$5,815
- Taxable income
- $15,452
- Est. tax owed @ 24.0%
- −$3,708
- After-tax cash flow
- $14,006/yr
For passive investors: Depreciation is non-cash, so a rental often shows a tax loss while cash-flowing — sheltering income. Rental losses are passive: they offset passive income freely, and up to $25,000/yr can offset ordinary (W-2) income if you actively participate and your MAGI is under $100k (phasing out to $0 by $150k); unused losses carry forward. On sale, claimed depreciation is recaptured at up to 25%, and gains may owe capital-gains tax (a 1031 exchange can defer both). Figures are a year-1 estimate at your 24.0% rate — not tax advice; consult a CPA.
Schools (NCES district)
- District
- Charter Oak Unified
- NCES district ID
- 0608190
- Math proficiency
- 45% ▲ 2.00%
- Reading proficiency
- 55% ▲ 4.00%
- Median HH income
- $72,756
- Composite
- 46.95/100
- National rank
- #5160
- State rank
- #387 of 1400 in CA
Livability — Glendora
- Score
- 65/100
- State rank
- #373
- US rank
- #12710
Category grades
Schools grade is shown separately in the Schools card above.
Census & demographics
- Census place
- Glendora, CA
- County
- Los Angeles County · 9,444,647 people
- City population
- 52,239
- Metro
- Los Angeles-Long Beach-Anaheim, CA
- Population (ZIP)
- 26,168
- Household income
- $99,083
- Rent vs Own
- Severe rent burden
- 1034.0
Population outlook (Los Angeles County) Hauer SSP2
- Today (2025)
- 10,940,515 people
- By 2030
- 11,256,481 · +2.9%
- By 2040
- 11,729,929 · +7.2%
- By 2050
- 11,948,407 · +9.2%
- By 2075
- 11,818,114 · +8.0%
- By 2100
- 10,842,928 · -0.9%
Race, ethnicity, and origin ACS 2023
- Neighborhood character
- Diverse neighborhood (Simpson 0.64)
- Race & ethnicity
- Hispanic / Latino 49% White 33% Two or more races 21% Asian 10% Black 3% Native American 1%
- Hispanic origin (detail)
- Mexican 37% Cuban 1%
- Common ancestry
- Lithuanian 1% Portuguese 1% Romanian 1%
- Foreign-born
- 22% · Canada, China, Vietnam
- Languages at home
- 63% English-only · Spanish 24% Chinese 4% Arabic 3%
Political lean MEDSL · Los Angeles
- 2024 margin
- Solid D (+32.9) · D 64.8% · R 31.9% · Other 3.3%
- 2008→2024 swing
- -7.4pp toward R · 2008: 40.4pp · 2024: 32.9pp
- All cycles
- 2024: D+32.9 2020: D+44.2 2016: D+48.0 2012: D+40.0 2008: D+40.4
Not yet ingested
- Civics
- —
Market trends
- HPI YoY
- ▼ -847.76%
- Current HPI
- 378.3547
- Rent YoY
- ▲ 2.59%
- Metro
- Los Angeles-Long Beach-Anaheim, CA
- State GDP YoY
- ▲ 3.21%
- F500 in state
- 116
Industry mix (Fortune 500 HQ in CA)
| Industry | F500 HQs | Revenue |
|---|---|---|
| Technology | 27 | $1,492B |
|
||
| Financial Services | 3 | $174B |
|
||
| Retail | 3 | $44B |
|
||
| Insurance | 3 | $26B |
|
||
| Media / Entertainment | 2 | $115B |
|
||
| Pharmaceuticals / Biotech | 2 | $62B |
|
||
Price history
+3231.7% since first listed15 events — show timeline
- 2026-04-15 Listed $199,900 CRMLS
- 2026-04-14 Listed $199,900 CRMLS
- 2026-04-14 Listing Removed — CRMLS
- 2025-03-10 Listing Removed — CRMLS
- 2025-03-09 Relisted — CRMLS
- 2025-02-11 Relisted — CRMLS
- 2024-12-03 Price Changed $205,000 CRMLS
- 2024-10-03 Relisted — CRMLS
- 2024-10-03 Price Changed $215,000 CRMLS
- 2024-08-15 Contingent — CRMLS
- 2024-08-03 Listed $210,000 CRMLS
- 2008-12-23 Listing Removed — CRMLS
- 2008-11-05 Listed $119,000 CRMLS
- 2005-11-21 Listing Removed — CRMLS
- 2005-07-21 Listed $6,000 CRMLS
Cash-flow waterfall
monthlySold comps — $/sqft
last 12 mo · ≤1 miLoading sold comps…