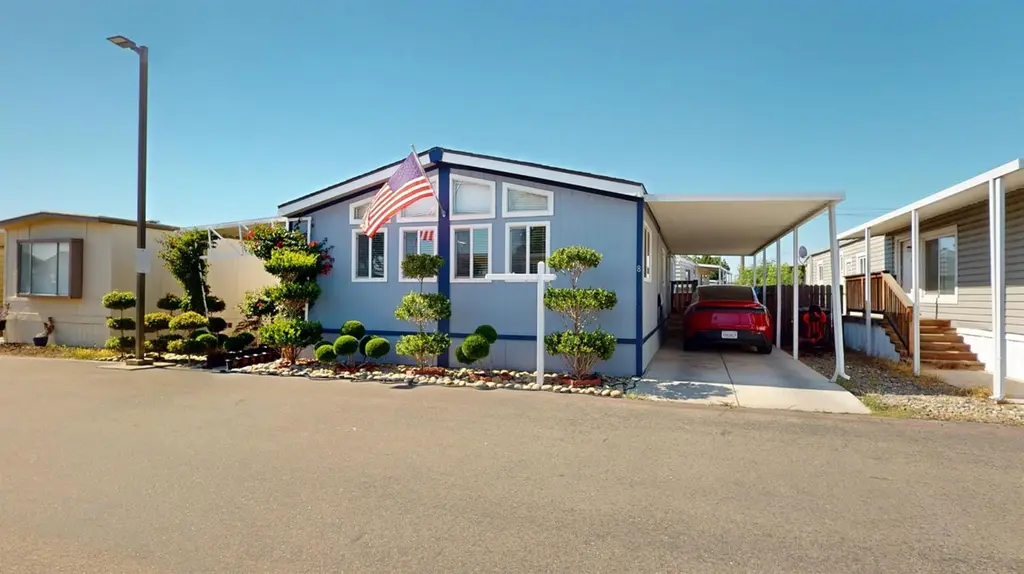
8200 Jantzen Rd #8 · Hughson, CA
Flood risk 1/10 · Minimal
- FEMA flood zone
- X (unshaded)
- Chance of flooding over 30 yrs
- 0.0%
- Est. flood insurance / yr
- $507 – $1,088
Fire risk 7/10 · Major
- Est. fire insurance / yr
- $659 – $1,223
Heat risk 7/10 · Major
- Hot days now (above 102°F)
- 7 days/yr
- Hot days in 30 yrs
- 17 days/yr
Wind risk 1/10 · Minimal
- Chance of severe wind over 30 yrs
- —
Air-quality risk 10/10 · Severe
- Unhealthy air days now
- 38 days/yr
- Unhealthy air days in 30 yrs
- 40 days/yr
Risk factors via First Street. Map © Google.
Why this score? — see what drove the C grade
The composite is a weighted blend of 9 inputs, each scored 0–100. Each bar is that input's sub-score; the figure is the points it added to the 100-point composite (weight × sub-score).
- Cash flow +29.1/30.0
- DSCR +10.0/10.0
- 1% rule +8.1/10.0
- Livability +3.2/5.0
- Rent growth +2.5/5.0
- Condition / age +2.5/5.0
- Schools +2.2/10.0
- ARV discount +0.0/15.0
- Appreciation +0.0/10.0
$160,000
🖨 Deal sheet 📄 Offer letter ✓ Due diligence
Listing remarks
Welcoming this remodeled and updated 2 bed, 2 bath home located in a beautiful all-age park! Featuring a great open floor plan when you first walk in, this move-in ready home offers a warm and inviting feel throughout. The open laundry room offers lots of storage space for added convenience. Recent updates include a new roof installed in 2025, newer furnace, dual-pane windows, all new blinds, fresh landscaping, a new outdoor shed, and much more! Enjoy affordable living with low space rent and great community amenities including a soccer field and playground area for kids. This is a great park to call home come check it out, this one won't last long!
Key facts
- Remodeled
- Open floor plan
- Updated
Tags
Property features AI
Finance
- Other: Located in Modesto, CA 95357 (use GPS for park directions)
- Financial info: Land lease: No (listed land lease amount present)
- HOA & community: No association
Exterior
- Parking: Covered parking
- Utilities: Public water; Public sewer; 220 volts in kitchen
- Home design: Manufactured in park (double wide); Fleetwood make; Built in 1984; Updated/remodeled
- Construction: Composition roof; Wood skirting
- Exterior features: Fenced yard; Patio awning and covered patio; Carport awning; Covered porch/deck with railings; Shed(s); Automatic sprinkler front and rear
Interior
- Kitchen: Marble countertops; Free standing refrigerator; Dishwasher; Disposal; Free standing gas oven
- Bedrooms: 2 bedrooms
- Flooring: Wood flooring; Other flooring
- Bathrooms: 2 full bathrooms; Tub with shower over
- Heating & cooling: Central heating; Central air conditioning; Ceiling fan(s)
- Interior features: Updated/remodeled interior; Open beam ceiling in the living area; Dual pane full windows; Porch steps and covered patio/deck with railings; Storage shed on property; Pets allowed
- Laundry & utility: Laundry inside (inside room/area); 220 volt electrical in laundry
Neighborhood map
What this means for you Summary
Snapshot
- This is a 2-bed/2.0-bath manufactured listed at $160k.
Deal economics
- At list price, monthly cash flow is $553 ($7k/yr) — positive.
- The deal already cash-flows at list — no discount required.
- Meets the 1% rule at list price ($2k rent vs $160k).
- Recommended offer: $158k (1.5% below list) — sets the bar for market timing.
- Cap rate 10.4% vs local median 3.4% in Hughson — top-decile yield for the area; either an underpriced asset or a hidden risk that comps aren't pricing in. Stress-test before assuming the spread holds.
Location & tenants
- Location reads 63/100 on livability (#458 in CA) — a middle-class / working-renter tenant base. Strengths: crime A+, housing A+, employment A; Watch: amenities F, commute F, cost of living F.
- Empire Union Elementary (suburban): math 25% / reading 25% proficiency, ranked #398 of 517 in CA (top 77%) — low school quality limits family demand, transient renter base, plan for 1-2y turnover; 67% free/reduced lunch — lower-income household profile, screen leases tightly.
- Market conditions: 91 active listings in the ZIP; 1 comparable units currently listed for rent nearby; 923 units permitted in Stanislaus County in 2024 (63 in 5+ unit buildings).
Forward outlook
- Local home prices are declining (-3.0%/yr); year-one equity from $1k of loan paydown is wiped out by about $5k of value loss. Plan a longer hold.
- Stanislaus County population projected at +14% by 2050 — modest demand growth; plan on rents tracking national, not racing it.
- At projected returns (-3.0% appreciation + 3.0% rent growth), your $45k cash investment doubles in ~8 years — after that, you're playing with house money.
Negotiation context
- It's been on market 29 days — a 2% lower offer ($158k) is reasonable based on typical stale-listing flexibility.
Risks & watch-outs
- Climate carrying-cost: major wildfire risk; extreme-heat days projected 7→17/yr by 2055 (HVAC capex compounding) — expect insurance premiums to compound above CPI over the hold.
Questions for the listing agent
- Is there a deadline driving the sale (1031 exchange, divorce, estate, relocation)? That informs how much negotiation room exists.
- What's the average days-on-market for RENTAL listings here right now (not sales)? A rising rental-DOM trend means longer vacancies and softer asking-rent achievability than the comps imply.
- What's the recent tenant-quality profile in this submarket — average credit score on applications, eviction rate, late-payment / NSF rate, and stable-employment percentage? A property-management company in the area should have these aggregated.
- How much new for-sale + rental construction is in the pipeline within 1–3 miles? Heavy new supply typically softens prices + rents 12–24 months out; constrained supply supports both.
Investment metrics
- 1% rule
- 1.31% ✓
- Cap rate
- 10.44%
- Cash-on-cash
- 14.82%
- DSCR
- 1.66
- GRM
- 6.3
CMA / ARV
- ARV (on-the-fly)
- $118,272
- Comps found
- 6
Show comp detail 6 sales within ~0.75 mi
| Address | Dist | Beds/Ba | Sqft | Sold | Price | $/sf | Match |
|---|---|---|---|---|---|---|---|
| 8200 Jantzen Dr #225 | 0.01mi | 2/2.0 | 1,368 (+2%) | 7mo | $94,000 | $69 | 91 |
| 8200 Jantzen Rd #32 | 0.11mi | 2/2.0 | 1,368 (+2%) | 5mo | $120,000 | $88 | 88 |
| 8200 Jantzen Rd #3 | 0.12mi | 2/2.0 | 1,300 (-3%) | 7mo | $85,000 | $65 | 83 |
| 8200 Jantzen Rd #224 | 0.00mi | 2/2.0 | 1,368 (+2%) | 21mo | $142,500 | $104 | 80 |
| 8200 Jantzen #237 | 0.11mi | 2/2.0 | 1,464 (+9%) | 6mo | $109,900 | $75 | 75 |
| 8200 Jantzen Rd #197 | 0.11mi | 2/2.0 | 1,248 (-7%) | 18mo | $130,000 | $104 | 68 |
Match score weights: distance 35% · size 25% · config 20% · recency 20%. Top-matched comps best support the ARV.
Projected returns pro-forma
-3.0% appreciation · 3.0% rent growth · sell at horizon
- IRR
- 5.4%
- Equity multiple
- 1.21×
- Total profit
- $9,343
- Equity at exit
- $23,857
- IRR
- 14.8%
- Equity multiple
- 2.20×
- Total profit
- $53,640
- Equity at exit
- $13,834
Cash invested: $44,800 (down + closing). Projections, not guarantees.
Landlord ↔ Tenant lean methodology
- Overall (STATE)
- 18 Strongly Tenant-Friendly
- State California
- 18 Strongly Tenant-Friendly · D+13
- County
- — inherits STATE
- City
- — inherits STATE
ZIP-level market 95357
- Home prices YoY
- -28.8%
- Active inventory
- 91
- Price-to-rent
- 6.3×
Monthly cashflow live
- Estimated rent
- $2,100 medium interval (Pro) →
- Mortgage (P&I)
- −$839
- Tax est. 1.5%
- −$200 /mo · $2,400/yr
- Insurance
- −$67
- HOA
- −$0
- Vacancy / Maint / Mgmt
- −$441
- Net cashflow
- $553
Break-even live
UW: 25.0% down · 7.5% · 30yr · 1.5% tax · 5.0% vac · 8.0% maint · 8.0% mgmt
Financing live
Cash to close
- Down payment
- $40,000
- Closing costs
- $4,800
- Reserves months
- —
- Total cash needed
- —
Loan-product check · same deal, 3 products live
Conventional
25% down · 7.5% · 30yr
- Down + closing
- —
- Monthly P&I
- —
- Monthly cashflow
- —
- DSCR
- —
- Eligible?
- —
Personal DTI + credit; lowest rate.
DSCR
20% down · 8.5% · 30yr
- Down + closing
- —
- Monthly P&I
- —
- Monthly cashflow
- —
- DSCR
- —
- Eligible?
- —
No personal income docs; deal must DSCR.
Hard money
10% down · 12.0% · 12mo
- Down + closing
- —
- Monthly P&I
- —
- Monthly cashflow
- —
- DSCR
- —
- Eligible?
- —
Short-term bridge; refi at stabilization.
Rent comps 1 comps
| Address | Beds | Baths | Sqft | Rent | $/sqft | DOM | Units | Dist |
|---|---|---|---|---|---|---|---|---|
| 7237 Yosemite Blvd Modesto, CA | 2.0 | 2.0 | 1200 | $2,100 | $1.75 | 44d | 1 | 1.23mi |
Listing history 16 events
-
2026-06-18days on market $160,000 Active 29 DOM
-
2026-06-17days on market $160,000 Active 28 DOM
-
2026-06-16days on market $160,000 Active 27 DOM
-
2026-06-15price $160,000 Active 26 DOM
-
2026-06-15days on market $170,000 Active 26 DOM
-
2026-06-14days on market $170,000 Active 24 DOM
-
2026-06-10days on market $170,000 Active 21 DOM
-
2026-06-09days on market $170,000 Active 20 DOM
-
2026-06-08days on market $170,000 Active 19 DOM
-
2026-06-07days on market $170,000 Active 18 DOM
-
2026-06-05days on market $170,000 Active 15 DOM
-
2026-06-03days on market $170,000 Active 14 DOM
-
2026-06-02days on market $170,000 Active 13 DOM
-
2026-06-01days on market $170,000 Active 12 DOM
-
2026-05-31days on market $170,000 Active 11 DOM
-
2026-05-30days on market $170,000 Active 10 DOM
ⓘ Source: listings_history table (triggers on properties + properties_extension) + one-shot
backfill from property_details.listing_events for pre-trigger history.
Climate risk First Street
- Flood 1/10 Low FEMA zone X (unshaded) · 0% chance over 30 yrs
- Wildfire 7/10 Severe
- Heat 7/10 Severe 7 d/yr ≥102°F today · 17 d/yr by 30 yrs out
- Wind 1/10 Low
- Air quality 10/10 Extreme 38 unhealthy d/yr today · 40 by 30 yrs out
Nearby sold comps map
Loading sold comps map…
Walkable amenities ~0.75 mi
Loading nearby amenities…
Taxation est. · year 1
- Rental income
- $25,200
- − Mortgage interest
- −$8,962
- − Property taxes
- −$2,400
- − Insurance
- −$800
- − Repairs & maintenance
- −$2,016
- − Management
- −$2,016
- − Depreciation
- −$4,655
- Taxable income
- $4,351
- Est. tax owed @ 24.0%
- −$1,044
- After-tax cash flow
- $5,595/yr
For passive investors: Depreciation is non-cash, so a rental often shows a tax loss while cash-flowing — sheltering income. Rental losses are passive: they offset passive income freely, and up to $25,000/yr can offset ordinary (W-2) income if you actively participate and your MAGI is under $100k (phasing out to $0 by $150k); unused losses carry forward. On sale, claimed depreciation is recaptured at up to 25%, and gains may owe capital-gains tax (a 1031 exchange can defer both). Figures are a year-1 estimate at your 24.0% rate — not tax advice; consult a CPA.
Schools (NCES district)
- District
- Empire Union Elementary
- NCES district ID
- 0612690
- Math proficiency
- 25% ▼ -6.00%
- Reading proficiency
- 25% ▼ -14.00%
- Median HH income
- $49,808
- Composite
- 22.05/100
- National rank
- #8193
- State rank
- #398 of 517 in CA
Livability — Hughson
- Score
- 63/100
- State rank
- #458
- US rank
- #15641
Category grades
Schools grade is shown separately in the Schools card above.
Census & demographics
- City population
- 225,261
- Population (ZIP)
- 14,283
Population outlook (Stanislaus County) Hauer SSP2
- Today (2025)
- 579,493 people
- By 2030
- 598,000 · +3.2%
- By 2040
- 630,930 · +8.9%
- By 2050
- 658,300 · +13.6%
- By 2075
- 712,363 · +22.9%
- By 2100
- 719,805 · +24.2%
Race, ethnicity, and origin ACS 2023
- Neighborhood character
- Diverse neighborhood (Simpson 0.64)
- Race & ethnicity
- Hispanic / Latino 46% White 37% Two or more races 16% Black 6% Asian 5% Native American 2% Pacific Islander 1%
- Hispanic origin (detail)
- Mexican 42%
- Common ancestry
- Russian 3% Italian 2% Iranian 2%
- Foreign-born
- 19% · Canada
- Languages at home
- 59% English-only · Spanish 31% Other Asian/Pacific 2% Other Indo-European 2%
Political lean MEDSL · Stanislaus
- 2024 margin
- R (+11.0) · D 43.2% · R 54.2% · Other 2.6%
- 2008→2024 swing
- -12.7pp toward R · 2008: 1.7pp · 2024: -11.0pp
- All cycles
- 2024: R+11.0 2020: D+0.8 2016: D+0.6 2012: D+0.7 2008: D+1.7
Not yet ingested
- Civics
- —
Market trends
- HPI YoY
- ▼ -114.94%
- Current HPI
- 283.9315
- Rent YoY
- —
- Metro
- —
- State GDP YoY
- ▲ 3.21%
- F500 in state
- 116
Industry mix (Fortune 500 HQ in CA)
| Industry | F500 HQs | Revenue |
|---|---|---|
| Technology | 27 | $1,492B |
|
||
| Financial Services | 3 | $174B |
|
||
| Retail | 3 | $44B |
|
||
| Insurance | 3 | $26B |
|
||
| Media / Entertainment | 2 | $115B |
|
||
| Pharmaceuticals / Biotech | 2 | $62B |
|
||
Cash-flow waterfall
monthlySold comps — $/sqft
last 12 mo · ≤1 miLoading sold comps…