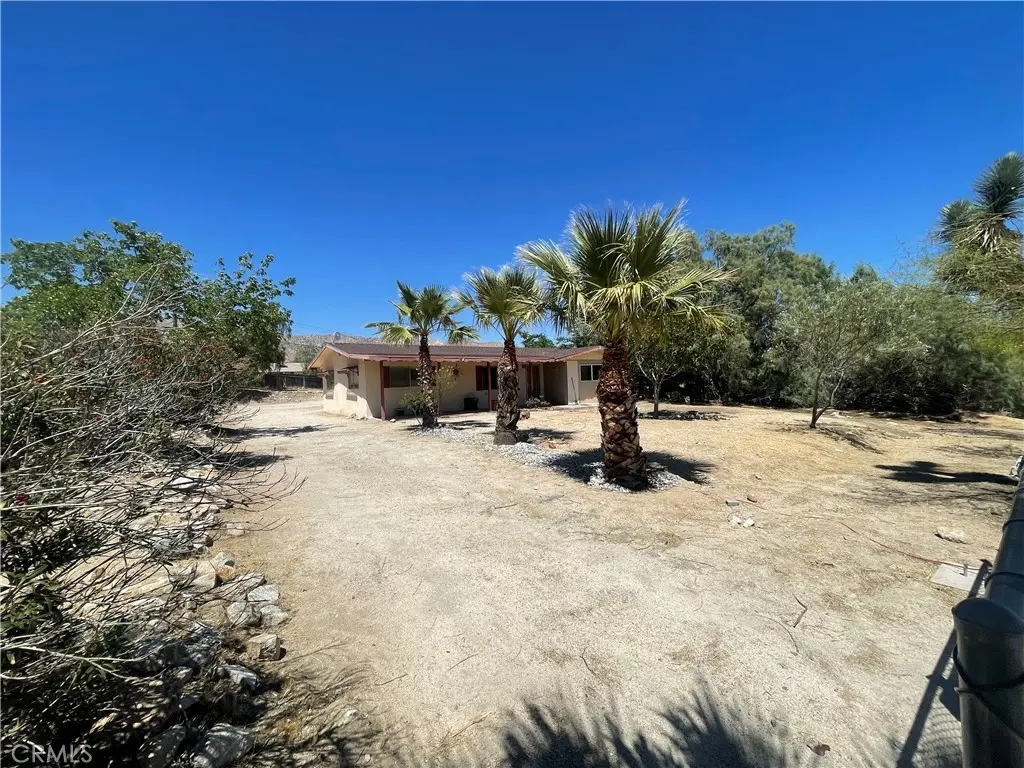
49116 Hibiscus · Morongo Valley, CA
Flood risk 1/10 · Minimal
- FEMA flood zone
- X (unshaded)
- Chance of flooding over 30 yrs
- 0.0%
- Est. flood insurance / yr
- $507 – $1,088
Fire risk 8/10 · Major
- Est. fire insurance / yr
- $659 – $1,223
Heat risk 7/10 · Major
- Hot days now (above 102°F)
- 8 days/yr
- Hot days in 30 yrs
- 23 days/yr
Wind risk 1/10 · Minimal
- Chance of severe wind over 30 yrs
- —
Air-quality risk 6/10 · Moderate
- Unhealthy air days now
- 11 days/yr
- Unhealthy air days in 30 yrs
- 15 days/yr
Risk factors via First Street. Map © Google.
Why this score? — see what drove the D grade
The composite is a weighted blend of 9 inputs, each scored 0–100. Each bar is that input's sub-score; the figure is the points it added to the 100-point composite (weight × sub-score).
- ARV discount +11.2/15.0
- Cash flow +8.2/30.0
- Appreciation +7.8/10.0
- Livability +3.1/5.0
- Rent growth +2.5/5.0
- Condition / age +2.5/5.0
- DSCR +2.2/10.0
- Schools +2.2/10.0
- 1% rule +1.4/10.0
$314,500
🖨 Deal sheet 📄 Offer letter ✓ Due diligence
Listing remarks MLS
Cute home with a large fenced in lot. This home is in need of some TLC and updating. It has a two car detached garage with workshop and separate bathroom that buyer should verify if permitted. Fannie Mae has limited the resale of this property for up to one year to buyers who intend on being owner occupants. Great potential. This home is sold as is and is a superb real estate value!
Key facts
- 0.41 acre lot
- 2 garage spots
- Built 1963
Property features AI
Finance
- Other: Access via paved country road; Lot characterized as 0-1 unit/acre; Living area source: Assessor's data; Parcel number on file
- Financial info: Subject to special assessments
- HOA & community: Rural, foothills community
Exterior
- Parking: Two garage spaces; Side-entry two-door garage with workshop area; Two total parking spaces
- Utilities: Public water (district); Water connected; Septic (type unknown)
- Home design: Single-family house; Single-story property; Front entry; Has a view; No accessory dwelling unit
- Construction: Year built source: Assessor
- Exterior features: Chain link fencing; Covered patio; No pool
Interior
- Kitchen: Formal dining area and dining space in the kitchen
- Bedrooms: Three bedrooms on the main level
- Bathrooms: Two full bathrooms with shower and shower-in-tub options
- Heating & cooling: Central cooling; Evaporative cooling
- Interior features: One-story home with front entry; All bedrooms on the main level; Covered patio
- Laundry & utility: Laundry located in the garage
Neighborhood map
What this means for you Summary
Snapshot
- This is a 2-bed/1.0-bath single-family listed at $314k.
Deal economics
- At list price, monthly cash flow is $-293 ($-4k/yr) — negative.
- To cash-flow at today's rent, offer at most $263k (16.5% below list).
- To meet the 1% rule (rent ≥ 1% of price), the offer needs to be $200k (36.4% below list).
- Recommended offer: $200k (36.4% below list) — sets the bar for 1% rule.
- Cap rate 5.2% vs local median 4.1% in Morongo Valley — meaningfully above typical; check what's discounted (condition, days-on-market, listing class) to confirm the premium yield is real.
Location & tenants
- Location reads 62/100 on livability (#505 in CA) — a middle-class / working-renter tenant base. Strengths: housing A+; Watch: cost of living C-, schools D+, amenities F.
- Morongo Unified (town): math 15% / reading 38% proficiency, ranked #395 of 517 in CA (top 76%) — low school quality limits family demand, transient renter base, plan for 1-2y turnover.
- Market conditions: 75 active listings in the ZIP; 1 comparable units currently listed for rent nearby; 5,458 units permitted in San Bernardino County in 2024 (1,500 in 5+ unit buildings).
Forward outlook
- In year one you build about $20k of equity ($2k loan paydown + $18k appreciation (5.6% local appreciation)).
- San Bernardino County population projected at +15% by 2050 — modest demand growth; plan on rents tracking national, not racing it.
- By year 2, paydown + projected appreciation supports a ~$32k cash-out refi (75% LTV) — recoverable capital for the next deal without selling this one.
Negotiation context
- It's been on market 34 days — a 3% lower offer ($305k) is reasonable based on typical stale-listing flexibility.
- 3 sale attempts since 15y ago with the ask held roughly flat each time — persistent listings suggest the price (not the market) is what's stuck; bring a comps-based counter.
- Current owner paid $41k; list at $314k implies a 669% gain — meaningful room to come down on a strong offer.
Risks & watch-outs
- Climate carrying-cost: severe wildfire risk; extreme-heat days projected 8→23/yr by 2055 (HVAC capex compounding) — expect insurance premiums to compound above CPI over the hold.
Questions for the listing agent
- What do current leases actually rent for vs. the listed asking? Can we see a recent rent roll and the last 12 months of T-12 income?
- It's been on market 34 days. Have you received any prior offers? Is the seller open to a 36% concession, seller financing, or rate buy-down credit?
- Built in 1963 — when were the roof, HVAC, electrical panel, plumbing, and water heater last replaced?
- Is there a deadline driving the sale (1031 exchange, divorce, estate, relocation)? That informs how much negotiation room exists.
- Schools are D-rated, which usually means shorter tenancies and higher turnover. Who's the typical renter profile here, and what's been the actual vacancy rate?
- The area grade is low — what's the realistic commute time and amenity access for the typical tenant pool here? Any planned neighborhood developments (good or bad) we should know about?
- What's the average days-on-market for RENTAL listings here right now (not sales)? A rising rental-DOM trend means longer vacancies and softer asking-rent achievability than the comps imply.
- What's the recent tenant-quality profile in this submarket — average credit score on applications, eviction rate, late-payment / NSF rate, and stable-employment percentage? A property-management company in the area should have these aggregated.
- How much new for-sale + rental construction is in the pipeline within 1–3 miles? Heavy new supply typically softens prices + rents 12–24 months out; constrained supply supports both.
Investment metrics
- 1% rule
- 0.64% ✗
- Cap rate
- 5.17%
- Cash-on-cash
- -3.99%
- DSCR
- 0.82
- GRM
- 13.1
CMA / ARV
- ARV (median comp)
- $342,786
- List price
- $314,500
- Delta
- -8.25%
- Verdict
- FAIR
- Comps
- 20 within 1.0 mi
Show comp detail 11 sales within ~0.75 mi
| Address | Dist | Beds/Ba | Sqft | Sold | Price | $/sf | Match |
|---|---|---|---|---|---|---|---|
| 49126 Park Ave | 0.09mi | 3/2.0 (+1) | 1,118 (-1%) | 1mo | $335,000 | $300 | 85 |
| 11051 Pinon Ave | 0.08mi | 2/2.0 | 1,238 (+10%) | 11mo | $485,000 | $392 | 67 |
| 49167 Hibiscus Dr | 0.08mi | 3/2.0 (+1) | 1,035 (-8%) | 18mo | $330,000 | $319 | 59 |
| 49261 Buena Vista Dr | 0.20mi | 2/2.0 | 1,040 (-8%) | 19mo | $335,000 | $322 | 58 |
| 49432 Canyon House Rd | 0.70mi | 3/2.0 (+1) | 1,136 (+1%) | 15mo | $338,000 | $298 | 44 |
| 49247 Matzene Dr | 0.53mi | 1/1.0 (-1) | 1,227 (+9%) | 14mo | $240,000 | $196 | 44 |
| 49323 Matzene Dr | 0.56mi | 3/2.0 (+1) | 1,231 (+9%) | 9mo | $340,000 | $276 | 42 |
| 49290 Park Ave | 0.23mi | 2/2.0 | 1,296 (+15%) | 23mo | $325,000 | $251 | 41 |
| 11010 Knobb Ave | 0.45mi | 3/1.0 (+1) | 982 (-13%) | 15mo | $232,000 | $236 | 40 |
| 49466 Mojave Dr | 0.44mi | 3/2.0 (+1) | 1,272 (+13%) | 11mo | $330,000 | $259 | 40 |
| 49535 Park Ave | 0.54mi | 2/2.0 | 1,286 (+14%) | 17mo | $300,000 | $233 | 33 |
Match score weights: distance 35% · size 25% · config 20% · recency 20%. Top-matched comps best support the ARV.
Projected returns pro-forma
5.61% appreciation · 3.0% rent growth · sell at horizon
- IRR
- 11.1%
- Equity multiple
- 1.73×
- Total profit
- $64,671
- Equity at exit
- $189,931
- IRR
- 12.2%
- Equity multiple
- 3.35×
- Total profit
- $206,643
- Equity at exit
- $337,911
Cash invested: $88,060 (down + closing). Projections, not guarantees.
Landlord ↔ Tenant lean methodology
- Overall (STATE)
- 18 Strongly Tenant-Friendly
- State California
- 18 Strongly Tenant-Friendly · D+13
- County
- — inherits STATE
- City
- — inherits STATE
ZIP-level market 92256
- Home prices YoY
- 1.1%
- Active inventory
- 75
- Price-to-rent
- 13.1×
Monthly cashflow live
- Estimated rent
- $2,000 medium interval (Pro) →
- Mortgage (P&I)
- −$1,649
- Tax from tax record
- −$93 /mo · $1,113/yr
- Insurance
- −$131
- HOA
- −$0
- Vacancy / Maint / Mgmt
- −$420
- Net cashflow
- $-293
Break-even live
UW: 25.0% down · 7.5% · 30yr · 1.5% tax · 5.0% vac · 8.0% maint · 8.0% mgmt
Financing live
Cash to close
- Down payment
- $78,625
- Closing costs
- $9,435
- Reserves months
- —
- Total cash needed
- —
Loan-product check · same deal, 3 products live
Conventional
25% down · 7.5% · 30yr
- Down + closing
- —
- Monthly P&I
- —
- Monthly cashflow
- —
- DSCR
- —
- Eligible?
- —
Personal DTI + credit; lowest rate.
DSCR
20% down · 8.5% · 30yr
- Down + closing
- —
- Monthly P&I
- —
- Monthly cashflow
- —
- DSCR
- —
- Eligible?
- —
No personal income docs; deal must DSCR.
Hard money
10% down · 12.0% · 12mo
- Down + closing
- —
- Monthly P&I
- —
- Monthly cashflow
- —
- DSCR
- —
- Eligible?
- —
Short-term bridge; refi at stabilization.
Rent comps 1 comps
| Address | Beds | Baths | Sqft | Rent | $/sqft | DOM | Units | Dist |
|---|---|---|---|---|---|---|---|---|
| 11010 Knobb Ave Morongo Valley, CA | 3.0 | 1.0 | 1000 | $2,000 | $2.00 | 22d | 1 | 0.47mi |
Listing history 24 events
-
2026-06-18days on market $314,500 Active 34 DOM
-
2026-06-17days on market $314,500 Active 33 DOM
-
2026-06-16days on market $314,500 Active 32 DOM
-
2026-06-15days on market $314,500 Active 31 DOM
-
2026-06-13days on market $314,500 Active 29 DOM
-
2026-06-13days on market $314,500 Active 28 DOM
-
2026-06-09days on market $314,500 Active 25 DOM
-
2026-06-08days on market $314,500 Active 24 DOM
-
2026-06-07days on market $314,500 Active 23 DOM
-
2026-06-04days on market $314,500 Active 20 DOM
-
2026-06-03days on market $314,500 Active 19 DOM
-
2026-06-02days on market $314,500 Active 18 DOM
-
2026-06-01days on market $314,500 Active 17 DOM
-
2026-05-31days on market $314,500 Active 16 DOM
-
2026-05-16$314,500 Active 929-char remark
-
2026-05-15historical $314,500 929-char remark
-
2011-09-23historical 385-char remark
Show marketing remark (385 chars)
Cute home with a large fenced in lot. This home is in need of some TLC and updating. It has a two car detached garage with workshop and separate bathroom that buyer should verify if permitted. Fannie Mae has limited the resale of this property for up to one year to buyers who intend on being owner occupants. Great potential. This home is sold as is and is a superb real estate value!
-
2011-09-23soldstatus $40,900 Closed 385-char remark
Show marketing remark (385 chars)
Cute home with a large fenced in lot. This home is in need of some TLC and updating. It has a two car detached garage with workshop and separate bathroom that buyer should verify if permitted. Fannie Mae has limited the resale of this property for up to one year to buyers who intend on being owner occupants. Great potential. This home is sold as is and is a superb real estate value!
-
2011-09-13historical Contingent 385-char remark
Show marketing remark (385 chars)
Cute home with a large fenced in lot. This home is in need of some TLC and updating. It has a two car detached garage with workshop and separate bathroom that buyer should verify if permitted. Fannie Mae has limited the resale of this property for up to one year to buyers who intend on being owner occupants. Great potential. This home is sold as is and is a superb real estate value!
-
2011-09-01$40,900 Active 385-char remark
Show marketing remark (385 chars)
Cute home with a large fenced in lot. This home is in need of some TLC and updating. It has a two car detached garage with workshop and separate bathroom that buyer should verify if permitted. Fannie Mae has limited the resale of this property for up to one year to buyers who intend on being owner occupants. Great potential. This home is sold as is and is a superb real estate value!
-
2011-07-21historical
-
2011-04-29$55,900
-
2004-12-02soldstatus $150,000
-
1978-07-01soldstatus $35,000
ⓘ Source: listings_history table (triggers on properties + properties_extension) + one-shot
backfill from property_details.listing_events for pre-trigger history.
Tax reassessment forecast CA · Resets to sale price
- Current annual tax
- $1,113 · $93/mo
- Projected year-2 tax
- $2,390 · $199/mo
- Expected delta
- +$1,277/yr (+$106/mo · 114.7%)
ⓘ Screening estimate from a state-policy table — verify with the county assessor before closing.
Climate risk First Street
- Flood 1/10 Low FEMA zone X (unshaded) · 0% chance over 30 yrs
- Wildfire 8/10 Severe
- Heat 7/10 Severe 8 d/yr ≥102°F today · 23 d/yr by 30 yrs out
- Wind 1/10 Low
- Air quality 6/10 Major 11 unhealthy d/yr today · 15 by 30 yrs out
Nearby sold comps map
Loading sold comps map…
Walkable amenities ~0.75 mi
Loading nearby amenities…
Taxation est. · year 1
- Rental income
- $24,000
- − Mortgage interest
- −$17,617
- − Property taxes
- −$1,113
- − Insurance
- −$1,572
- − Repairs & maintenance
- −$1,920
- − Management
- −$1,920
- − Depreciation
- −$9,149
- Taxable loss
- −$9,292
- Est. tax savings @ 24.0%
- +$2,230
- After-tax cash flow
- $-1,287/yr
For passive investors: Depreciation is non-cash, so a rental often shows a tax loss while cash-flowing — sheltering income. Rental losses are passive: they offset passive income freely, and up to $25,000/yr can offset ordinary (W-2) income if you actively participate and your MAGI is under $100k (phasing out to $0 by $150k); unused losses carry forward. On sale, claimed depreciation is recaptured at up to 25%, and gains may owe capital-gains tax (a 1031 exchange can defer both). Figures are a year-1 estimate at your 24.0% rate — not tax advice; consult a CPA.
Schools (NCES district)
- District
- Morongo Unified
- NCES district ID
- 0625860
- Math proficiency
- 15% ▼ -12.00%
- Reading proficiency
- 38% ▼ -3.00%
- Median HH income
- $39,399
- Composite
- 22.19/100
- National rank
- #8156
- State rank
- #395 of 517 in CA
Livability — Morongo Valley
- Score
- 62/100
- State rank
- #505
- US rank
- #17106
Category grades
Schools grade is shown separately in the Schools card above.
Census & demographics
- Census place
- Morongo Valley, CA
- Population (ZIP)
- 3,907
Population outlook (San Bernardino County) Hauer SSP2
- Today (2025)
- 2,300,329 people
- By 2030
- 2,378,907 · +3.4%
- By 2040
- 2,523,137 · +9.7%
- By 2050
- 2,642,388 · +14.9%
- By 2075
- 2,880,769 · +25.2%
- By 2100
- 2,909,436 · +26.5%
Race, ethnicity, and origin ACS 2023
- Neighborhood character
- Majority White (62%)
- Race & ethnicity
- White 62% Hispanic / Latino 31% Two or more races 12% Black 3% Native American 2%
- Hispanic origin (detail)
- Mexican 16% Cuban 4%
- Common ancestry
- Romanian 4% Italian 3% Lithuanian 2%
- Foreign-born
- 12% · Canada
- Languages at home
- 77% English-only · Spanish 19% German/W. Germanic 1% Tagalog/Filipino 1%
Political lean MEDSL · San Bernardino
- 2024 margin
- Toss-up / Even · D 47.5% · R 49.7% · Other 2.8%
- 2008→2024 swing
- -8.5pp toward R · 2008: 6.3pp · 2024: -2.1pp
- All cycles
- 2024: R+2.1 2020: D+10.7 2016: D+9.8 2012: D+5.4 2008: D+6.3
Not yet ingested
- Civics
- —
Market trends
- HPI YoY
- ▲ 5.61%
- Current HPI
- 526.1914
- Rent YoY
- —
- Metro
- —
- State GDP YoY
- ▲ 3.21%
- F500 in state
- 116
Industry mix (Fortune 500 HQ in CA)
| Industry | F500 HQs | Revenue |
|---|---|---|
| Technology | 27 | $1,492B |
|
||
| Financial Services | 3 | $174B |
|
||
| Retail | 3 | $44B |
|
||
| Insurance | 3 | $26B |
|
||
| Media / Entertainment | 2 | $115B |
|
||
| Pharmaceuticals / Biotech | 2 | $62B |
|
||
Price history
+798.6% since first listed10 events — show timeline
- 2026-05-16 Listed $314,500 CRMLS
- 2026-05-15 Coming Soon $314,500 CRMLS
- 2011-09-23 Listing Removed — GPSMLS
- 2011-09-23 Sold (MLS) $40,900 GPSMLS
- 2011-09-13 Contingent — GPSMLS
- 2011-09-01 Listed $40,900 GPSMLS
- 2011-07-21 Listing Removed — CRMLS
- 2011-04-29 Listed $55,900 CRMLS
- 2004-12-02 Sold (Public Records) $150,000 Public Records
- 1978-07-01 Sold (Public Records) $35,000 Public Records
Property tax history
-2.9%/yrLatest (2025): $1,113 · +4.4% YoY. Source: county tax records.
Cash-flow waterfall
monthlySold comps — $/sqft
last 12 mo · ≤1 miLoading sold comps…