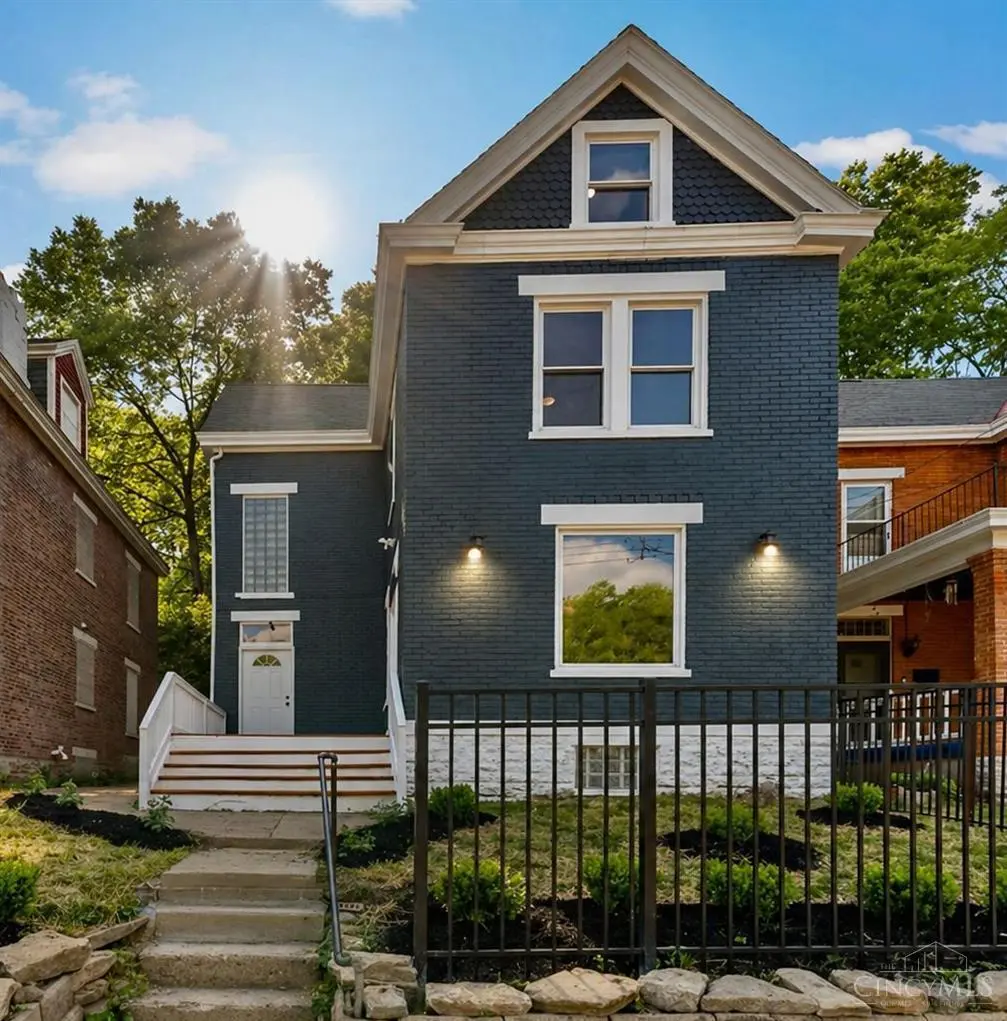
1959 Baltimore Ave · Cincinnati, OH
Flood risk 9/10 · Severe
- FEMA flood zone
- X (unshaded)
- Chance of flooding over 30 yrs
- 0.99%
- Est. flood insurance / yr
- $473 – $860
Fire risk 1/10 · Minimal
- Est. fire insurance / yr
- $713 – $1,323
Heat risk 4/10 · Minor
- Hot days now (above 103°F)
- 7 days/yr
- Hot days in 30 yrs
- 19 days/yr
Wind risk 2/10 · Minimal
- Chance of severe wind over 30 yrs
- 1.0%
Air-quality risk 3/10 · Minor
- Unhealthy air days now
- 3 days/yr
- Unhealthy air days in 30 yrs
- 5 days/yr
Risk factors via First Street. Map © Google.
Why this score? — see what drove the D+ grade
The composite is a weighted blend of 9 inputs, each scored 0–100. Each bar is that input's sub-score; the figure is the points it added to the 100-point composite (weight × sub-score).
- Cash flow +11.5/30.0
- Appreciation +10.0/10.0
- ARV discount +7.5/15.0
- Livability +4.0/5.0
- DSCR +3.4/10.0
- Rent growth +2.5/5.0
- Schools +2.5/10.0
- Condition / age +2.5/5.0
- 1% rule +2.4/10.0
$259,000
🖨 Deal sheet (PDF) 📄 Offer letter ✓ Due diligence
Listing remarks MLS
Great investment opportunity. Already has tenant producing rental income. Put your finishing touches and increase those numbers. Loads of potential in this 5 bedroom 2 bath home. Tons of space & possibilities. Could be used as first floor bedrooms as well.
Key facts
- Bright living area
- Formal dining room
- Brand new roof
Tags
Property features AI
Finance
- Other: Zoned residential; Lot approximately 0.103 acres
- HOA & community: No HOA
Exterior
- Parking: On-street parking
- Security: Smoke alarm
- Utilities: Public water; Public sewer; Natural gas service; Gas water heater; Electric power (standard connections)
- Home design: Traditional / Historical style; Single-family home; Three-plus levels; Stone foundation; Shingle roof; Smart technology for appliances and HVAC
- Construction: Brick construction
- Exterior features: Deck; Metal fencing; Vinyl windows; Public water and public sewer
Interior
- Kitchen: Walkout kitchen; Wood cabinets; Wood flooring in kitchen; Kitchen dimensions approximately 14 x 11; Includes dishwasher, microwave, oven/range, refrigerator
- Bedrooms: 5 bedrooms total; Primary bedroom on level 2 (15 x 14); Bedroom 2 on level 2 (14 x 12); Bedroom 3 on level 2 (12 x 12); Bedroom 4 on level 3 (13 x 19); Bedroom 5 on level 3 (14 x 15)
- Flooring: Wood floors in kitchen, dining room, and living room
- Bathrooms: 2 full bathrooms; Primary bathroom includes bidet; One full bathroom on level 1 and one full bathroom on level 2
- Heating & cooling: Forced air heating (gas); Central air conditioning; Gas water heating
- Interior features: 9-foot (and higher) ceilings; Beam ceiling; Natural woodwork; Smoke alarm
- Laundry & utility: Washer and dryer included
Neighborhood map
What this means for you Summary
Snapshot
- This is a 4-bed/2.0-bath single-family listed at $259k.
Deal economics
- At list price, monthly cash flow is $-141 ($-2k/yr) — negative.
- To cash-flow at today's rent, offer at most $234k (9.6% below list).
- To meet the 1% rule (rent ≥ 1% of price), the offer needs to be $191k (26.1% below list).
- Recommended offer: $191k (26.1% below list) — sets the bar for 1% rule.
- Cap rate 5.9% vs local median 3.9% in Cincinnati — top-decile yield for the area; either an underpriced asset or a hidden risk that comps aren't pricing in. Stress-test before assuming the spread holds.
Location & tenants
- Location reads 80/100 on livability (#130 in OH, #1,856 nationally) — a professional / high-income tenant draw. Strengths: amenities A+, commute A+, cost of living A+; Watch: employment D, crime F.
- Cincinnati Public Schools (urban): math 25% / reading 36% proficiency, ranked #581 of 656 in OH (top 89%) — families likely to look elsewhere, expect single-tenant / working-renter base with shorter leases; 70% free/reduced lunch — lower-income household profile, screen leases tightly.
- Zoned schools: Roberts Academy (math 16% / reading 22%, grade F, #1,320 of 1,584 statewide, top 83%, 765 students, 0% FRL); Hartwell School (math 17% / reading 31%, grade F, #593 of 654 statewide, top 91%, 447 students, 0% FRL); Walnut Hills High School (math 79% / reading 89%, grade A, #17 of 781 statewide, top 2%, 2,582 students, 14% FRL) — zoned schools average 5% FRL vs 70% district-wide (66 pts lower); this property's tenant base skews higher-income than the district average.
- Market conditions: 32 active listings in the ZIP; 4 comparable units currently listed for rent nearby; rentals at typical pace (median 26d on market — plan ~3-4 weeks tenant-placement turnaround); lower-income renter base — watch delinquency; 801 units permitted in Hamilton County in 2024 (190 in 5+ unit buildings).
- At $1,913/mo this rent would consume 113% of the median local household income ($20k/yr) (locally 1466% of renters already pay >50% of income on rent) — very limited rent-growth headroom before tenants either downsize or default.
Forward outlook
- In year one you build about $28k of equity ($2k loan paydown + $26k appreciation (10.0% local appreciation)).
- By year 2, paydown + projected appreciation supports a ~$45k cash-out refi (75% LTV) — recoverable capital for the next deal without selling this one.
Negotiation context
- It's been on market 44 days — a 3% lower offer ($251k) is reasonable based on typical stale-listing flexibility.
- 15 sale attempts since 22y ago with the ask held roughly flat each time — persistent listings suggest the price (not the market) is what's stuck; bring a comps-based counter.
- Current owner paid $85k; list at $259k implies a 205% gain — meaningful room to come down on a strong offer.
Risks & watch-outs
- Watch-outs: flood insurance adds $56/mo; built in 1913 — expect roof / HVAC / electrical / plumbing capex.
- Climate carrying-cost: severe flood risk — expect insurance premiums to compound above CPI over the hold.
Questions for the listing agent
- What do current leases actually rent for vs. the listed asking? Can we see a recent rent roll and the last 12 months of T-12 income?
- It's been on market 44 days. Have you received any prior offers? Is the seller open to a 26% concession, seller financing, or rate buy-down credit?
- Built in 1913 — when were the roof, HVAC, electrical panel, plumbing, and water heater last replaced?
- What's the actual annual flood-insurance premium (NFIP or private), and is the property in a SFHA with mandatory coverage?
- Is there a deadline driving the sale (1031 exchange, divorce, estate, relocation)? That informs how much negotiation room exists.
- Schools are B-rated — typically a magnet for longer-tenancy family renters. What's the average tenant stay here, and is there a school-zone premium baked into asking?
- Crime grade is F in this area — have there been break-ins, vandalism, or insurance claims at this property in the last 3 years? What carrier currently insures it and at what premium?
- The area grade is low — what's the realistic commute time and amenity access for the typical tenant pool here? Any planned neighborhood developments (good or bad) we should know about?
- What's the average days-on-market for RENTAL listings here right now (not sales)? A rising rental-DOM trend means longer vacancies and softer asking-rent achievability than the comps imply.
- What's the recent tenant-quality profile in this submarket — average credit score on applications, eviction rate, late-payment / NSF rate, and stable-employment percentage? A property-management company in the area should have these aggregated.
- How much new for-sale + rental construction is in the pipeline within 1–3 miles? Heavy new supply typically softens prices + rents 12–24 months out; constrained supply supports both.
Investment metrics
- 1% rule
- 0.74% ✗
- Cap rate
- 5.90%
- Cash-on-cash
- -1.42%
- DSCR
- 0.94
- GRM
- 11.3
CMA / ARV
- ARV (on-the-fly)
- $129,339
- Comps found
- 9
Show comp detail 9 sales within ~0.75 mi
| Address | Dist | Beds/Ba | Sqft | Sold | Price | $/sf | Match |
|---|---|---|---|---|---|---|---|
| 1859 Baltimore Ave | 0.25mi | 4/2.0 | 2,350 (+14%) | 4mo | $148,000 | $63 | 62 |
| 1827 Carll St | 0.29mi | 3/2.0 (-1) | 1,866 (-9%) | 9mo | $50,000 | $27 | 59 |
| 1700 Pulte St | 0.55mi | 4/2.0 | 2,014 (-2%) | 21mo | $80,250 | $40 | 54 |
| 1756 Carll St | 0.45mi | 4/3.0 | 1,846 (-10%) | 6mo | $203,900 | $110 | 53 |
| 1619 Hopple Ct | 0.61mi | 3/1.5 (-1) | 1,984 (-3%) | 8mo | $158,000 | $80 | 52 |
| 1704 Pulte St | 0.54mi | 4/1.0 | 1,888 (-8%) | 6mo | $60,000 | $32 | 52 |
| 2016 Queen City Ave | 0.72mi | 3/2.5 (-1) | 2,099 (+2%) | 5mo | $200,000 | $95 | 52 |
| 3011 Cavanaugh Ave | 0.68mi | 4/1.0 | 1,764 (-14%) | 15mo | $95,000 | $54 | 29 |
| 3340 Ninann Ct | 0.63mi | 3/1.5 (-1) | 1,750 (-15%) | 20mo | $130,000 | $74 | 23 |
Match score weights: distance 35% · size 25% · config 20% · recency 20%. Top-matched comps best support the ARV.
Projected returns pro-forma
10.0% appreciation · 3.0% rent growth · sell at horizon
- IRR
- 22.6%
- Equity multiple
- 2.82×
- Total profit
- $131,996
- Equity at exit
- $233,328
- IRR
- 20.2%
- Equity multiple
- 6.46×
- Total profit
- $395,679
- Equity at exit
- $503,180
Cash invested: $72,520 (down + closing). Projections, not guarantees.
Landlord ↔ Tenant lean methodology
- Overall (STATE)
- 73 Landlord-Friendly
- State Ohio
- 73 Landlord-Friendly · R+6
- County
- — inherits STATE
- City
- — inherits STATE
ZIP-level market 45225
- Home prices YoY
- 4.6%
- Active inventory
- 32
- Price-to-rent
- 11.3×
Monthly cashflow live
- Estimated rent
- $1,913 medium interval (Pro) →
- Mortgage (P&I)
- −$1,358
- Tax from tax record
- −$131 /mo · $1,573/yr
- Insurance
- −$108
- Flood insurance flood zone
- −$56 /mo · $666/yr
- HOA
- −$0
- Vacancy / Maint / Mgmt
- −$402
- Net cashflow
- $-141
Break-even live
Sensitivity live
| Price | -10% $5 | -5% $-68 | +0% $-141 | +5% $-215 | +10% $-288 |
|---|---|---|---|---|---|
| Rent | -10% $-293 | -5% $-217 | +0% $-141 | +5% $-66 | +10% $10 |
| Rate | -1.0pp $-11 | -0.5pp $-76 | base $-141 | +0.5pp $-209 | +1.0pp $-277 |
UW: 25.0% down · 7.5% · 30yr · 1.5% tax · 5.0% vac · 8.0% maint · 8.0% mgmt
Financing live
Cash to close
- Down payment
- $64,750
- Closing costs
- $7,770
- Reserves months
- —
- Total cash needed
- —
Loan-product check · same deal, 3 products live
Conventional
25% down · 7.5% · 30yr
- Down + closing
- —
- Monthly P&I
- —
- Monthly cashflow
- —
- DSCR
- —
- Eligible?
- —
Personal DTI + credit; lowest rate.
DSCR
20% down · 8.5% · 30yr
- Down + closing
- —
- Monthly P&I
- —
- Monthly cashflow
- —
- DSCR
- —
- Eligible?
- —
No personal income docs; deal must DSCR.
Hard money
10% down · 12.0% · 12mo
- Down + closing
- —
- Monthly P&I
- —
- Monthly cashflow
- —
- DSCR
- —
- Eligible?
- —
Short-term bridge; refi at stabilization.
Rent comps 4 comps
| Address | Beds | Baths | Sqft | Rent | $/sqft | DOM | Units | Dist |
|---|---|---|---|---|---|---|---|---|
| 1852 Knox St Cincinnati, OH | 4.0 | 1.5 | 1747 | $1,850 | $1.06 | 25d | 1 | 0.61mi |
| 3350 Cavanaugh Ave Cincinnati, OH | 4.0 | 2.5 | 2309 | $1,995 | $0.86 | 25d | 1 | 0.79mi |
| 3157 Sunshine Ave Cincinnati, OH | 3.0 | 2.0 | 1894 | $1,825 | $0.96 | 5d | 1 | 1.10mi |
| 1241 Bates Ave Cincinnati, OH | 3.0 | 2.5 | 2100 | $1,875 | $0.89 | 25d | 1 | 1.29mi |
Listing history 50 events
-
2026-06-21days on market $259,000 Active 44 DOM
-
2026-06-18days on market $259,000 Active 41 DOM
-
2026-06-17days on market $259,000 Active 40 DOM
-
2026-06-16days on market $259,000 Active 39 DOM
-
2026-06-15days on market $259,000 Active 38 DOM
-
2026-06-13days on market $259,000 Active 36 DOM
-
2026-06-13days on market $259,000 Active 35 DOM
-
2026-06-09days on market $259,000 Active 32 DOM
-
2026-06-08days on market $259,000 Active 31 DOM
-
2026-06-07days on market $259,000 Active 30 DOM
-
2026-06-03days on market $259,000 Active 26 DOM
-
2026-06-02days on market $259,000 Active 25 DOM
-
2026-06-01days on market $259,000 Active 24 DOM
-
2026-05-31days on market $259,000 Active 23 DOM
-
2026-05-14price $259,000
-
2026-05-07$268,000 Active
-
2025-07-22soldstatus $85,000
-
2025-07-11soldstatus $85,000 Closed 262-char remark
Show marketing remark (262 chars)
Great investment opportunity. Already has tenant producing rental income. Put your finishing touches and increase those numbers. Loads of potential in this 5 bedroom 2 bath home. Tons of space & possibilities. Could be used as first floor bedrooms as well.
-
2025-06-28status Pending 262-char remark
Show marketing remark (262 chars)
Great investment opportunity. Already has tenant producing rental income. Put your finishing touches and increase those numbers. Loads of potential in this 5 bedroom 2 bath home. Tons of space & possibilities. Could be used as first floor bedrooms as well.
-
2025-06-02price $94,000
-
2025-05-17$100,000 Active
Show marketing remark (262 chars)
Great investment opportunity. Already has tenant producing rental income. Put your finishing touches and increase those numbers. Loads of potential in this 5 bedroom 2 bath home. Tons of space & possibilities. Could be used as first floor bedrooms as well.
-
2025-05-17$100,000 Active 262-char remark
Show marketing remark (262 chars)
Great investment opportunity. Already has tenant producing rental income. Put your finishing touches and increase those numbers. Loads of potential in this 5 bedroom 2 bath home. Tons of space & possibilities. Could be used as first floor bedrooms as well.
-
2025-01-22soldstatus $66,300
-
2025-01-16soldstatus $66,330 Sold
-
2024-11-01historical Contingency Pending
-
2024-10-04$27,000 Active
-
2024-08-20historical
-
2024-08-06status Active
-
2024-07-01historical Contingency Pending
-
2024-06-25price $110,000
-
2024-06-14$150,000 Active
-
2019-04-17soldstatus $12,000 Sold
-
2019-04-05historical Accept Backup Offers
-
2019-04-01price $20,000
-
2019-03-18price $23,000
-
2019-02-15price $30,000
-
2019-02-03$33,000 Active
-
2013-10-31historical
-
2013-04-30$30,000
-
2010-11-29soldstatus $24,000
-
2010-10-07$26,000
-
2010-08-13historical
-
2010-04-13$52,900
-
2010-01-22historical
-
2009-07-20$39,900
-
2009-06-19soldstatus $6,000
-
2009-04-09$9,900
-
2009-04-09historical
-
2009-01-06$21,900
-
2007-09-10historical
ⓘ Source: listings_history table (triggers on properties + properties_extension) + one-shot
backfill from property_details.listing_events for pre-trigger history.
Tax reassessment forecast OH · Partial reset (capped growth)
- Current annual tax
- $1,573 · $131/mo
- Projected year-2 tax
- $2,807 · $234/mo
- Expected delta
- +$1,234/yr (+$103/mo · 78.5%)
ⓘ Screening estimate from a state-policy table — verify with the county assessor before closing.
Climate risk First Street
- Flood 9/10 Extreme FEMA zone X (unshaded) · 99% chance over 30 yrs
- Wildfire 1/10 Low
- Heat 4/10 Moderate 7 d/yr ≥103°F today · 19 d/yr by 30 yrs out
- Wind 2/10 Low 100% chance of damaging wind over 30 yrs
- Air quality 3/10 Moderate 3 unhealthy d/yr today · 5 by 30 yrs out
Nearby sold comps map
Loading sold comps map…
Walkable amenities ~0.75 mi
Loading nearby amenities…
Taxation est. · year 1
- Rental income
- $22,957
- − Mortgage interest
- −$14,508
- − Property taxes
- −$1,573
- − Insurance
- −$1,962
- − Repairs & maintenance
- −$1,837
- − Management
- −$1,837
- − Depreciation
- −$7,535
- Taxable loss
- −$6,293
- Est. tax savings @ 24.0%
- +$1,510
- After-tax cash flow
- $-187/yr
For passive investors: Depreciation is non-cash, so a rental often shows a tax loss while cash-flowing — sheltering income. Rental losses are passive: they offset passive income freely, and up to $25,000/yr can offset ordinary (W-2) income if you actively participate and your MAGI is under $100k (phasing out to $0 by $150k); unused losses carry forward. On sale, claimed depreciation is recaptured at up to 25%, and gains may owe capital-gains tax (a 1031 exchange can defer both). Figures are a year-1 estimate at your 24.0% rate — not tax advice; consult a CPA.
Schools (NCES district)
- District
- Cincinnati Public Schools
- NCES district ID
- 3904375
- Math proficiency
- 25% ▼ -19.00%
- Reading proficiency
- 36% ▼ -14.00%
- Median HH income
- $35,743
- Composite
- 25.21/100
- National rank
- #7508
- State rank
- #581 of 656 in OH
Livability — Cincinnati
- Score
- 80/100
- State rank
- #130
- US rank
- #1856
Category grades
Schools grade is shown separately in the Schools card above.
Census & demographics
- Census place
- Cincinnati, OH
- County
- Hamilton County · 701,295 people
- City population
- 505,555
- Metro
- Cincinnati, OH-KY-IN
- Population (ZIP)
- 9,583
- Household income
- $20,348
- Rent vs Own
- Severe rent burden
- 1466.0
Population outlook (Hamilton County) Hauer SSP2
- Today (2025)
- 826,054 people
- By 2030
- 830,947 · +0.6%
- By 2040
- 832,319 · +0.8%
- By 2050
- 822,428 · -0.4%
- By 2075
- 788,688 · -4.5%
- By 2100
- 710,674 · -14.0%
Race, ethnicity, and origin ACS 2023
- Neighborhood character
- Predominantly Black (72%)
- Race & ethnicity
- Black 72% White 17% Two or more races 7% Hispanic / Latino 5%
- Common ancestry
- Slovak 1% Romanian 1%
- Foreign-born
- 6% · Canada
- Languages at home
- 92% English-only · Spanish 2%
Political lean MEDSL · Hamilton
- 2024 margin
- D (+14.9) · D 57.0% · R 42.1%
- 2008→2024 swing
- +7.9pp toward D · 2008: 7.0pp · 2024: 14.9pp
- All cycles
- 2024: D+14.9 2020: D+15.9 2016: D+9.5 2012: D+4.9 2008: D+7.0
Not yet ingested
- Civics
- —
Market trends
- HPI YoY
- ▲ 10.21%
- Current HPI
- 232.7908
- Rent YoY
- —
- Metro
- Cincinnati, OH-KY-IN
- State GDP YoY
- ▲ 1.98%
- F500 in state
- 48
Industry mix (Fortune 500 HQ in OH)
| Industry | F500 HQs | Revenue |
|---|---|---|
| Insurance | 3 | $145B |
|
||
| Industrial Machinery | 3 | $49B |
|
||
| Financial Services | 3 | $24B |
|
||
| Consumer Goods | 2 | $93B |
|
||
| Aerospace / Defense | 2 | $47B |
|
||
| Utilities | 2 | $33B |
|
||
Price history
+2179.9% since first listed42 events — show timeline
- 2026-05-14 Price Changed $259,000 Cincy MLS
- 2026-05-07 Listed $268,000 Cincy MLS
- 2025-07-22 Sold (Public Records) $85,000 Public Records
- 2025-07-11 Sold (MLS) $85,000 Dayton MLS
- 2025-06-28 Pending — Dayton MLS
- 2025-06-02 Price Changed $94,000 Cincy MLS
- 2025-05-17 Listed $100,000 Dayton MLS
- 2025-05-17 Listed $100,000 Cincy MLS
- 2025-01-22 Sold (Public Records) $66,300 Public Records
- 2025-01-16 Sold (MLS) $66,330 Cincy MLS
- 2024-11-01 Contingent — Cincy MLS
- 2024-10-04 Listed $27,000 Cincy MLS
- 2024-08-20 Listing Removed — Cincy MLS
- 2024-08-06 Relisted — Cincy MLS
- 2024-07-01 Contingent — Cincy MLS
- 2024-06-25 Price Changed $110,000 Cincy MLS
- 2024-06-14 Listed $150,000 Cincy MLS
- 2019-04-17 Sold (MLS) $12,000 Cincy MLS
- 2019-04-05 Contingent — Cincy MLS
- 2019-04-01 Price Changed $20,000 Cincy MLS
- 2019-03-18 Price Changed $23,000 Cincy MLS
- 2019-02-15 Price Changed $30,000 Cincy MLS
- 2019-02-03 Listed $33,000 Cincy MLS
- 2013-10-31 Listing Removed — Cincy MLS
- 2013-04-30 Listed $30,000 Cincy MLS
- 2010-11-29 Sold (MLS) $24,000 Cincy MLS
- 2010-10-07 Listed $26,000 Cincy MLS
- 2010-08-13 Listing Removed — Cincy MLS
- 2010-04-13 Listed $52,900 Cincy MLS
- 2010-01-22 Listing Removed — Cincy MLS
- 2009-07-20 Listed $39,900 Cincy MLS
- 2009-06-19 Sold (MLS) $6,000 Cincy MLS
- 2009-04-09 Listing Removed — Cincy MLS
- 2009-04-09 Listed $9,900 Cincy MLS
- 2009-01-06 Listed $21,900 Cincy MLS
- 2007-09-10 Listing Removed — Cincy MLS
- 2007-05-13 Listed $75,000 Cincy MLS
- 2005-01-11 Sold (MLS) $15,000 Cincy MLS
- 2004-11-16 Listed $19,900 Cincy MLS
- 2002-11-15 Sold (Public Records) $78,000 Public Records
- 1994-05-26 Sold (Public Records) $62,000 Public Records
- 1991-03-13 Sold (Public Records) $11,360 Public Records
Property tax history
+10.4%/yrLatest (2025): $1,573 · +0.1% YoY. Source: county tax records.
Cash-flow waterfall
monthlySold comps — $/sqft
last 12 mo · ≤1 miLoading sold comps…