 🌊 Lakefront
27631 W Lake Shore Dr · Fox Lake, IL
Flood risk 1/10 · Minimal
- FEMA flood zone
- X (unshaded)
- Chance of flooding over 30 yrs
- 0.0%
- Est. flood insurance / yr
- $473 – $860
Fire risk 1/10 · Minimal
- Est. fire insurance / yr
- $804 – $1,492
Heat risk 2/10 · Minimal
- Hot days now (above 101°F)
- 7 days/yr
- Hot days in 30 yrs
- 14 days/yr
Wind risk 2/10 · Minimal
- Chance of severe wind over 30 yrs
- 0.0%
Air-quality risk 2/10 · Minimal
- Unhealthy air days now
- 1 days/yr
- Unhealthy air days in 30 yrs
- 1 days/yr
Risk factors via First Street. Map © Google.
Why this score? — see what drove the C- grade
The composite is a weighted blend of 9 inputs, each scored 0–100. Each bar is that input's sub-score; the figure is the points it added to the 100-point composite (weight × sub-score).
- Cash flow +24.8/30.0
- DSCR +8.0/10.0
- 1% rule +6.8/10.0
- Livability +3.7/5.0
- Rent growth +2.5/5.0
- Condition / age +2.5/5.0
- Schools +2.3/10.0
- ARV discount +0.0/15.0
- Appreciation +0.0/10.0
$529,000
🖨 Deal sheet (PDF) 📄 Offer letter ✓ Due diligence
Listing remarks
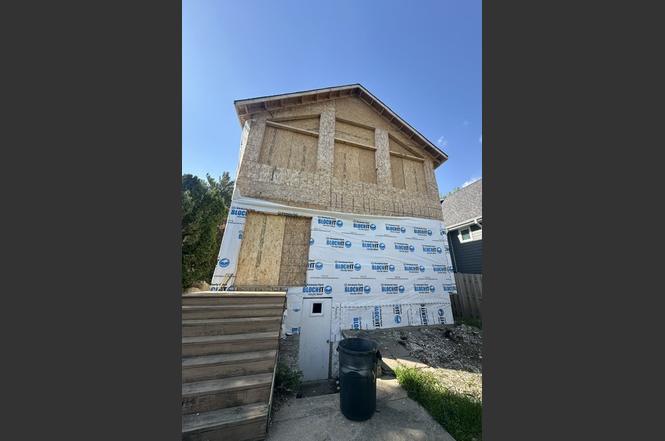
* * * ATTENTION BUILDERS AND REMODELERS! * * * READY TO COMPLETE A LAKEFRONT HOME ON CHAIN O'LAKES!!! PLANS AND PERMIT NEED TO BE TRANSFERRED TO THE NEW OWNER. Possible 4 bed/3 bath , open floor plan, height ceilings. The pier is included. Enjoy panoramic lake views from every room of the house. A large deck by the pier built in 2025. Free (for residents) boat launch is just around the corner. Chain O'Lakes is right outside your door. Wonderful location, amazing sunsets, eagles & wildlife. Enjoy swimming, boating, kayaking, fishing, and all of the attractions, restaurants, and bars that the Chain O'Lakes has to offer. Plat of Survey is attached. * * * BUILDING IS BEING SOLD &q
Key facts
- Large deck
- Open floor plan
- Boat launch
Tags
Property features AI
Finance
- Other: Property is in an unincorporated area (Antioch township); Directions provided for access
- HOA & community: No master association fee required
Exterior
- Parking: Detached garage (owned) with 2 garage spaces and 2 total parking spaces
- Utilities: Well water; Septic sewer
- Home design: Detached single-family home; Two-story layout; Fee simple ownership; School bus service available
- Construction: Built before 1978; Other construction materials listed
- Exterior features: Waterfront property
Interior
- Kitchen: Kitchen on the main level
- Bedrooms: 4 bedrooms (including master and three additional bedrooms); Master bedroom located on the second floor; Additional bedrooms located on the main and second floors
- Interior features: 7 total rooms; Full unfinished basement with walk-out access
- Laundry & utility: Dedicated laundry room
Neighborhood map
What this means for you Summary
Snapshot
- This is a 4-bed/1.0-bath single-family listed at $529k.
Deal economics
- At list price, monthly cash flow is $1k ($13k/yr) — positive.
- The deal already cash-flows at list — no discount required.
- Meets the 1% rule at list price ($6k rent vs $529k).
- Cap rate 8.8% vs local median 6.0% in Fox Lake — top-decile yield for the area; either an underpriced asset or a hidden risk that comps aren't pricing in. Stress-test before assuming the spread holds.
Location & tenants
- Location reads 74/100 on livability (#247 in IL, #4,462 nationally) — a middle-class / working-renter tenant base. Strengths: cost of living A+, housing A+, commute A; Watch: amenities D+, health & safety F.
- Grant Chsd 124 (suburban): math 23% / reading 27% proficiency, ranked #296 of 620 in IL (top 48%) — low school quality limits family demand, transient renter base, plan for 1-2y turnover.
- Zoned schools: Grant Community High School (math 23% / reading 27%, grade F, #247 of 693 statewide, top 36%, 1,837 students, 0% FRL).
- Market conditions: 95 active listings in the ZIP; 2 comparable units currently listed for rent nearby; 948 units permitted in Lake County in 2024 (424 in 5+ unit buildings).
Forward outlook
- Local home prices are declining (-3.0%/yr); year-one equity from $4k of loan paydown is wiped out by about $16k of value loss. Plan a longer hold.
- Lake County population projected to shrink 8% by 2050 — rents likely to lag national; underwrite the cash flow, not the appreciation.
Negotiation context
- Only 4 days on market — expect competitive offers; lowballing is unlikely to land.
- Current owner paid $405k; 31% above their basis — modest negotiation headroom, anchor on the comps not their cost.
Risks & watch-outs
- Watch-outs: built in 1950 — expect roof / HVAC / electrical / plumbing capex.
Questions for the listing agent
- Built in 1950 — when were the roof, HVAC, electrical panel, plumbing, and water heater last replaced?
- Is there a deadline driving the sale (1031 exchange, divorce, estate, relocation)? That informs how much negotiation room exists.
- Schools are F-rated, which usually means shorter tenancies and higher turnover. Who's the typical renter profile here, and what's been the actual vacancy rate?
- This sits on a lake — are riparian / water-frontage rights deeded with the parcel? Any dock permits, shoreline easements, or HOA water-use restrictions?
- What's the documented flood / surge / shoreline-erosion history here (FEMA AND non-FEMA — e.g., storm surge, creek backup, septic-field saturation)?
- Any water-quality or seasonal algae-bloom issues that affect tenant satisfaction or short-term-rental demand?
- What's the average days-on-market for RENTAL listings here right now (not sales)? A rising rental-DOM trend means longer vacancies and softer asking-rent achievability than the comps imply.
- What's the recent tenant-quality profile in this submarket — average credit score on applications, eviction rate, late-payment / NSF rate, and stable-employment percentage? A property-management company in the area should have these aggregated.
- How much new for-sale + rental construction is in the pipeline within 1–3 miles? Heavy new supply typically softens prices + rents 12–24 months out; constrained supply supports both.
Investment metrics
- 1% rule
- 1.18% ✓
- Cap rate
- 8.84%
- Cash-on-cash
- 9.09%
- DSCR
- 1.40
- GRM
- 7.1
CMA / ARV
- ARV (on-the-fly)
- $365,874
- Comps found
- 7
Show comp detail 7 sales within ~0.75 mi
| Address | Dist | Beds/Ba | Sqft | Sold | Price | $/sf | Match |
|---|---|---|---|---|---|---|---|
| 27673 W Lake Shore Dr | 0.05mi | 3/2.0 (-1) | 1,872 (+8%) | 12mo | $810,000 | $433 | 66 |
| 38433 N 5th Ave | 0.40mi | 4/2.5 | 1,848 (+7%) | 7mo | $202,000 | $109 | 59 |
| 38332 N 8th St | 0.51mi | 3/1.5 (-1) | 1,750 (+1%) | 22mo | $370,000 | $211 | 49 |
| 27753 W Lake Shore Dr | 0.14mi | 3/2.0 (-1) | 1,500 (-14%) | 15mo | $317,000 | $211 | 49 |
| 27884 W Lake Shore Dr | 0.27mi | 3/1.5 (-1) | 1,500 (-14%) | 13mo | $275,100 | $183 | 47 |
| 38480 N 3rd Ave N | 0.38mi | 3/2.5 (-1) | 1,617 (-7%) | 17mo | $309,000 | $191 | 46 |
| 27509 W Ashland Ave | 0.44mi | 3/2.0 (-1) | 1,540 (-11%) | 20mo | $365,000 | $237 | 35 |
Match score weights: distance 35% · size 25% · config 20% · recency 20%. Top-matched comps best support the ARV.
Projected returns pro-forma
-3.0% appreciation · 3.0% rent growth · sell at horizon
- IRR
- -2.5%
- Equity multiple
- 0.90×
- Total profit
- $-14,102
- Equity at exit
- $78,876
- IRR
- 7.2%
- Equity multiple
- 1.54×
- Total profit
- $80,465
- Equity at exit
- $45,738
Cash invested: $148,120 (down + closing). Projections, not guarantees.
Landlord ↔ Tenant lean methodology
- Overall (STATE)
- 43 Moderately Tenant-Leaning
- State Illinois
- 43 Moderately Tenant-Leaning · D+7
- County
- — inherits STATE
- City
- — inherits STATE
ZIP-level market 60081
- Home prices YoY
- -25.6%
- Active inventory
- 95
- Price-to-rent
- 7.1×
Monthly cashflow live
- Estimated rent
- $6,243 medium interval (Pro) →
- Mortgage (P&I)
- −$2,774
- Tax from tax record
- −$816 /mo · $9,789/yr
- Insurance
- −$220
- HOA
- −$0
- Vacancy / Maint / Mgmt
- −$1,311
- Net cashflow
- $1,122
Break-even live
Sensitivity live
| Price | -10% $1,421 | -5% $1,271 | +0% $1,122 | +5% $972 | +10% $822 |
|---|---|---|---|---|---|
| Rent | -10% $628 | -5% $875 | +0% $1,122 | +5% $1,368 | +10% $1,615 |
| Rate | -1.0pp $1,388 | -0.5pp $1,256 | base $1,122 | +0.5pp $984 | +1.0pp $845 |
UW: 25.0% down · 7.5% · 30yr · 1.5% tax · 5.0% vac · 8.0% maint · 8.0% mgmt
Financing live
Cash to close
- Down payment
- $132,250
- Closing costs
- $15,870
- Reserves months
- —
- Total cash needed
- —
Loan-product check · same deal, 3 products live
Conventional
25% down · 7.5% · 30yr
- Down + closing
- —
- Monthly P&I
- —
- Monthly cashflow
- —
- DSCR
- —
- Eligible?
- —
Personal DTI + credit; lowest rate.
DSCR
20% down · 8.5% · 30yr
- Down + closing
- —
- Monthly P&I
- —
- Monthly cashflow
- —
- DSCR
- —
- Eligible?
- —
No personal income docs; deal must DSCR.
Hard money
10% down · 12.0% · 12mo
- Down + closing
- —
- Monthly P&I
- —
- Monthly cashflow
- —
- DSCR
- —
- Eligible?
- —
Short-term bridge; refi at stabilization.
Rent comps 2 comps
| Address | Beds | Baths | Sqft | Rent | $/sqft | DOM | Units | Dist |
|---|---|---|---|---|---|---|---|---|
| 28 Glen Ave Fox Lake, IL | 3.0 | 1.0 | 1212 | $2,300 | $1.90 | 8d | 1 | 1.35mi |
| 28977 Westlane Ave Unit 1514521P Spring Grove, IL | 4.0 | 2.0 | 1991 | $9,576 | $4.81 | 23d | 1 | 1.42mi |
Listing history 3 events
-
2026-06-21days on market $529,000 Active 4 DOM
-
2026-06-17remarks 695-char remark
-
2026-06-17$529,000 Active 1 DOM
ⓘ Source: listings_history table (triggers on properties + properties_extension) + one-shot
backfill from property_details.listing_events for pre-trigger history.
Tax reassessment forecast IL · Partial reset (capped growth)
- Current annual tax
- $9,789 · $816/mo
- Projected year-2 tax
- $10,899 · $908/mo
- Expected delta
- +$1,109/yr (+$92/mo · 11.3%)
ⓘ Screening estimate from a state-policy table — verify with the county assessor before closing.
Climate risk First Street
- Flood 1/10 Low FEMA zone X (unshaded) · 0% chance over 30 yrs
- Wildfire 1/10 Low
- Heat 2/10 Low 7 d/yr ≥101°F today · 14 d/yr by 30 yrs out
- Wind 2/10 Low 0% chance of damaging wind over 30 yrs
- Air quality 2/10 Low 1 unhealthy d/yr today · 1 by 30 yrs out
Nearby sold comps map
Loading sold comps map…
Walkable amenities ~0.75 mi
Loading nearby amenities…
Taxation est. · year 1
- Rental income
- $74,914
- − Mortgage interest
- −$29,632
- − Property taxes
- −$9,789
- − Insurance
- −$2,645
- − Repairs & maintenance
- −$5,993
- − Management
- −$5,993
- − Depreciation
- −$15,389
- Taxable income
- $5,472
- Est. tax owed @ 24.0%
- −$1,313
- After-tax cash flow
- $12,145/yr
For passive investors: Depreciation is non-cash, so a rental often shows a tax loss while cash-flowing — sheltering income. Rental losses are passive: they offset passive income freely, and up to $25,000/yr can offset ordinary (W-2) income if you actively participate and your MAGI is under $100k (phasing out to $0 by $150k); unused losses carry forward. On sale, claimed depreciation is recaptured at up to 25%, and gains may owe capital-gains tax (a 1031 exchange can defer both). Figures are a year-1 estimate at your 24.0% rate — not tax advice; consult a CPA.
Schools (NCES district)
- District
- Grant Chsd 124
- NCES district ID
- 1717340
- Math proficiency
- 23% ▼ -9.00%
- Reading proficiency
- 27% ▼ -7.00%
- Median HH income
- $59,450
- Composite
- 22.95/100
- National rank
- #7989
- State rank
- #296 of 620 in IL
Livability — Fox Lake
- Score
- 74/100
- State rank
- #247
- US rank
- #4462
Category grades
Schools grade is shown separately in the Schools card above.
Census & demographics
- City population
- 10,846
- Population (ZIP)
- 9,117
Population outlook (Lake County) Hauer SSP2
- Today (2025)
- 700,217 people
- By 2030
- 693,290 · -1.0%
- By 2040
- 673,588 · -3.8%
- By 2050
- 643,556 · -8.1%
- By 2075
- 562,792 · -19.6%
- By 2100
- 457,715 · -34.6%
Race, ethnicity, and origin ACS 2023
- Neighborhood character
- Predominantly White (84%)
- Race & ethnicity
- White 84% Two or more races 10% Hispanic / Latino 8%
- Hispanic origin (detail)
- Mexican 5% Puerto Rican 3%
- Common ancestry
- Romanian 13% Portuguese 3% Lithuanian 2%
- Foreign-born
- 4% · Canada
- Languages at home
- 97% English-only · Spanish 2%
Political lean MEDSL · Lake
- 2024 margin
- Strong D (+20.8) · D 59.7% · R 38.9% · Other 1.4%
- 2008→2024 swing
- +1.1pp toward D · 2008: 19.6pp · 2024: 20.8pp
- All cycles
- 2024: D+20.8 2020: D+24.1 2016: D+20.3 2012: D+8.1 2008: D+19.6
Not yet ingested
- Civics
- —
Market trends
- HPI YoY
- ▼ -82.40%
- Current HPI
- 239.9614
- Rent YoY
- —
- Metro
- —
- State GDP YoY
- ▲ 1.59%
- F500 in state
- 60
Industry mix (Fortune 500 HQ in IL)
| Industry | F500 HQs | Revenue |
|---|---|---|
| Insurance | 4 | $201B |
|
||
| Consumer Goods | 4 | $87B |
|
||
| Industrial Machinery | 3 | $64B |
|
||
| Healthcare | 2 | $55B |
|
||
| Retail / Pharmacy | 1 | $148B |
|
||
| Agriculture / Food | 1 | $86B |
|
||
Price history
+655.7% since first listed3 events — show timeline
- 2026-06-17 Listed $529,000 MRED as Distributed by MLS Grid
- 2023-01-06 Sold (Public Records) $405,000 Public Records
- 1986-03-01 Sold (Public Records) $70,000 Public Records
Property tax history
+8.2%/yrLatest (2024): $9,789 · +7.0% YoY. Source: county tax records.
Cash-flow waterfall
monthlySold comps — $/sqft
last 12 mo · ≤1 miLoading sold comps…