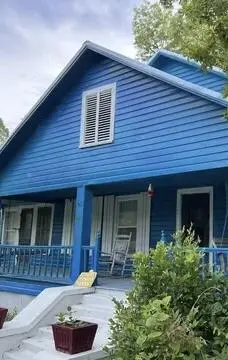
824 Screven St · Sardis, GA
Flood risk 1/10 · Minimal
- FEMA flood zone
- X (unshaded)
- Chance of flooding over 30 yrs
- 0.0%
- Est. flood insurance / yr
- $507 – $1,088
Fire risk 4/10 · Minor
- Est. fire insurance / yr
- $963 – $1,789
Heat risk 8/10 · Major
- Hot days now (above 109°F)
- 7 days/yr
- Hot days in 30 yrs
- 17 days/yr
Wind risk 8/10 · Major
- Chance of severe wind over 30 yrs
- 80.0%
Air-quality risk 2/10 · Minimal
- Unhealthy air days now
- 2 days/yr
- Unhealthy air days in 30 yrs
- 2 days/yr
Risk factors via First Street. Map © Google.
Why this score? — see what drove the B grade
The composite is a weighted blend of 9 inputs, each scored 0–100. Each bar is that input's sub-score; the figure is the points it added to the 100-point composite (weight × sub-score).
- Cash flow +25.3/30.0
- ARV discount +15.0/15.0
- Appreciation +8.9/10.0
- DSCR +8.4/10.0
- 1% rule +5.6/10.0
- Livability +2.8/5.0
- Rent growth +2.5/5.0
- Condition / age +2.5/5.0
- Schools +1.5/10.0
$112,000
🖨 Deal sheet (PDF) 📄 Offer letter ✓ Due diligence
Listing remarks
This property has great potential to be your forever home or an investment property. With a little TLC, you can prepare to have Coffee in the morning on your oversized, rocking chair covered front porch. This 3 bedroom, 2 bath home is located in the heart of Sardis, GA. It features high ceilings, a fireplace in the living room, a nice open kitchen, ample dining room space. There is a screened in back porch, and vibrant sunroom off one of the bedrooms. This home has rear parking along with curbside parking and front access to the home through a chain-link fence entry. Additional detached carport located in the rear within fenced in yard. 24 hour notice required for showing
Key facts
- Rear parking
- Detached carport
- Curbside parking
Tags
Property features AI
Exterior
- Parking: Detached carport (1 space)
- Utilities: Public water; Public sewer
- Home design: Single-family residence; Residential property
- Construction: Aluminum siding; Pillar/post/pier foundation; Home warranty included
- Exterior features: Covered, screened rear porch with deck; Fenced yard; Metal roof
Interior
- Kitchen: Includes other appliances
- Bedrooms: 6 total rooms (bedroom count not specified)
- Flooring: Hardwood; Other
- Bathrooms: 2 full bathrooms
- Heating & cooling: Central air conditioning; Attic fan; Forced air heating; Electric heating; Fireplace(s)
- Interior features: Hardwood floors; Other flooring; Other appliances; Crawl space / no basement
- Laundry & utility: Washer hookup
Neighborhood map
What this means for you Summary
Snapshot
- This is a 3-bed/2.0-bath single-family listed at $112k.
Deal economics
- At list price, monthly cash flow is $255 ($3k/yr) — positive.
- The deal already cash-flows at list — no discount required.
- Meets the 1% rule at list price ($1k rent vs $112k).
- Recommended offer: $109k (3.0% below list) — sets the bar for market timing.
Location & tenants
- Location reads 55/100 on livability (#510 in GA) — a working-class tenant base; expect higher turnover. Strengths: cost of living A+, housing A+; Watch: crime F, amenities F, commute F.
- Burke County (town): math 16% / reading 21% proficiency, ranked #148 of 174 in GA (top 85%) — low school quality limits family demand, transient renter base, plan for 1-2y turnover; 72% free/reduced lunch — lower-income household profile, screen leases tightly.
- Zoned schools: Burke County Middle School (math 15% / reading 26%, grade F, #345 of 470 statewide, top 74%, 882 students, 100% FRL); Burke County High School (math 4% / reading 17%, grade F, #348 of 424 statewide, top 83%, 1,170 students, 100% FRL) — zoned schools average 100% FRL vs 72% district-wide (28 pts higher); higher-poverty schools than district average — tighter screening recommended.
- Market conditions: 14 active listings in the ZIP; 65 units permitted in Burke County in 2024 (0 in 5+ unit buildings).
Forward outlook
- In year one you build about $10k of equity ($774 loan paydown + $9k appreciation (7.8% local appreciation)).
- Burke County population projected at -24% by 2050 — secular population decline; favor cash flow + early exit over multi-decade hold.
- At projected returns (7.8% appreciation + 3.0% rent growth), your $31k cash investment doubles in ~3 years — after that, you're playing with house money.
- By year 4, paydown + projected appreciation supports a ~$33k cash-out refi (75% LTV) — recoverable capital for the next deal without selling this one.
Negotiation context
- It's been on market 38 days — a 3% lower offer ($109k) is reasonable based on typical stale-listing flexibility.
- 6 sale attempts since 4y ago with the ask held roughly flat each time — persistent listings suggest the price (not the market) is what's stuck; bring a comps-based counter.
Risks & watch-outs
- Watch-outs: built in 1920 — expect roof / HVAC / electrical / plumbing capex.
- Climate carrying-cost: severe wind risk, 80% chance of damaging wind over 30y; extreme-heat days projected 7→17/yr by 2055 (HVAC capex compounding) — expect insurance premiums to compound above CPI over the hold.
Questions for the listing agent
- It's been on market 38 days. Have you received any prior offers? Is the seller open to a 3% concession, seller financing, or rate buy-down credit?
- Built in 1920 — when were the roof, HVAC, electrical panel, plumbing, and water heater last replaced?
- Is there a deadline driving the sale (1031 exchange, divorce, estate, relocation)? That informs how much negotiation room exists.
- Schools are F-rated, which usually means shorter tenancies and higher turnover. Who's the typical renter profile here, and what's been the actual vacancy rate?
- Crime grade is F in this area — have there been break-ins, vandalism, or insurance claims at this property in the last 3 years? What carrier currently insures it and at what premium?
- What's the average days-on-market for RENTAL listings here right now (not sales)? A rising rental-DOM trend means longer vacancies and softer asking-rent achievability than the comps imply.
- What's the recent tenant-quality profile in this submarket — average credit score on applications, eviction rate, late-payment / NSF rate, and stable-employment percentage? A property-management company in the area should have these aggregated.
- How much new for-sale + rental construction is in the pipeline within 1–3 miles? Heavy new supply typically softens prices + rents 12–24 months out; constrained supply supports both.
Investment metrics
- 1% rule
- 1.06% ✓
- Cap rate
- 9.03%
- Cash-on-cash
- 9.78%
- DSCR
- 1.44
- GRM
- 7.8
CMA / ARV
- ARV (median comp)
- $155,691
- List price
- $112,000
- Delta
- -28.06%
- Verdict
- UNDERPRICED
- Comps
- 13 within 1.0 mi
Projected returns pro-forma
7.82% appreciation · 3.0% rent growth · sell at horizon
- IRR
- 27.2%
- Equity multiple
- 2.95×
- Total profit
- $61,066
- Equity at exit
- $83,697
- IRR
- 24.5%
- Equity multiple
- 6.26×
- Total profit
- $164,978
- Equity at exit
- $164,828
Cash invested: $31,360 (down + closing). Projections, not guarantees.
Landlord ↔ Tenant lean methodology
- Overall (STATE)
- 90 Strongly Landlord-Friendly
- State Georgia
- 90 Strongly Landlord-Friendly · R+3
- County
- — inherits STATE
- City
- — inherits STATE
ZIP-level market 30456
- Home prices YoY
- 4.2%
- Active inventory
- 14
- Price-to-rent
- 7.8×
Monthly cashflow live
- Estimated rent
- $1,192 medium interval (Pro) →
- Mortgage (P&I)
- −$587
- Tax from tax record
- −$52 /mo · $627/yr
- Insurance
- −$47
- HOA
- −$0
- Vacancy / Maint / Mgmt
- −$250
- Net cashflow
- $255
Break-even live
Sensitivity live
| Price | -10% $319 | -5% $287 | +0% $255 | +5% $224 | +10% $192 |
|---|---|---|---|---|---|
| Rent | -10% $161 | -5% $208 | +0% $255 | +5% $303 | +10% $350 |
| Rate | -1.0pp $312 | -0.5pp $284 | base $255 | +0.5pp $226 | +1.0pp $197 |
UW: 25.0% down · 7.5% · 30yr · 1.5% tax · 5.0% vac · 8.0% maint · 8.0% mgmt
Financing live
Cash to close
- Down payment
- $28,000
- Closing costs
- $3,360
- Reserves months
- —
- Total cash needed
- —
Loan-product check · same deal, 3 products live
Conventional
25% down · 7.5% · 30yr
- Down + closing
- —
- Monthly P&I
- —
- Monthly cashflow
- —
- DSCR
- —
- Eligible?
- —
Personal DTI + credit; lowest rate.
DSCR
20% down · 8.5% · 30yr
- Down + closing
- —
- Monthly P&I
- —
- Monthly cashflow
- —
- DSCR
- —
- Eligible?
- —
No personal income docs; deal must DSCR.
Hard money
10% down · 12.0% · 12mo
- Down + closing
- —
- Monthly P&I
- —
- Monthly cashflow
- —
- DSCR
- —
- Eligible?
- —
Short-term bridge; refi at stabilization.
Listing history 29 events
-
2026-06-18days on market $112,000 Active 38 DOM
-
2026-06-17days on market $112,000 Active 37 DOM
-
2026-06-16days on market $112,000 Active 36 DOM
-
2026-06-15days on market $112,000 Active 35 DOM
-
2026-06-14days on market $112,000 Active 33 DOM
-
2026-06-13days on market $112,000 Active 32 DOM
-
2026-06-10days on market $112,000 Active 30 DOM
-
2026-06-09days on market $112,000 Active 29 DOM
-
2026-06-08days on market $112,000 Active 28 DOM
-
2026-06-07days on market $112,000 Active 27 DOM
-
2026-06-05days on market $112,000 Active 24 DOM
-
2026-06-03days on market $112,000 Active 23 DOM
-
2026-06-02days on market $112,000 Active 22 DOM
-
2026-06-01days on market $112,000 Active 21 DOM
-
2026-05-31days on market $112,000 Active 20 DOM
-
2026-05-30days on market $112,000 Active 19 DOM
-
2026-05-11historical
-
2026-02-16$112,000 Active
-
2026-02-16$112,000 Active 680-char remark
-
2025-06-04historical
-
2025-01-01status Price Change
-
2025-01-01price $105,000
-
2024-12-31historical
-
2024-07-12$118,000 New
-
2022-10-14soldstatus $97,500
-
2022-10-14soldstatus $97,500
-
2022-07-19$97,500
-
2022-07-19$97,500
-
1998-05-28soldstatus $35,000
ⓘ Source: listings_history table (triggers on properties + properties_extension) + one-shot
backfill from property_details.listing_events for pre-trigger history.
Tax reassessment forecast GA · Resets to sale price
- Current annual tax
- $627 · $52/mo
- Projected year-2 tax
- $1,030 · $86/mo
- Expected delta
- +$404/yr (+$34/mo · 64.4%)
ⓘ Screening estimate from a state-policy table — verify with the county assessor before closing.
Climate risk First Street
- Flood 1/10 Low FEMA zone X (unshaded) · 0% chance over 30 yrs
- Wildfire 4/10 Moderate
- Heat 8/10 Severe 7 d/yr ≥109°F today · 17 d/yr by 30 yrs out
- Wind 8/10 Severe 80% chance of damaging wind over 30 yrs
- Air quality 2/10 Low 2 unhealthy d/yr today · 2 by 30 yrs out
Nearby sold comps map
Loading sold comps map…
Walkable amenities ~0.75 mi
Loading nearby amenities…
Taxation est. · year 1
- Rental income
- $14,305
- − Mortgage interest
- −$6,274
- − Property taxes
- −$627
- − Insurance
- −$560
- − Repairs & maintenance
- −$1,144
- − Management
- −$1,144
- − Depreciation
- −$3,258
- Taxable income
- $1,297
- Est. tax owed @ 24.0%
- −$311
- After-tax cash flow
- $2,755/yr
For passive investors: Depreciation is non-cash, so a rental often shows a tax loss while cash-flowing — sheltering income. Rental losses are passive: they offset passive income freely, and up to $25,000/yr can offset ordinary (W-2) income if you actively participate and your MAGI is under $100k (phasing out to $0 by $150k); unused losses carry forward. On sale, claimed depreciation is recaptured at up to 25%, and gains may owe capital-gains tax (a 1031 exchange can defer both). Figures are a year-1 estimate at your 24.0% rate — not tax advice; consult a CPA.
Schools (NCES district)
- District
- Burke County
- NCES district ID
- 1300660
- Math proficiency
- 16% ▼ -12.00%
- Reading proficiency
- 21% ▼ -6.00%
- Median HH income
- $34,532
- Composite
- 15.18/100
- National rank
- #9343
- State rank
- #148 of 174 in GA
Livability — Sardis
- Score
- 55/100
- State rank
- #510
- US rank
- #23227
Category grades
Schools grade is shown separately in the Schools card above.
Census & demographics
- Census place
- Sardis, GA
- Population (ZIP)
- 1,851
Population outlook (Burke County) Hauer SSP2
- Today (2025)
- 21,186 people
- By 2030
- 20,207 · -4.6%
- By 2040
- 18,109 · -14.5%
- By 2050
- 16,102 · -24.0%
- By 2075
- 12,103 · -42.9%
- By 2100
- 9,671 · -54.4%
Race, ethnicity, and origin ACS 2023
- Neighborhood character
- Majority White (53%)
- Race & ethnicity
- White 53% Black 45% Hispanic / Latino 1% Two or more races 1%
- Common ancestry
- Lithuanian 6% Slovak 1%
- Languages at home
- 98% English-only · Spanish 2%
Political lean MEDSL · Burke
- 2024 margin
- Lean R (+9.3) · D 45.1% · R 54.4%
- 2008→2024 swing
- -18.6pp toward R · 2008: 9.2pp · 2024: -9.3pp
- All cycles
- 2024: R+9.3 2020: R+1.8 2016: D+2.6 2012: D+11.3 2008: D+9.2
Not yet ingested
- Civics
- —
Market trends
- HPI YoY
- ▲ 7.82%
- Current HPI
- 191.8851
- Rent YoY
- —
- Metro
- —
- State GDP YoY
- ▲ 2.66%
- F500 in state
- 28
Industry mix (Fortune 500 HQ in GA)
| Industry | F500 HQs | Revenue |
|---|---|---|
| Paper / Packaging | 2 | $29B |
|
||
| Retail | 1 | $160B |
|
||
| Transportation / Logistics | 1 | $91B |
|
||
| Airlines | 1 | $62B |
|
||
| Consumer Goods | 1 | $47B |
|
||
| Utilities | 1 | $25B |
|
||
Price history
+220.0% since first listed13 events — show timeline
- 2026-05-11 Listing Removed — Hive MLS
- 2026-02-16 Listed $112,000 Hive MLS
- 2026-02-16 Listed $112,000 Hive MLS
- 2025-06-04 Listing Removed — GAMLS
- 2025-01-01 Relisted — GAMLS
- 2025-01-01 Price Changed $105,000 GAMLS
- 2024-12-31 Listing Removed — GAMLS
- 2024-07-12 Listed $118,000 GAMLS
- 2022-10-14 Sold (MLS) $97,500 Hive MLS
- 2022-10-14 Sold (MLS) $97,500 Hive MLS
- 2022-07-19 Listed $97,500 Hive MLS
- 2022-07-19 Listed $97,500 Hive MLS
- 1998-05-28 Sold (Public Records) $35,000 Public Records
Property tax history
+11.1%/yrLatest (2025): $627 · -7.2% YoY. Source: county tax records.
Cash-flow waterfall
monthlySold comps — $/sqft
last 12 mo · ≤1 miLoading sold comps…