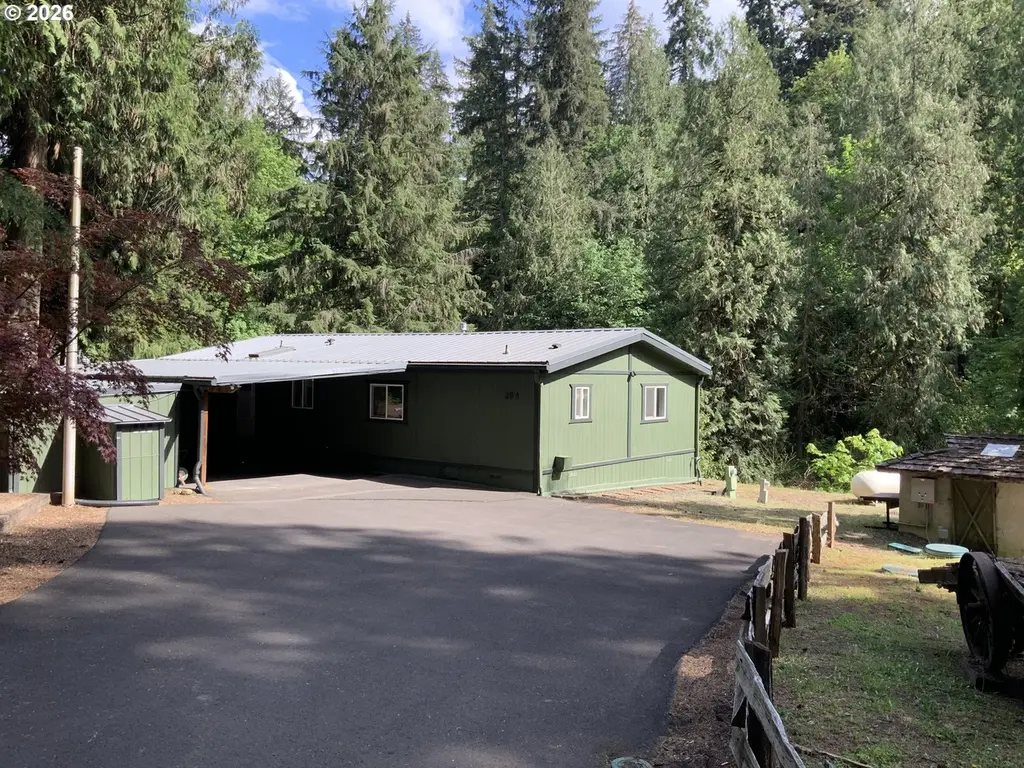
32700 SE Leewood Ln Unit 29A · Boring, OR
Flood risk 1/10 · Minimal
- FEMA flood zone
- X (unshaded)
- Chance of flooding over 30 yrs
- 0.0%
- Est. flood insurance / yr
- $507 – $1,088
Fire risk 5/10 · Moderate
- Est. fire insurance / yr
- $498 – $926
Heat risk 2/10 · Minimal
- Hot days now (above 90°F)
- 7 days/yr
- Hot days in 30 yrs
- 15 days/yr
Wind risk 1/10 · Minimal
- Chance of severe wind over 30 yrs
- —
Air-quality risk 9/10 · Severe
- Unhealthy air days now
- 11 days/yr
- Unhealthy air days in 30 yrs
- 12 days/yr
Risk factors via First Street. Map © Google.
Why this score? — see what drove the C grade
The composite is a weighted blend of 9 inputs, each scored 0–100. Each bar is that input's sub-score; the figure is the points it added to the 100-point composite (weight × sub-score).
- Cash flow +23.0/30.0
- 1% rule +10.0/10.0
- DSCR +7.4/10.0
- Schools +5.0/10.0
- ARV discount +3.7/15.0
- Rent growth +2.5/5.0
- Livability +2.5/5.0
- Condition / age +2.5/5.0
- Appreciation +0.0/10.0
$139,000
🖨 Deal sheet (PDF) 📄 Offer letter ✓ Due diligence
Listing remarks
Peaceful living in Big Valley Woods Parks. Enjoy nature with its beautiful ponds, extensive hiking trails, dog parks and much more. This 3 bedroom, 2 bath home features a carport and extra storage. Freshly painted inside and out. New flooring. Situated on a large lot with an ideal location overlooking deep creek. Space rent $1,295/Month includes water, sewer and garbage.
Key facts
- Extra storage
- Large lot
- Built 1984
Tags
Property features AI
Finance
- Other: Property is resale; Manufacturer: FUQUA HOMES INC; Ownership building area reported
- Financial info: Land lease (monthly lot rent) with expiration August 31, 2027
- HOA & community: Park amenities include basketball court, commons, party room, recreation facilities; Community management, road maintenance, trash, water and sewer provided; Located in Big Valley Woods park (not a senior community)
Exterior
- Parking: Carport; Driveway
- Utilities: Community water; Community sewer and septic tank; Electricity and propane fuel available
- Home design: Manufactured home in a park; Residential property (not attached); Great room, family room, living room and dining room; Entry all on main level
- Construction: Built in 1984; Metal roof; Block foundation with skirting
- Exterior features: Covered patio; Deck; Tool shed; Workshop; Trees on the lot; Creek frontage / creek on the property; Views of creek/stream and trees/woods; Paved road access; T-111 and wood siding
Interior
- Kitchen: Free-standing range
- Bedrooms: Primary bedroom on main level; Second bedroom on main level; Third bedroom on main level
- Bathrooms: Two full bathrooms (both on the main level)
- Heating & cooling: Heat pump for heating and cooling
- Interior features: One-level accessibility; Propane fireplace; Vinyl window frames
- Laundry & utility: Electric water heater
Neighborhood map
What this means for you Summary
Snapshot
- This is a 3-bed/2.0-bath condo listed at $139k.
Deal economics
- At list price, monthly cash flow is $248 ($3k/yr) — positive.
- The deal already cash-flows at list — no discount required.
- Meets the 1% rule at list price ($3k rent vs $139k).
- Recommended offer: $135k (3.0% below list) — sets the bar for market timing.
Location & tenants
- Location reads: area grade C — affects rentability + tenant quality, not the cash-flow math above.
- Oregon Trail SD 46 (town): math 47% / reading 64% proficiency, ranked #12 of 183 in OR (top 7%) — acceptable for families but not a draw, mixed tenant base, ~2y average lease.
- Zoned schools: Naas Elementary School (345 students, 47% FRL); Boring Middle School (405 students, 34% FRL); Sandy High School (1,440 students, 32% FRL) — zoned schools at 38% FRL track the district average.
- Market conditions: 38 active listings in the ZIP; 946 units permitted in Clackamas County in 2024 (188 in 5+ unit buildings).
Forward outlook
- Local home prices are declining (-3.0%/yr); year-one equity from $961 of loan paydown is wiped out by about $4k of value loss. Plan a longer hold.
- Clackamas County population projected at +25% by 2050 — long-run rental-demand tailwind backs the buy-and-hold thesis.
Negotiation context
- It's been on market 36 days — a 3% lower offer ($135k) is reasonable based on typical stale-listing flexibility.
Risks & watch-outs
- Watch-outs: HOA is 43% of rent.
- Climate carrying-cost: moderate wildfire risk — expect insurance premiums to compound above CPI over the hold.
Questions for the listing agent
- It's been on market 36 days. Have you received any prior offers? Is the seller open to a 3% concession, seller financing, or rate buy-down credit?
- What does the HOA fee cover, when was the last increase, and are there any pending special assessments or reserve-fund shortfalls?
- Any open or pending special assessments — roof, HVAC, plumbing, elevator, façade? What's the per-unit balance and payoff schedule, and is the seller paying it off at close or rolling it to the buyer?
- Is there a deadline driving the sale (1031 exchange, divorce, estate, relocation)? That informs how much negotiation room exists.
- What's the average days-on-market for RENTAL listings here right now (not sales)? A rising rental-DOM trend means longer vacancies and softer asking-rent achievability than the comps imply.
- What's the recent tenant-quality profile in this submarket — average credit score on applications, eviction rate, late-payment / NSF rate, and stable-employment percentage? A property-management company in the area should have these aggregated.
- How much new apartment / multifamily construction is in the pipeline within 1–3 miles? Heavy new supply (>2% of stock underway) typically softens rents 12–24 months out; light construction supports rent growth.
Investment metrics
- 1% rule
- 2.17% ✓
- Cap rate
- 8.43%
- Cash-on-cash
- 7.63%
- DSCR
- 1.34
- GRM
- 3.8
CMA / ARV
- ARV (median comp)
- $128,247
- List price
- $139,000
- Delta
- 8.39%
- Verdict
- FAIR
- Comps
- 10 within 1.0 mi
Projected returns pro-forma
-3.0% appreciation · 3.0% rent growth · sell at horizon
- IRR
- -4.1%
- Equity multiple
- 0.85×
- Total profit
- $-5,992
- Equity at exit
- $20,725
- IRR
- 6.1%
- Equity multiple
- 1.47×
- Total profit
- $18,200
- Equity at exit
- $12,018
Cash invested: $38,920 (down + closing). Projections, not guarantees.
Landlord ↔ Tenant lean methodology
- Overall (STATE)
- 28 Tenant-Leaning
- State Oregon
- 28 Tenant-Leaning · D+6
- County
- — inherits STATE
- City
- — inherits STATE
ZIP-level market 97009
- Active inventory
- 38
- Price-to-rent
- 3.8×
Monthly cashflow live
- Estimated rent
- $3,016 medium interval (Pro) →
- Mortgage (P&I)
- −$729
- Tax from tax record
- −$64 /mo · $763/yr
- Insurance
- −$58
- HOA est. from 5 same-building comps
- −$1,285
- Vacancy / Maint / Mgmt
- −$633
- Net cashflow
- $248
Break-even live
Sensitivity live
| Price | -10% $326 | -5% $287 | +0% $248 | +5% $208 | +10% $169 |
|---|---|---|---|---|---|
| Rent | -10% $9 | -5% $128 | +0% $248 | +5% $367 | +10% $486 |
| Rate | -1.0pp $318 | -0.5pp $283 | base $248 | +0.5pp $211 | +1.0pp $175 |
UW: 25.0% down · 7.5% · 30yr · 1.5% tax · 5.0% vac · 8.0% maint · 8.0% mgmt
Financing live
Cash to close
- Down payment
- $34,750
- Closing costs
- $4,170
- Reserves months
- —
- Total cash needed
- —
Loan-product check · same deal, 3 products live
Conventional
25% down · 7.5% · 30yr
- Down + closing
- —
- Monthly P&I
- —
- Monthly cashflow
- —
- DSCR
- —
- Eligible?
- —
Personal DTI + credit; lowest rate.
DSCR
20% down · 8.5% · 30yr
- Down + closing
- —
- Monthly P&I
- —
- Monthly cashflow
- —
- DSCR
- —
- Eligible?
- —
No personal income docs; deal must DSCR.
Hard money
10% down · 12.0% · 12mo
- Down + closing
- —
- Monthly P&I
- —
- Monthly cashflow
- —
- DSCR
- —
- Eligible?
- —
Short-term bridge; refi at stabilization.
HOA detail condo
- Monthly dues
- $0 · $0/yr
- Likely covers
- watersewertrash
- Assessments
- None detected in remarks — confirm with the listing agent.
Listing history 14 events
-
2026-06-18days on market $139,000 Active 36 DOM
-
2026-06-17days on market $139,000 Active 35 DOM
-
2026-06-16days on market $139,000 Active 34 DOM
-
2026-06-15days on market $139,000 Active 33 DOM
-
2026-06-13days on market $139,000 Active 31 DOM
-
2026-06-13days on market $139,000 Active 30 DOM
-
2026-06-09days on market $139,000 Active 27 DOM
-
2026-06-08days on market $139,000 Active 26 DOM
-
2026-06-07days on market $139,000 Active 25 DOM
-
2026-06-03days on market $139,000 Active 21 DOM
-
2026-06-02days on market $139,000 Active 20 DOM
-
2026-06-01days on market $139,000 Active 19 DOM
-
2026-05-31days on market $139,000 Active 18 DOM
-
2026-05-13$139,000 Active 373-char remark
ⓘ Source: listings_history table (triggers on properties + properties_extension) + one-shot
backfill from property_details.listing_events for pre-trigger history.
Tax reassessment forecast OR · Resets to sale price
- Current annual tax
- $763 · $64/mo
- Projected year-2 tax
- $1,348 · $112/mo
- Expected delta
- +$585/yr (+$49/mo · 76.7%)
ⓘ Screening estimate from a state-policy table — verify with the county assessor before closing.
Climate risk First Street
- Flood 1/10 Low FEMA zone X (unshaded) · 0% chance over 30 yrs
- Wildfire 5/10 Major
- Heat 2/10 Low 7 d/yr ≥90°F today · 15 d/yr by 30 yrs out
- Wind 1/10 Low
- Air quality 9/10 Extreme 11 unhealthy d/yr today · 12 by 30 yrs out
Nearby sold comps map
Loading sold comps map…
Walkable amenities ~0.75 mi
Loading nearby amenities…
Taxation est. · year 1
- Rental income
- $36,197
- − Mortgage interest
- −$7,786
- − Property taxes
- −$763
- − Insurance
- −$695
- − Repairs & maintenance
- −$2,896
- − Management
- −$2,896
- − HOA
- −$15,420
- − Depreciation
- −$4,044
- Taxable income
- $1,697
- Est. tax owed @ 24.0%
- −$407
- After-tax cash flow
- $2,563/yr
For passive investors: Depreciation is non-cash, so a rental often shows a tax loss while cash-flowing — sheltering income. Rental losses are passive: they offset passive income freely, and up to $25,000/yr can offset ordinary (W-2) income if you actively participate and your MAGI is under $100k (phasing out to $0 by $150k); unused losses carry forward. On sale, claimed depreciation is recaptured at up to 25%, and gains may owe capital-gains tax (a 1031 exchange can defer both). Figures are a year-1 estimate at your 24.0% rate — not tax advice; consult a CPA.
Schools (NCES district)
- District
- Oregon Trail SD 46
- NCES district ID
- 4110890
- Math proficiency
- 47% ▬ 0.00%
- Reading proficiency
- 64% ▲ 1.00%
- Median HH income
- $61,406
- Composite
- 50.19/100
- National rank
- #4075
- State rank
- #12 of 183 in OR
Livability — Boring
No livability data for this city. (Only ~50 U.S. cities are tracked.)
Census & demographics
- Population (ZIP)
- 7,877
Population outlook (Clackamas County) Hauer SSP2
- Today (2025)
- 458,456 people
- By 2030
- 485,185 · +5.8%
- By 2040
- 532,932 · +16.2%
- By 2050
- 574,445 · +25.3%
- By 2075
- 665,497 · +45.2%
- By 2100
- 697,488 · +52.1%
Race, ethnicity, and origin ACS 2023
- Neighborhood character
- Predominantly White (73%)
- Race & ethnicity
- White 73% Hispanic / Latino 18% Two or more races 14% Asian 1%
- Hispanic origin (detail)
- Mexican 14%
- Common ancestry
- Portuguese 3% Slovak 3% Iranian 2%
- Foreign-born
- 4% · Canada, China
- Languages at home
- 91% English-only · Spanish 7% Other Indo-European 2%
Political lean MEDSL · Clackamas
- 2024 margin
- Lean D (+9.7) · D 53.4% · R 43.6% · Other 3.0%
- 2008→2024 swing
- -0.6pp no change · 2008: 10.4pp · 2024: 9.7pp
- All cycles
- 2024: D+9.7 2020: D+11.1 2016: D+6.1 2012: D+3.5 2008: D+10.4
Not yet ingested
- Civics
- —
Market trends
- HPI YoY
- ▼ -238.15%
- Current HPI
- 307.0405
- Rent YoY
- —
- Metro
- —
- State GDP YoY
- ▲ 2.05%
- F500 in state
- 2
Industry mix (Fortune 500 HQ in OR)
| Industry | F500 HQs | Revenue |
|---|---|---|
| Consumer Goods | 1 | $51B |
|
||
Price history
1 event — show timeline
- 2026-05-13 Listed $139,000 RMLS
Property tax history
+4.0%/yrLatest (2025): $763 · +4.6% YoY. Source: county tax records.
Cash-flow waterfall
monthlySold comps — $/sqft
last 12 mo · ≤1 miLoading sold comps…