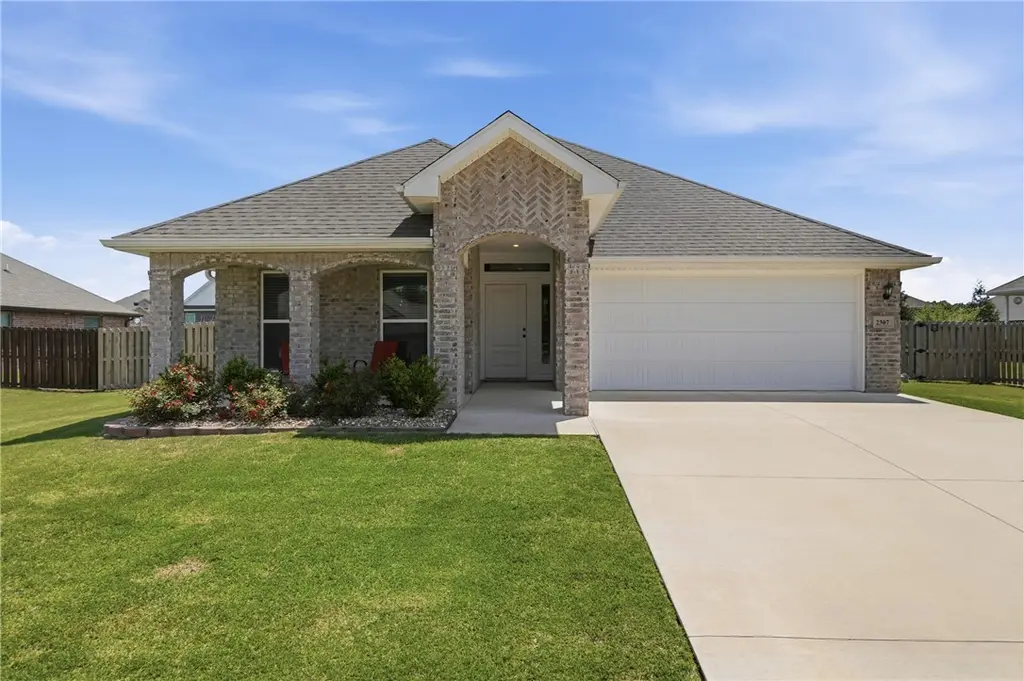
2307 Parnell St · Pea Ridge, AR
Flood risk No data
- FEMA flood zone
- —
- Chance of flooding over 30 yrs
- —
- Est. flood insurance / yr
- —
Fire risk No data
- Est. fire insurance / yr
- —
Heat risk No data
- Hot days now (above threshold)
- —
- Hot days in 30 yrs
- —
Wind risk No data
- Chance of severe wind over 30 yrs
- —
Air-quality risk No data
- Unhealthy air days now
- —
- Unhealthy air days in 30 yrs
- —
Risk factors via First Street. Map © Google.
Why this score? — see what drove the D- grade
The composite is a weighted blend of 9 inputs, each scored 0–100. Each bar is that input's sub-score; the figure is the points it added to the 100-point composite (weight × sub-score).
- ARV discount +11.3/15.0
- Appreciation +8.7/10.0
- Cash flow +6.2/30.0
- Schools +3.7/10.0
- Livability +3.4/5.0
- Rent growth +2.5/5.0
- Condition / age +2.5/5.0
- 1% rule +0.6/10.0
- DSCR +0.5/10.0
$355,000
🖨 Deal sheet (PDF) 📄 Offer letter ✓ Due diligence
Listing remarks MLS
Relish the complementary beauty of brick and stone with the curbside appeal of our 1700KI Series. This plan series offers over 1,749 square feet of open living space for your family to enjoy.
Key facts
- Covered front porch
- Full brick exterior
- Tile flooring
Tags
Property features AI
Finance
- HOA & community: Annual association fee ($200/year); Community features: Near fire station, near schools, sidewalks
Exterior
- Parking: Attached 2-car garage with garage door opener
- Security: Smoke detector(s)
- Utilities: Electricity available; Natural gas available; Public sewer; Public water
- Home design: Single-story home; Faces north; Slab foundation
- Construction: Brick construction; Architectural shingle roof
- Exterior features: Concrete driveway; Covered porch; Storage; Privacy wood fencing in back yard
Interior
- Kitchen: Dishwasher; Electric range; Microwave; Pantry; Eat-in kitchen
- Bedrooms: Two main-level bedrooms
- Flooring: Carpet; Tile
- Bathrooms: Two full bathrooms
- Heating & cooling: Central heating; Central air
- Interior features: Ceiling fans; Eat-in kitchen; Pantry; Walk-in closet(s); Window treatments; Blinds
- Laundry & utility: Electric water heater
Neighborhood map
What this means for you Summary
Snapshot
- This is a 3-bed/2.0-bath single-family listed at $355k.
Deal economics
- At list price, monthly cash flow is $-647 ($-8k/yr) — negative.
- To cash-flow at today's rent, offer at most $241k (32.2% below list).
- To meet the 1% rule (rent ≥ 1% of price), the offer needs to be $200k (43.8% below list).
- Recommended offer: $200k (43.8% below list) — sets the bar for 1% rule.
Location & tenants
- Location reads 67/100 on livability (#98 in AR) — a middle-class / working-renter tenant base. Strengths: employment A+, housing A+, cost of living A-; Watch: amenities F, commute F.
- Pea Ridge School District (suburban): math 43% / reading 42% proficiency, ranked #43 of 238 in AR (top 18%) — families likely to look elsewhere, expect single-tenant / working-renter base with shorter leases.
- Zoned schools: Pea Ridge Primary School (575 students, 36% FRL); Pea Ridge Middle School (math 47% / reading 42%, grade D, #61 of 201 statewide, top 32%, 395 students, 34% FRL); Pea Ridge High School (math 22% / reading 37%, grade F, #142 of 292 statewide, top 53%, 566 students, 24% FRL) — zoned schools at 31% FRL track the district average.
- Market conditions: 433 active listings in the ZIP; 28 comparable units currently listed for rent nearby; rentals at typical pace (median 26d on market — plan ~3-4 weeks tenant-placement turnaround); 46% of comp listings sitting > 30 days — soft ceiling on asking rent; solid renter incomes; 4,359 units permitted in Benton County in 2024 (402 in 5+ unit buildings).
Forward outlook
- In year one you build about $29k of equity ($2k loan paydown + $27k appreciation (7.5% local appreciation)).
- Benton County population projected at +56% by 2050 — long-run rental-demand tailwind backs the buy-and-hold thesis.
- By year 2, paydown + projected appreciation supports a ~$46k cash-out refi (75% LTV) — recoverable capital for the next deal without selling this one.
Negotiation context
- It's been on market 38 days — a 3% lower offer ($344k) is reasonable based on typical stale-listing flexibility.
- 3 sale attempts since 4y ago with the ask held roughly flat each time — persistent listings suggest the price (not the market) is what's stuck; bring a comps-based counter.
Questions for the listing agent
- What do current leases actually rent for vs. the listed asking? Can we see a recent rent roll and the last 12 months of T-12 income?
- It's been on market 38 days. Have you received any prior offers? Is the seller open to a 44% concession, seller financing, or rate buy-down credit?
- What does the HOA fee cover, when was the last increase, and are there any pending special assessments or reserve-fund shortfalls?
- Is there a deadline driving the sale (1031 exchange, divorce, estate, relocation)? That informs how much negotiation room exists.
- The area grade is low — what's the realistic commute time and amenity access for the typical tenant pool here? Any planned neighborhood developments (good or bad) we should know about?
- What's the average days-on-market for RENTAL listings here right now (not sales)? A rising rental-DOM trend means longer vacancies and softer asking-rent achievability than the comps imply.
- What's the recent tenant-quality profile in this submarket — average credit score on applications, eviction rate, late-payment / NSF rate, and stable-employment percentage? A property-management company in the area should have these aggregated.
- How much new for-sale + rental construction is in the pipeline within 1–3 miles? Heavy new supply typically softens prices + rents 12–24 months out; constrained supply supports both.
Investment metrics
- 1% rule
- 0.56% ✗
- Cap rate
- 4.11%
- Cash-on-cash
- -7.81%
- DSCR
- 0.65
- GRM
- 14.8
CMA / ARV
- ARV (median comp)
- $387,301
- List price
- $355,000
- Delta
- -8.34%
- Verdict
- FAIR
- Comps
- 20 within 1.0 mi
Show comp detail 12 sales within ~0.75 mi
| Address | Dist | Beds/Ba | Sqft | Sold | Price | $/sf | Match |
|---|---|---|---|---|---|---|---|
| 2420 England Ln | 0.20mi | 3/2.0 | 1,730 (-3%) | 2mo | $345,000 | $199 | 83 |
| 2406 Graham Ln | 0.12mi | 3/2.0 | 1,678 (-6%) | 5mo | $353,000 | $210 | 80 |
| 1908 Shelby St | 0.48mi | 3/2.0 | 1,750 (-2%) | 2mo | $415,000 | $237 | 72 |
| 1904 Shelby St | 0.49mi | 3/2.0 | 1,722 (-4%) | 6mo | $415,000 | $241 | 66 |
| 205 Ross Salvage Rd | 0.53mi | 4/2.0 (+1) | 1,717 (-4%) | 1mo | $350,000 | $204 | 63 |
| 1933 & 1911 Hazelton Rd | 0.46mi | 3/1.5 | 1,638 (-8%) | 3mo | $511,000 | $312 | 61 |
| 1900 Tull Dr | 0.55mi | 3/2.0 | 1,647 (-8%) | 1mo | $400,000 | $243 | 60 |
| 727 Macdonald Dr | 0.64mi | 3/2.0 | 1,651 (-8%) | 4mo | $395,000 | $239 | 54 |
| 1805 Gaines St | 0.41mi | 4/2.0 (+1) | 2,026 (+13%) | 2mo | $485,000 | $239 | 52 |
| 1905 Higgins St | 0.42mi | 4/2.0 (+1) | 2,026 (+13%) | 4mo | $468,900 | $231 | 50 |
| 500 Jackson Ln | 0.52mi | 4/2.0 (+1) | 1,563 (-12%) | 4mo | $335,000 | $214 | 47 |
| 1101 Tracey Ln | 0.68mi | 4/2.0 (+1) | 1,934 (+8%) | 5mo | $359,000 | $186 | 45 |
Match score weights: distance 35% · size 25% · config 20% · recency 20%. Top-matched comps best support the ARV.
Projected returns pro-forma
7.48% appreciation · 3.0% rent growth · sell at horizon
- IRR
- 12.8%
- Equity multiple
- 1.94×
- Total profit
- $93,161
- Equity at exit
- $257,168
- IRR
- 13.2%
- Equity multiple
- 4.02×
- Total profit
- $300,639
- Equity at exit
- $498,963
Cash invested: $99,400 (down + closing). Projections, not guarantees.
Landlord ↔ Tenant lean methodology
- Overall (STATE)
- 92 Strongly Landlord-Friendly
- State Arkansas
- 92 Strongly Landlord-Friendly · R+14
- County
- — inherits STATE
- City
- — inherits STATE
ZIP-level market 72751
- Home prices YoY
- 2.2%
- Active inventory
- 433
- Price-to-rent
- 14.8×
Monthly cashflow live
- Estimated rent
- $1,996 high interval (Pro) →
- Mortgage (P&I)
- −$1,862
- Tax from tax record
- −$197 /mo · $2,365/yr
- Insurance
- −$148
- HOA
- −$17
- Vacancy / Maint / Mgmt
- −$419
- Net cashflow
- $-647
Break-even live
Sensitivity live
| Price | -10% $-446 | -5% $-546 | +0% $-647 | +5% $-747 | +10% $-848 |
|---|---|---|---|---|---|
| Rent | -10% $-804 | -5% $-725 | +0% $-647 | +5% $-568 | +10% $-489 |
| Rate | -1.0pp $-468 | -0.5pp $-556 | base $-647 | +0.5pp $-739 | +1.0pp $-832 |
UW: 25.0% down · 7.5% · 30yr · 1.5% tax · 5.0% vac · 8.0% maint · 8.0% mgmt
Financing live
Cash to close
- Down payment
- $88,750
- Closing costs
- $10,650
- Reserves months
- —
- Total cash needed
- —
Loan-product check · same deal, 3 products live
Conventional
25% down · 7.5% · 30yr
- Down + closing
- —
- Monthly P&I
- —
- Monthly cashflow
- —
- DSCR
- —
- Eligible?
- —
Personal DTI + credit; lowest rate.
DSCR
20% down · 8.5% · 30yr
- Down + closing
- —
- Monthly P&I
- —
- Monthly cashflow
- —
- DSCR
- —
- Eligible?
- —
No personal income docs; deal must DSCR.
Hard money
10% down · 12.0% · 12mo
- Down + closing
- —
- Monthly P&I
- —
- Monthly cashflow
- —
- DSCR
- —
- Eligible?
- —
Short-term bridge; refi at stabilization.
Rent comps 28 comps
| Address | Beds | Baths | Sqft | Rent | $/sqft | DOM | Units | Dist |
|---|---|---|---|---|---|---|---|---|
| 2415 England Ln Pea Ridge, AR | 3.0 | 2.0 | 1678 | $2,600 | $1.55 | 16d | 1 | 0.16mi |
| 1006 Seaborn Way Pea Ridge, AR | 3.0 | 2.5 | 1750 | $1,650 | $0.94 | 45d | 1 | 0.57mi |
| 1002 Seaborn Way Pea Ridge, AR | 3.0 | 2.0 | 1750 | $1,650 | $0.94 | 45d | 1 | 0.58mi |
| 942 Seaborn Way Pea Ridge, AR | 3.0 | 2.5 | 1750 | $1,650 | $0.94 | 45d | 1 | 0.59mi |
| 940 Seaborn Way Pea Ridge, AR | 3.0 | 2.5 | 1750 | $1,650 | $0.94 | 45d | 1 | 0.59mi |
| 938 Seaborn Way Pea Ridge, AR | 3.0 | 2.5 | 1750 | $1,650 | $0.94 | 45d | 1 | 0.59mi |
| 938 Seaborn Way Pea Ridge, AR | 3.0 | 2.5 | 1750 | $1,650 | $0.94 | 25d | 1 | 0.59mi |
| 536 Lewis St Pea Ridge, AR | 3.0 | 2.0 | 1649 | $1,995 | $1.21 | 23d | 1 | 0.65mi |
| 1400 Hickery St Pea Ridge, AR | 3.0 | 2.0 | 1400 | $1,700 | $1.21 | 23d | 1 | 0.66mi |
| 801 Lewis St Pea Ridge, AR | 3.0 | 2.0 | 1744 | $2,000 | $1.15 | 15d | 1 | 0.67mi |
| 1036 Tracey Ln Pea Ridge, AR | 4.0 | 2.0 | 1911 | $2,075 | $1.09 | 25d | 1 | 0.70mi |
| 1812 Seay Cir Pea Ridge, AR | 4.0 | 2.5 | 1854 | $1,900 | $1.02 | 46d | 1 | 0.75mi |
| 112 Alder St Pea Ridge, AR | 3.0 | 2.0 | 1350 | $1,625 | $1.20 | 46d | 1 | 0.76mi |
| 308 Alder St Pea Ridge, AR | 3.0 | 2.0 | 1425 | $1,625 | $1.14 | 25d | 1 | 0.80mi |
| 308 Alder St Pea Ridge, AR | 3.0 | 2.0 | 1425 | $1,625 | $1.14 | 45d | 1 | 0.80mi |
| 1393 Hutchinson St Pea Ridge, AR | 3.0 | 2.0 | 1580 | $1,675 | $1.06 | 45d | 1 | 1.00mi |
| 1910 Hahn St Pea Ridge, AR | 3.0 | 2.0 | 1555 | $1,900 | $1.22 | 45d | 1 | 1.10mi |
| 2301 Langford St Pea Ridge, AR | 3.0 | 2.0 | 1637 | $1,800 | $1.10 | 23d | 1 | 1.16mi |
| 585 Lynn Dr Pea Ridge, AR | 3.0 | 2.0 | 1804 | $1,650 | $0.91 | 45d | 1 | 1.28mi |
| 1711 Cuppett Cir Pea Ridge, AR | 3.0 | 2.5 | 1604 | $1,750 | $1.09 | 25d | 1 | 1.36mi |
| 1713 Cuppett Cir Pea Ridge, AR | 3.0 | 2.5 | 1503 | $1,650 | $1.10 | 25d | 1 | 1.36mi |
| 305 Meadows Ct Pea Ridge, AR | 4.0 | 2.0 | 2451 | $2,400 | $0.98 | 16d | 1 | 1.41mi |
| 581 W Pickens Rd Pea Ridge, AR | 3.0 | 2.5 | 1500 | $1,600 | $1.07 | 45d | 1 | 1.45mi |
| 575 W Pickens Rd Pea Ridge, AR | 3.0 | 2.5 | 1500 | $1,600 | $1.07 | 45d | 1 | 1.46mi |
| 805 Carlock Dr Pea Ridge, AR | 4.0 | 2.5 | 2410 | $2,550 | $1.06 | 16d | 1 | 1.46mi |
| 547 W Pickens Rd Pea Ridge, AR | 3.0 | 2.5 | 1500 | $1,600 | $1.07 | 16d | 1 | 1.48mi |
| 533 W Pickens Rd Pea Ridge, AR | 3.0 | 2.5 | 1500 | $1,600 | $1.07 | 16d | 1 | 1.49mi |
| 521 W Pickens Rd Pea Ridge, AR | 3.0 | 2.5 | 1500 | $1,600 | $1.07 | 16d | 1 | 1.49mi |
HOA detail
- Monthly dues
- $17 · $204/yr
Listing history 23 events
-
2026-06-22days on market $355,000 Active 38 DOM
-
2026-06-18days on market $355,000 Active 35 DOM
-
2026-06-17days on market $355,000 Active 34 DOM
-
2026-06-16days on market $355,000 Active 33 DOM
-
2026-06-15days on market $355,000 Active 32 DOM
-
2026-06-14days on market $355,000 Active 30 DOM
-
2026-06-13days on market $355,000 Active 29 DOM
-
2026-06-10days on market $355,000 Active 27 DOM
-
2026-06-09days on market $355,000 Active 26 DOM
-
2026-06-08days on market $355,000 Active 25 DOM
-
2026-06-07days on market $355,000 Active 24 DOM
-
2026-06-03days on market $355,000 Active 20 DOM
-
2026-06-02days on market $355,000 Active 19 DOM
-
2026-06-01days on market $355,000 Active 18 DOM
-
2026-05-31days on market $355,000 Active 17 DOM
-
2026-05-31days on market $355,000 Active 16 DOM
-
2026-05-14$355,000 Active 942-char remark
-
2022-10-28soldstatus $332,446 Closed 195-char remark
Show marketing remark (195 chars)
Relish the complementary beauty of brick and stone with the curbside appeal of our 1700KI Series. This plan series offers over 1,749 square feet of open living space for your family to enjoy.
-
2022-10-11status Pending 195-char remark
Show marketing remark (195 chars)
Relish the complementary beauty of brick and stone with the curbside appeal of our 1700KI Series. This plan series offers over 1,749 square feet of open living space for your family to enjoy.
-
2022-09-15status Active 195-char remark
Show marketing remark (195 chars)
Relish the complementary beauty of brick and stone with the curbside appeal of our 1700KI Series. This plan series offers over 1,749 square feet of open living space for your family to enjoy.
-
2022-09-15price $337,446 195-char remark
Show marketing remark (195 chars)
Relish the complementary beauty of brick and stone with the curbside appeal of our 1700KI Series. This plan series offers over 1,749 square feet of open living space for your family to enjoy.
-
2022-05-27status Pending 195-char remark
Show marketing remark (195 chars)
Relish the complementary beauty of brick and stone with the curbside appeal of our 1700KI Series. This plan series offers over 1,749 square feet of open living space for your family to enjoy.
-
2022-05-25$354,725 Active 195-char remark
Show marketing remark (195 chars)
Relish the complementary beauty of brick and stone with the curbside appeal of our 1700KI Series. This plan series offers over 1,749 square feet of open living space for your family to enjoy.
ⓘ Source: listings_history table (triggers on properties + properties_extension) + one-shot
backfill from property_details.listing_events for pre-trigger history.
Tax reassessment forecast AR · Resets to sale price
- Current annual tax
- $2,365 · $197/mo
- Projected year-2 tax
- $2,365 · $197/mo
- Expected delta
- $0/yr ($0/mo · 0.0%)
ⓘ Screening estimate from a state-policy table — verify with the county assessor before closing.
Nearby sold comps map
Loading sold comps map…
Walkable amenities ~0.75 mi
Loading nearby amenities…
Taxation est. · year 1
- Rental income
- $23,954
- − Mortgage interest
- −$19,886
- − Property taxes
- −$2,365
- − Insurance
- −$1,775
- − Repairs & maintenance
- −$1,916
- − Management
- −$1,916
- − HOA
- −$204
- − Depreciation
- −$10,327
- Taxable loss
- −$14,435
- Est. tax savings @ 24.0%
- +$3,464
- After-tax cash flow
- $-4,295/yr
For passive investors: Depreciation is non-cash, so a rental often shows a tax loss while cash-flowing — sheltering income. Rental losses are passive: they offset passive income freely, and up to $25,000/yr can offset ordinary (W-2) income if you actively participate and your MAGI is under $100k (phasing out to $0 by $150k); unused losses carry forward. On sale, claimed depreciation is recaptured at up to 25%, and gains may owe capital-gains tax (a 1031 exchange can defer both). Figures are a year-1 estimate at your 24.0% rate — not tax advice; consult a CPA.
Schools (NCES district)
- District
- Pea Ridge School District
- NCES district ID
- 0503030
- Math proficiency
- 43% ▼ -3.00%
- Reading proficiency
- 42% ▼ -8.00%
- Median HH income
- $53,156
- Composite
- 36.88/100
- National rank
- #4546
- State rank
- #43 of 238 in AR
Livability — Pea Ridge
- Score
- 67/100
- State rank
- #98
- US rank
- #10429
Category grades
Schools grade is shown separately in the Schools card above.
Census & demographics
- Census place
- Pea Ridge, AR
- County
- Benton County · 259,241 people
- City population
- 9,997
- Metro
- Fayetteville-Springdale-Rogers, AR
- Population (ZIP)
- 9,997
- Household income
- $95,299
- Rent vs Own
- Severe rent burden
- 83.0
Population outlook (Benton County) Hauer SSP2
- Today (2025)
- 318,683 people
- By 2030
- 353,481 · +10.9%
- By 2040
- 425,280 · +33.4%
- By 2050
- 497,239 · +56.0%
- By 2075
- 662,114 · +107.8%
- By 2100
- 776,431 · +143.6%
Race, ethnicity, and origin ACS 2023
- Neighborhood character
- Predominantly White (72%)
- Race & ethnicity
- White 72% Two or more races 17% Hispanic / Latino 7% Black 3%
- Hispanic origin (detail)
- Mexican 5%
- Common ancestry
- Slovak 4% Scottish 2% Lithuanian 2%
- Foreign-born
- 7% · Canada, Vietnam
- Languages at home
- 97% English-only · Spanish 2% Vietnamese 1%
Political lean MEDSL · Benton
- 2024 margin
- Strong R (+27.0) · D 35.2% · R 62.1% · Other 2.7%
- 2008→2024 swing
- +9.6pp toward D · 2008: -36.5pp · 2024: -27.0pp
- All cycles
- 2024: R+27.0 2020: R+26.4 2016: R+34.9 2012: R+40.4 2008: R+36.5
Not yet ingested
- Civics
- —
Market trends
- HPI YoY
- ▲ 7.48%
- Current HPI
- 352.7133
- Rent YoY
- —
- Metro
- Fayetteville-Springdale-Rogers, AR
- State GDP YoY
- ▲ 3.80%
- F500 in state
- 10
Industry mix (Fortune 500 HQ in AR)
| Industry | F500 HQs | Revenue |
|---|---|---|
| Retail | 1 | $681B |
|
||
| Food / Agriculture | 1 | $53B |
|
||
| Retail / Energy | 1 | $22B |
|
||
| Transportation / Logistics | 1 | $12B |
|
||
| Energy | 1 | $4B |
|
||
Price history
+0.1% since first listed7 events — show timeline
- 2026-05-14 Listed $355,000 NWARMLS
- 2022-10-28 Sold (MLS) $332,446 NWARMLS
- 2022-10-11 Pending — NWARMLS
- 2022-09-15 Relisted — NWARMLS
- 2022-09-15 Price Changed $337,446 NWARMLS
- 2022-05-27 Pending — NWARMLS
- 2022-05-25 Listed $354,725 NWARMLS
Property tax history
+80.2%/yrLatest (2025): $2,365 · +3.3% YoY. Source: county tax records.
Cash-flow waterfall
monthlySold comps — $/sqft
last 12 mo · ≤1 miLoading sold comps…